Technical analysis by VarghaVafa about Symbol MSTRX on 7/10/2025

VarghaVafa
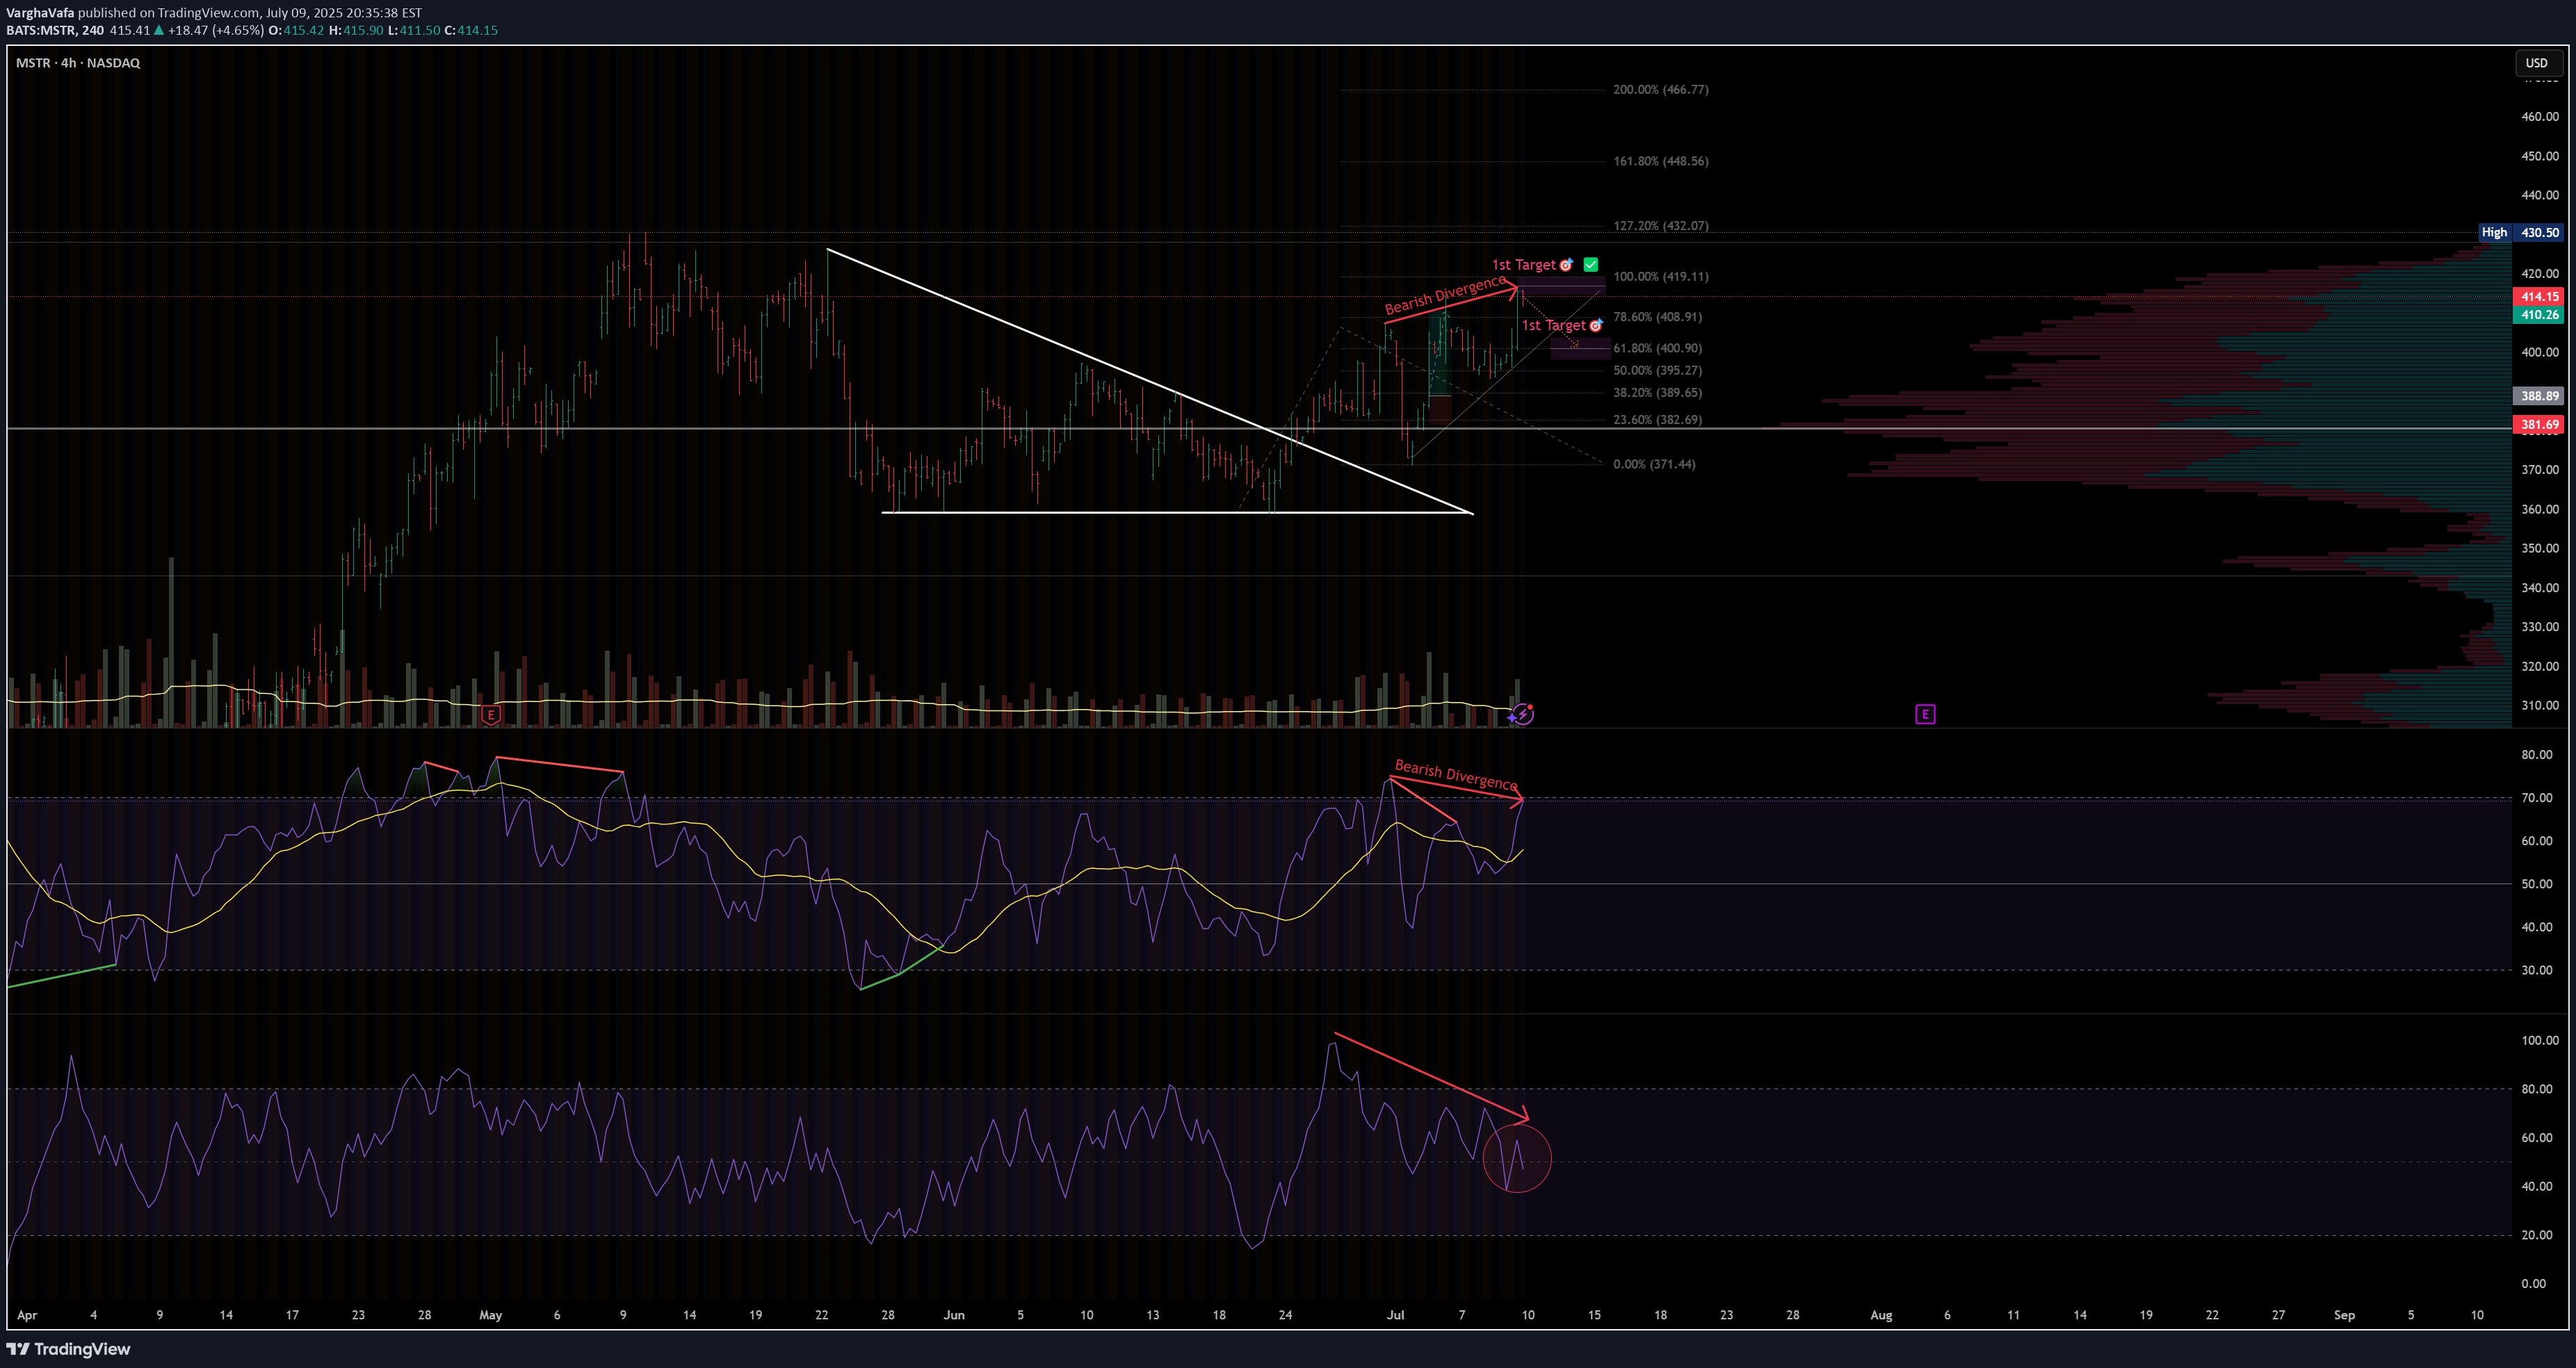
Setup Breakdown Price recently broke out from a falling wedge and hit both technical targets — first at ~$409 (78.6%) and then ~$419 (100%). However, momentum is weakening despite price hovering near the highs. We're now seeing early bearish divergence on multiple timeframes and oscillators, signaling potential reversal or pullback. ⚠️ Bearish Signals RSI Divergence Price made higher highs while RSI made lower highs — classic bearish divergence. Double confirmation Both RSI with MA and pure RSI show declining momentum. Volume drop Price is rising but volume is not following — another early warning sign. 🔻 Potential Breakdown Trigger If price closes below $407–405, that would break short-term structure and confirm the divergence risk. Watch for RSI to drop below 50 and volume to spike on red candles — that would likely accelerate the correction. 📉 Downside Zones to Watch $400 => 61.8% Fib retracement + consolidation base $395 => 50% Fib retracement $389 => 38.2% Fib retracement + prior breakout support ✅ Summary Divergence is still early but meaningful — momentum does not support current price highs. A breakdown from current levels could open a short window down to $386 or even $371 if confirmed. Watch RSI + volume + candle structure for confirmation before acting. Disclaimer: This is not financial advice. Always manage your own risk and follow your trading plan. #MSTR #BearishDivergence #RSI #Fibonacci #MomentumShift #VolumeAnalysis #TradingView #TechStocks #4HChart
