
VIAQUANT
@t_VIAQUANT

What symbols does the trader recommend buying?
Purchase History
پیام های تریدر
Filter
VIAQUANT
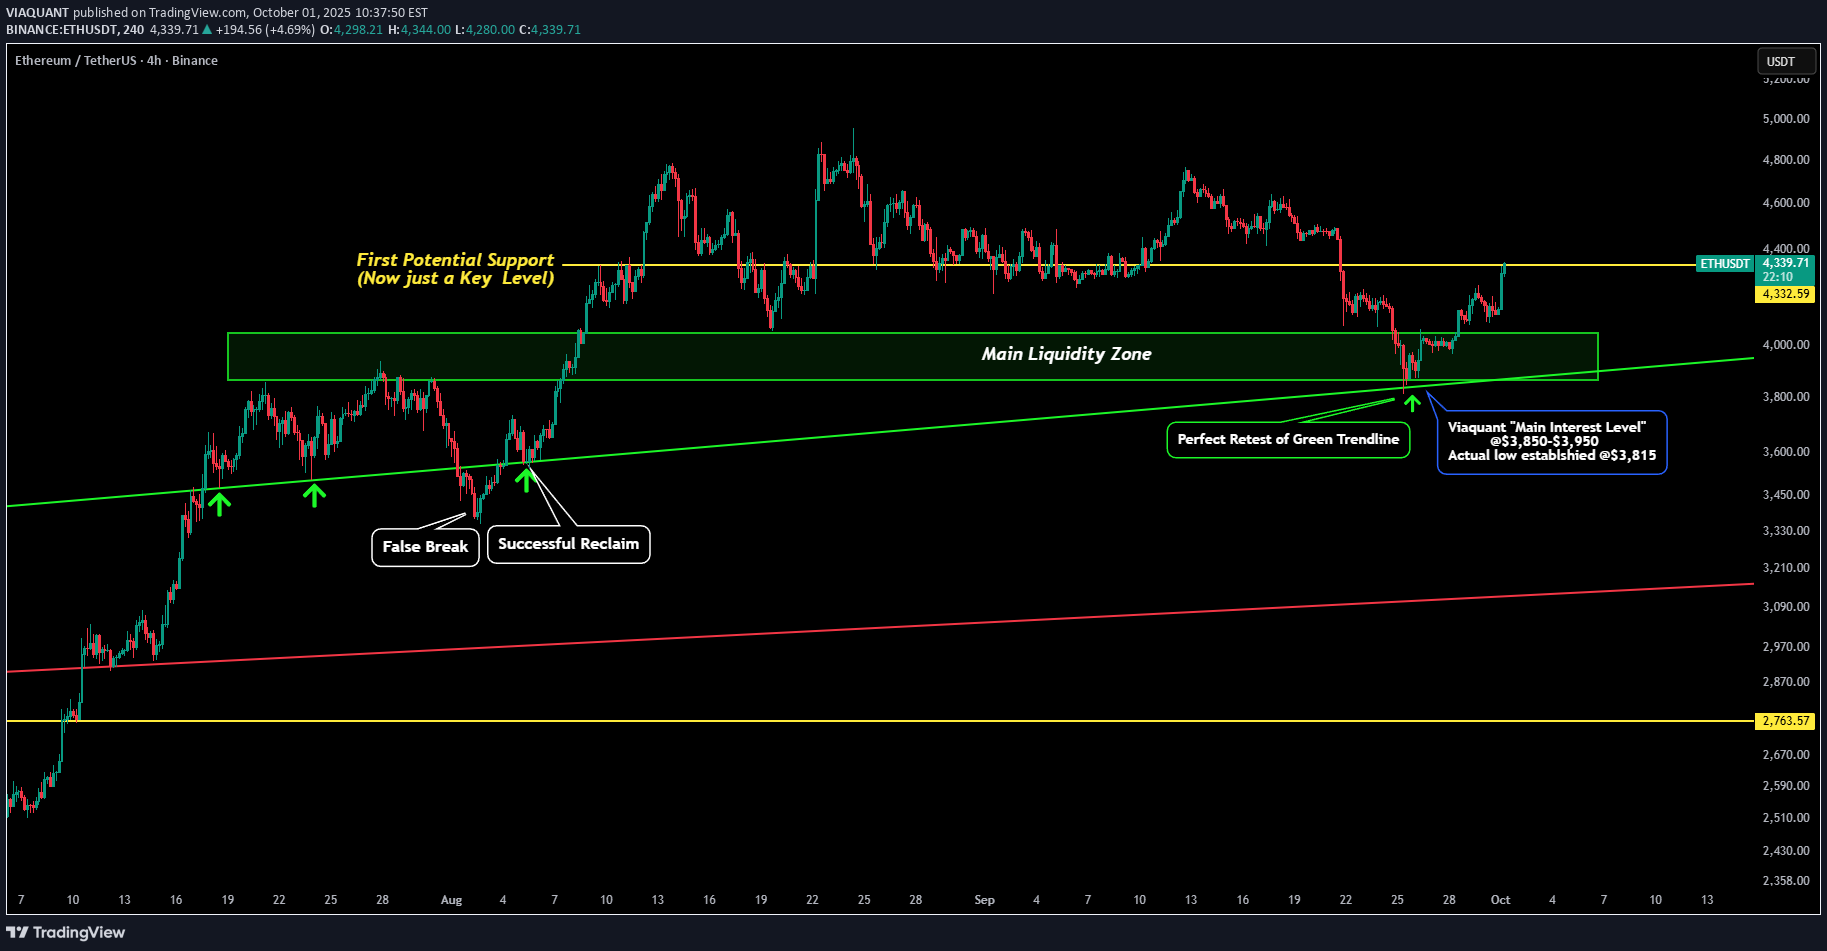
Here is an update to our post over 45 days ago: From the time we hit the top @$4,950 we laid out all the levels to watch for ETH. We were watching some short term levels but the MAIN level we were watching for was the green box titled "MAIN LIQUIDITY ZONE". This zone ranged from $3,800-$4,100. Since this was a multi-year resistance level we were watching it to act as a new macro support level. We pointed out how "buyers should find this level very appealing if we get a dip to there. The main interest level would lie between $3,850-$3,950." Current day we can see how perfectly this prediction played out. First main thing to not is the accuracy of our targets: the main level of interest ($3,850-3,950) was just $35 higher than where the actual bottom was established! Also the "MAIN LIQUDITY ZONE" was even better with it only be $15 lower than the actual bottom being established at $3,815!! The next key thing to note is how accurately price retested our green trendline. I have been posting about this green trendline for the past 3 months! Here are some other charts where I had this trendline that called the bottom drawn.
VIAQUANT
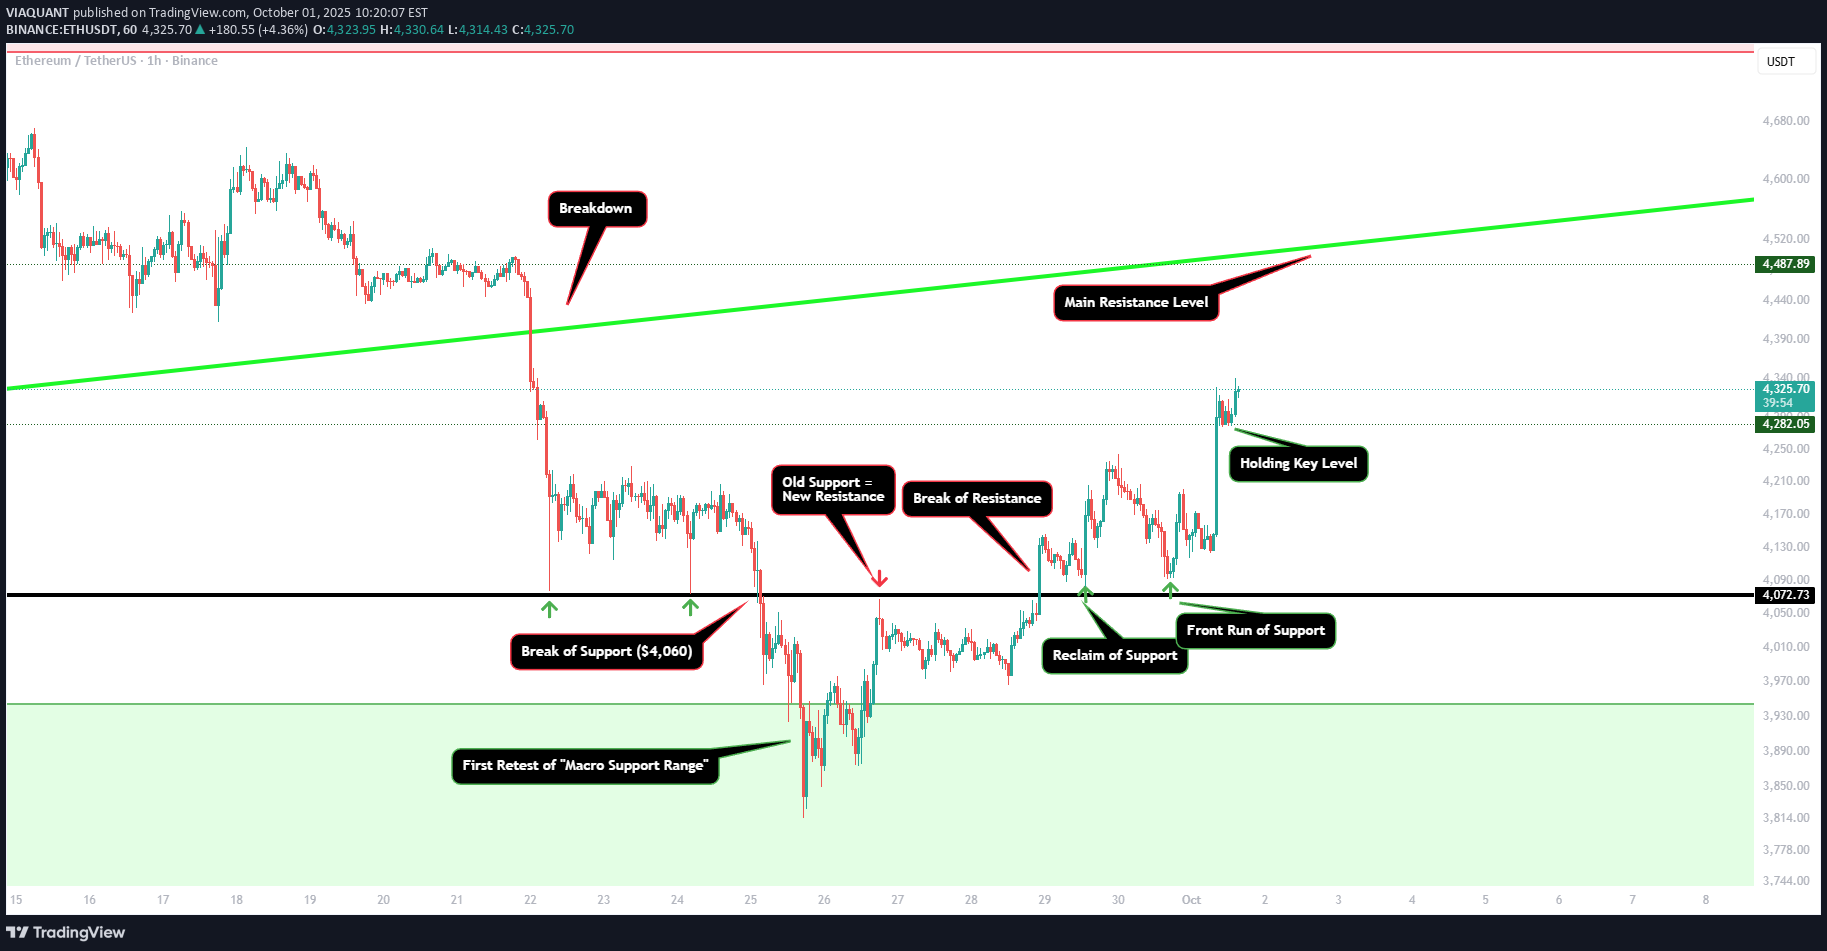
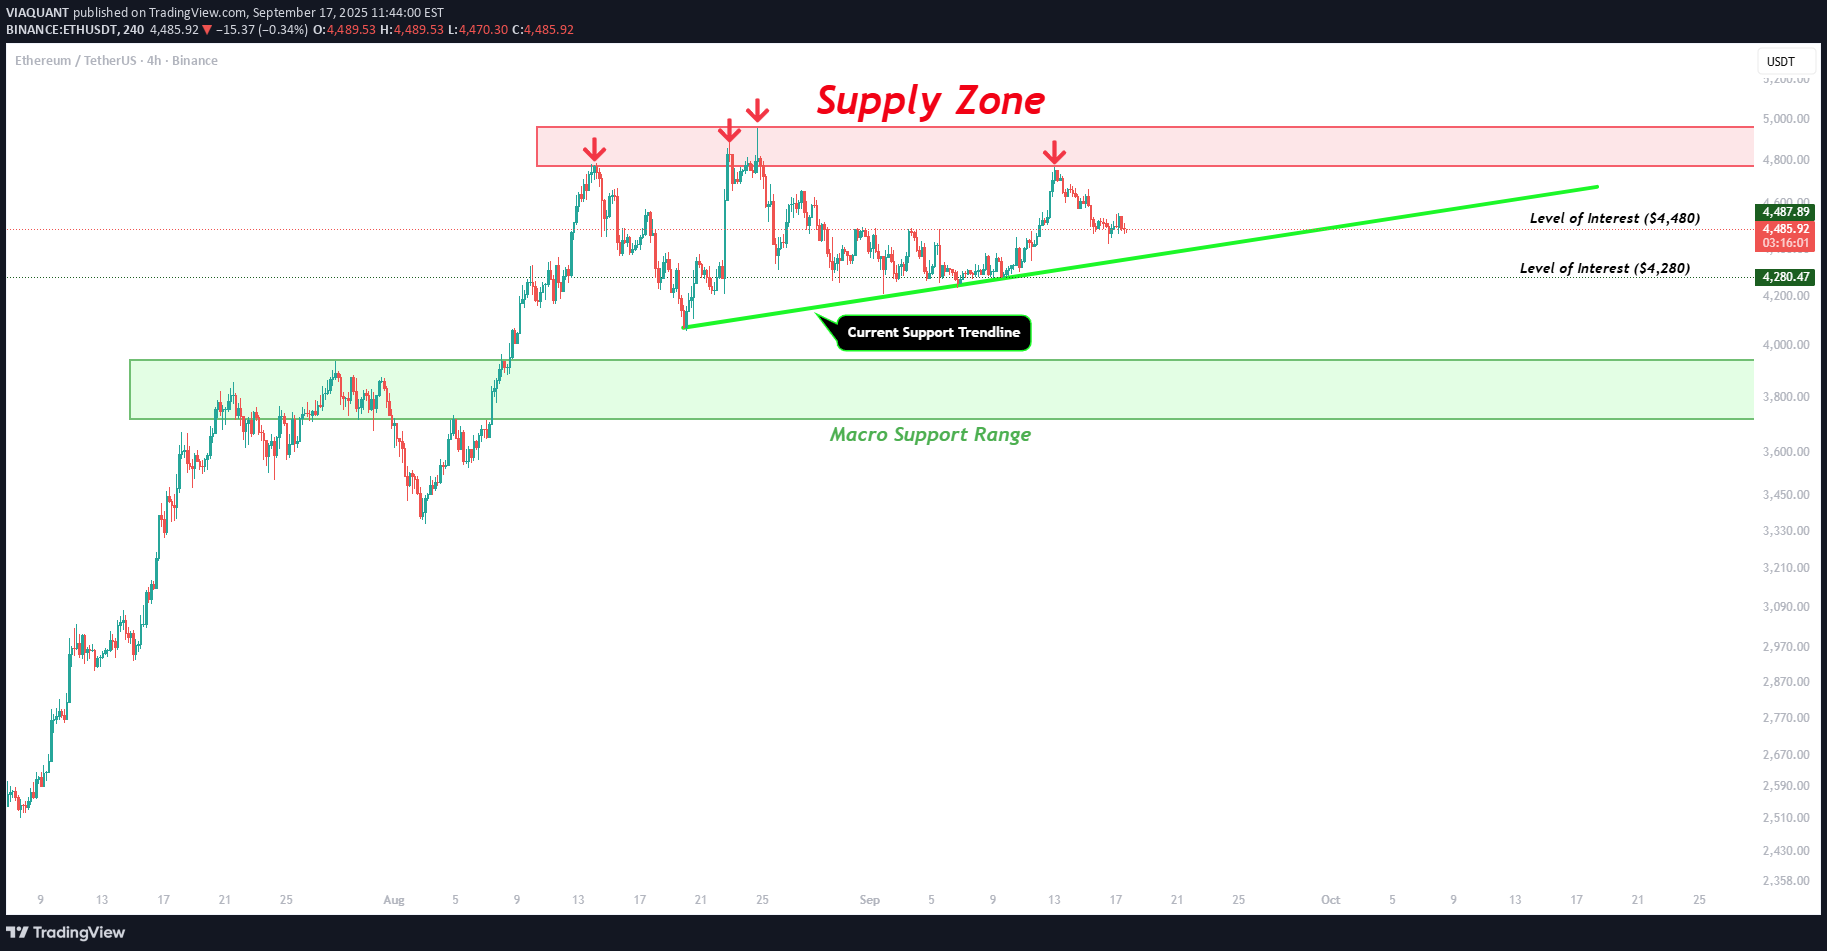
Here is an update to our last post: In our last post we identified ETH was testing its key macro support of the green box and would be looking for a low established in that range. We saw our $4,060 support level broken which led price to fall into our green box. Once price initially rebounded from the green box we topped out at the $4,060 level as (old support became new resistance). After a secondary dip to the $3,950 level price rebound and broke our resistance. Upon the pullback we reclaimed our $4,060 as support again! This was our first major bullish signal. Then the next dip we got bulls front ran price around $4,090 showing strong demand once that level of support was reclaimed. Now we have seen a move to our first key level around $4,280. All candle bodies have been holding above this level and need to continue to do so to potentially make a move towards our main resistance level. This level would be the green trendline of old support that could now act as new resistance so keep an eye out for that.
VIAQUANT
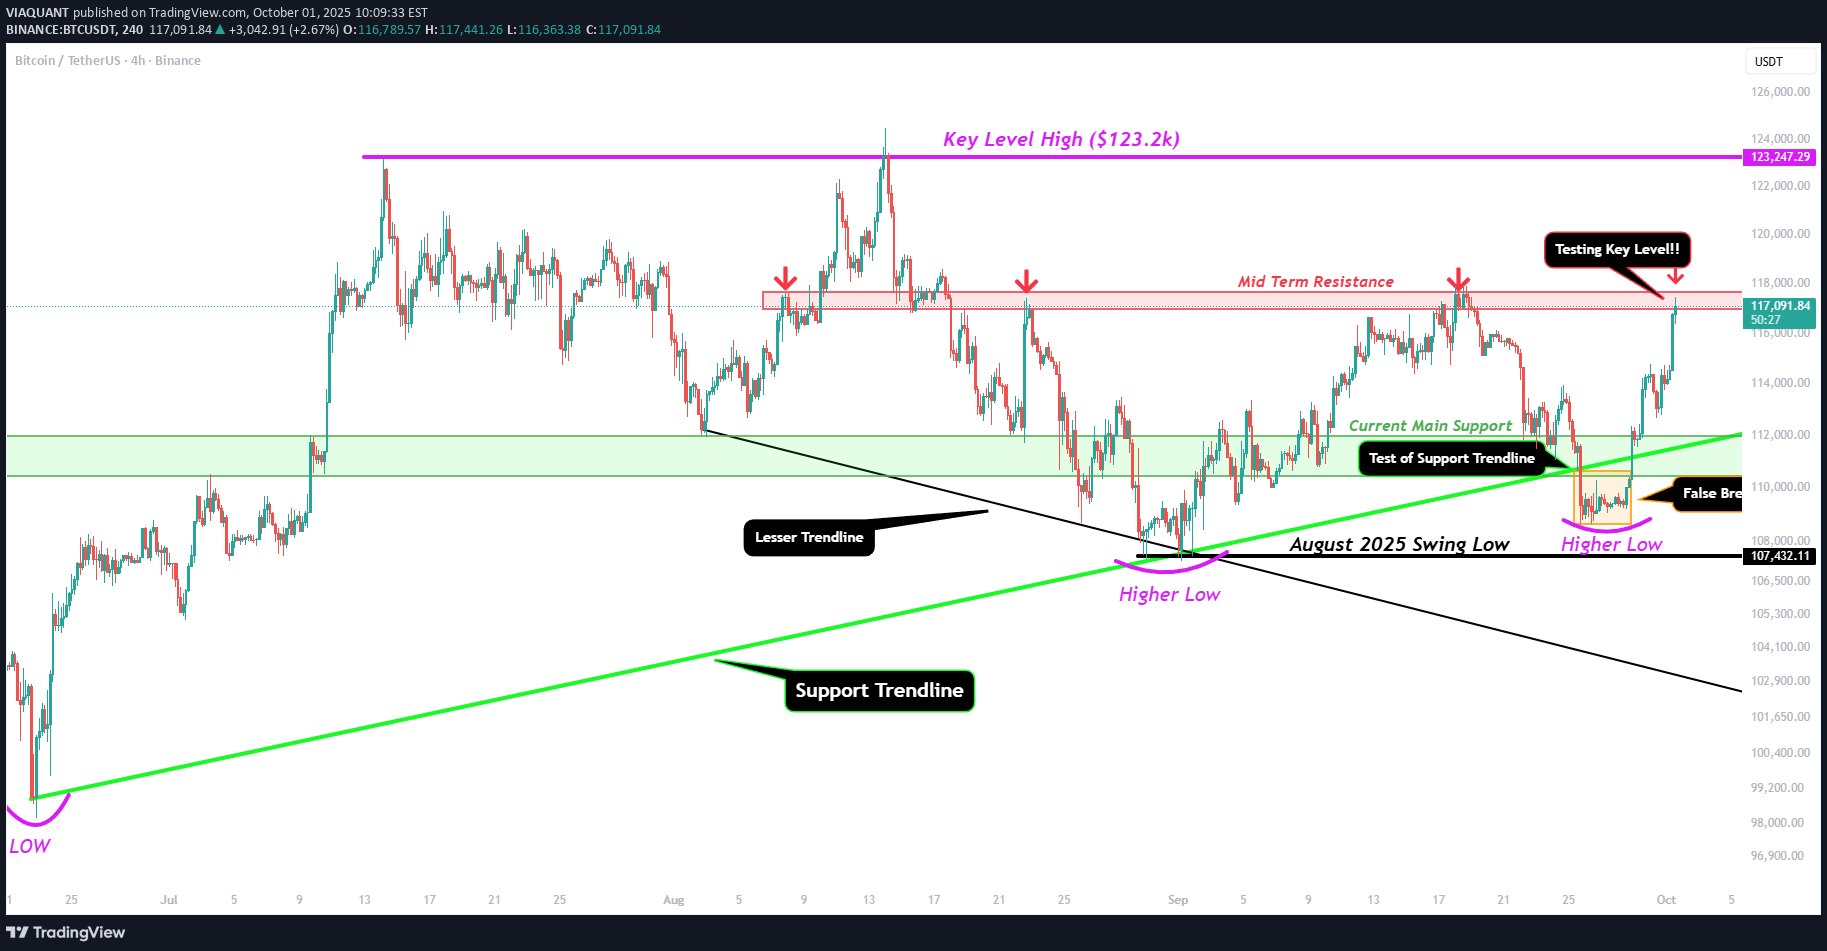
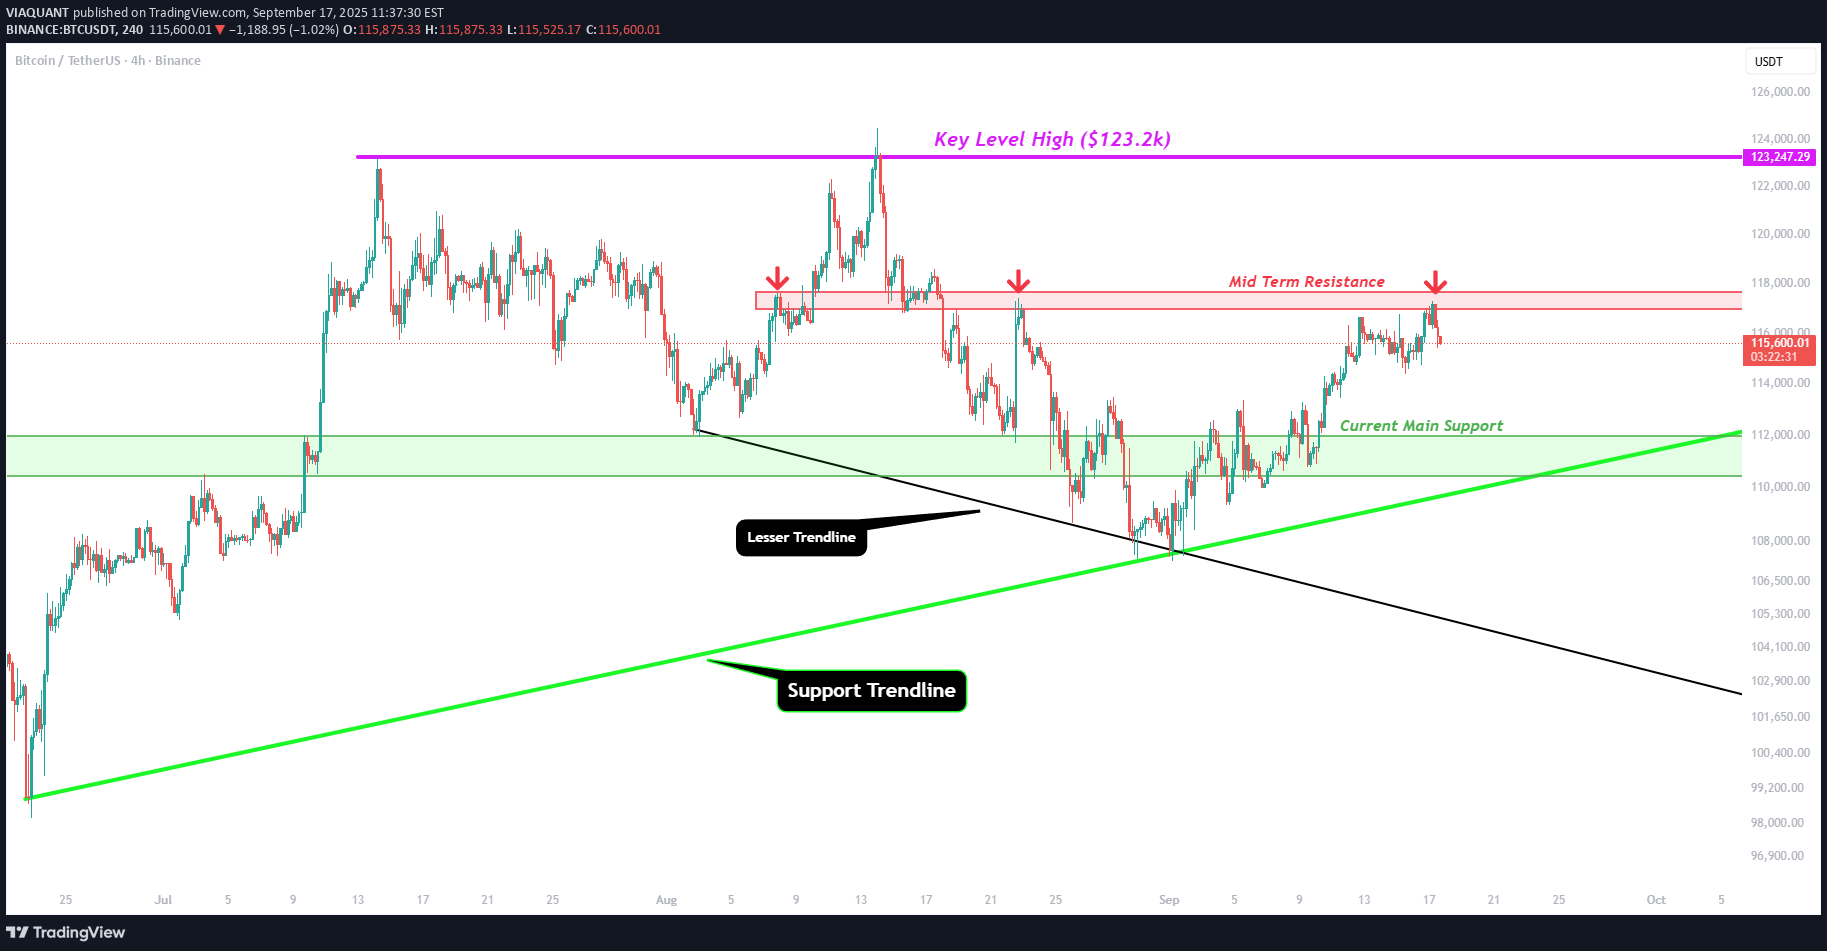
Here is an update to my last post: In my last post I was outlining how BTC was trying to hold the support of the trendline. For a brief period of time, price did breakdown to create a "false break" of the trendline. However this still created a higher low in the trend still representing bullish momentum. Once price reclaimed the green trendline we have seen a large rally back to the upside. Now, BTC is testing our key level of resistance "Mid Term Resistance". This red box has acted as a great sell zone before price made a move back to the downside. So what's next? If BTC can start closing candles above our red box then watch for these level to the upside. Level 1: $120,000-120,400 (Key daily level) Level 2: $123,200-124,400 (ATH) Level 3: $129,000-$130,000 (first 1.618) Level 4: $135,400 (predictive 1.618 top) However, if price get rejected again from the red box, we want to see either the green trendline or green box hold to create another higher low. If we fail to create a higher low that could represent the start of the next bear market, but for now the trend is intact!
VIAQUANT
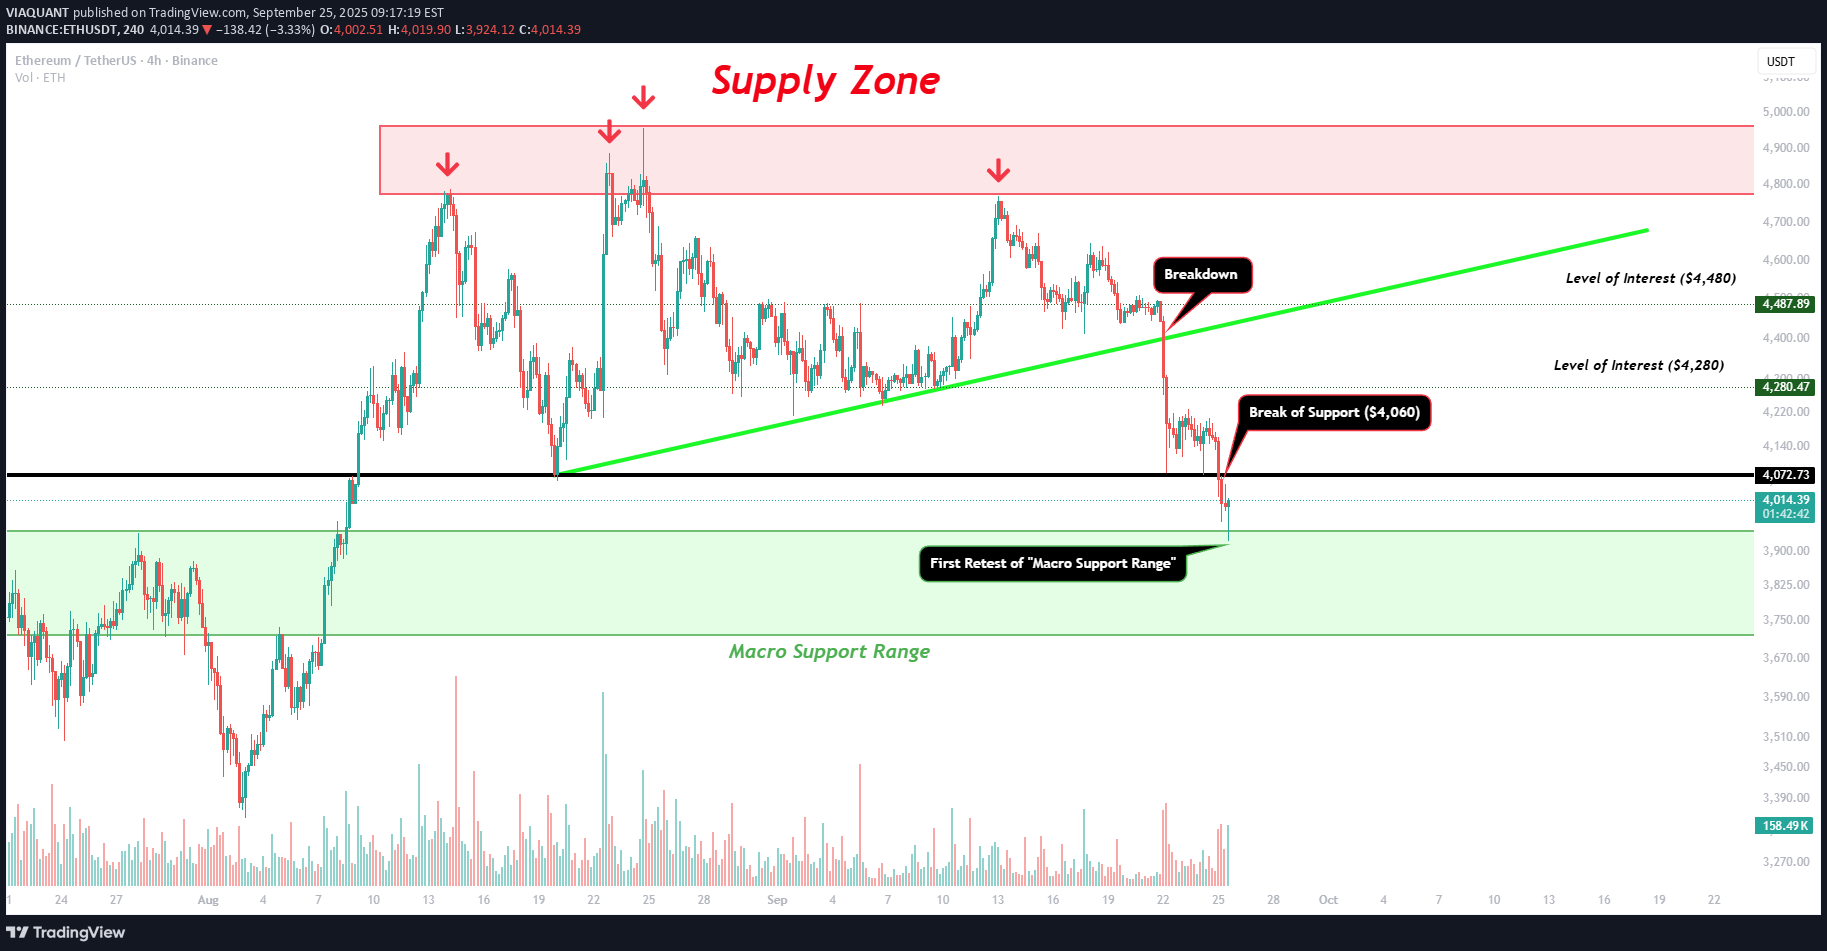
Here is a link to our last post: We were seeing some market structure be build with three different bottoms come in around the $4,060 level. However, last night those lows were breached which lead us to our first test of the macro support range. This area ranges from about $3,700 to $3,950. It is very important as it was a level of resistance for many years and we would like to see the market establish this area as a new level of support. If this is established the trend will be intact to push toward highs. We just saw the first test and bounce from the top of the box at $3,950. Will be key to monitor how the market reacts to this price action and will be looking for any further bottom developments in this macro support range.
VIAQUANT
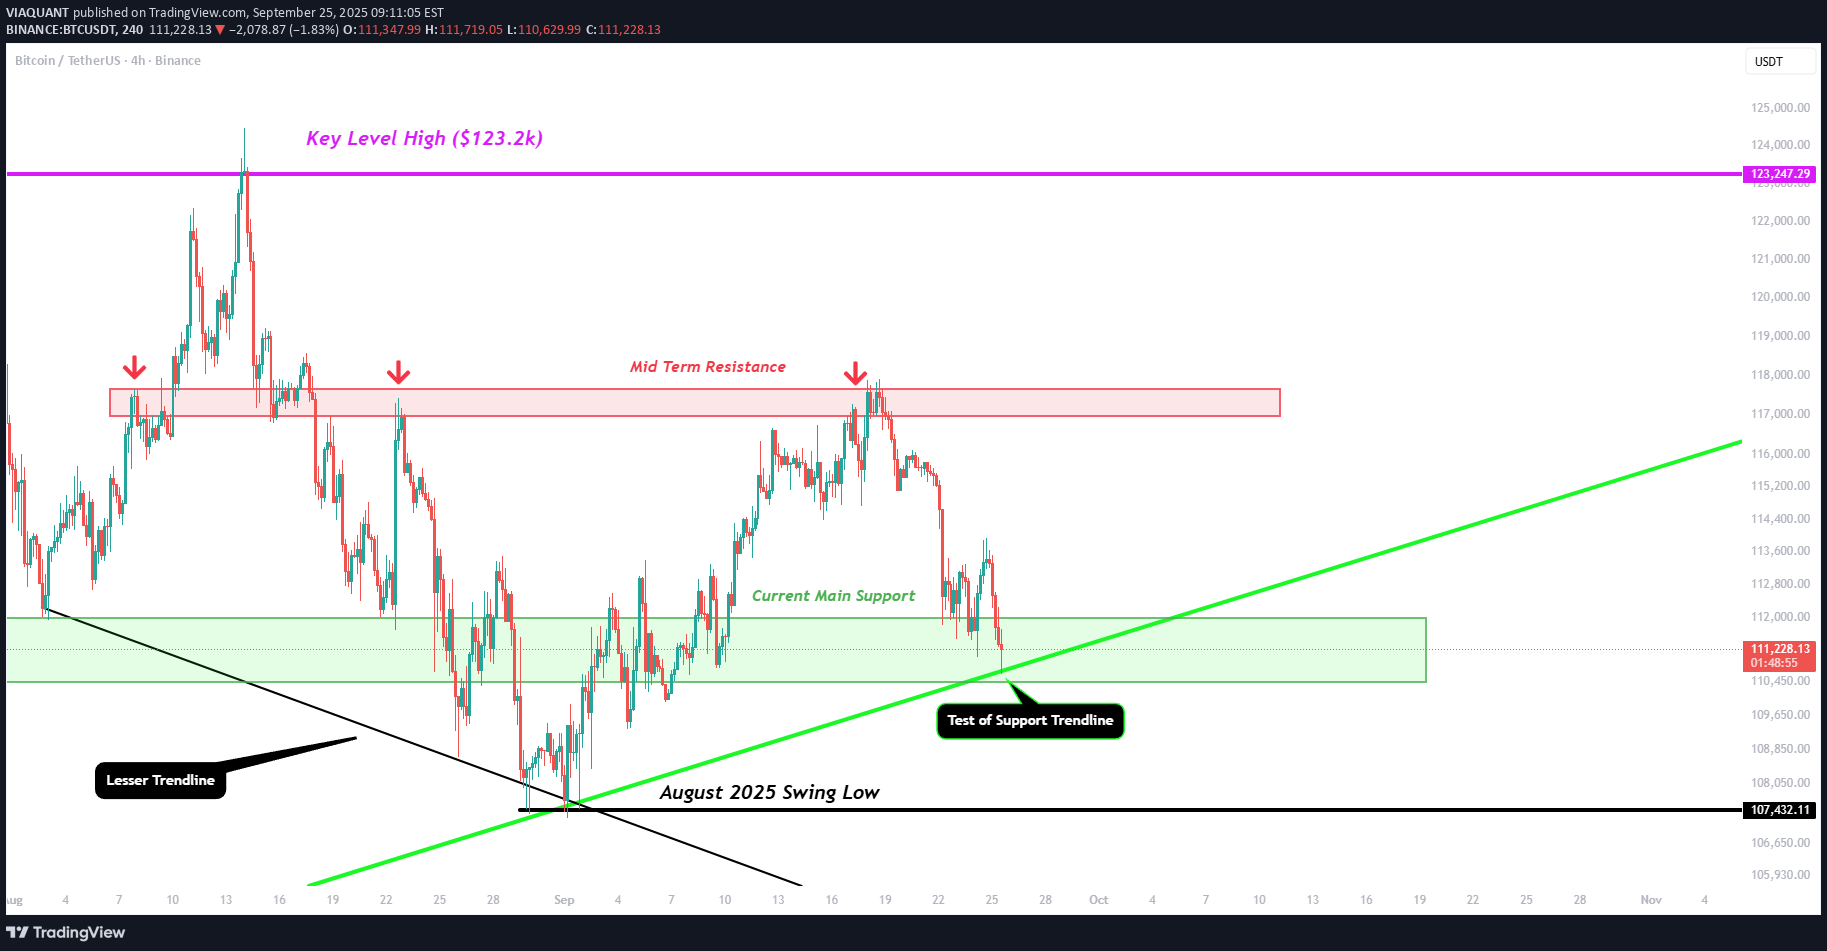
We have seen price fall again into our green box of support. This is also with a test of our green trendline. The fact buyers have already started to step in at that trendline is a good sign. This could be another low point for the trend establishing another test of support upon that trendline. However, if this trendline is broken watch the August 2025 swing low around $107,500. If we start seeing candles close below that level then it will create a lower low for our trend and most likely lead to sub $100k levels.
VIAQUANT
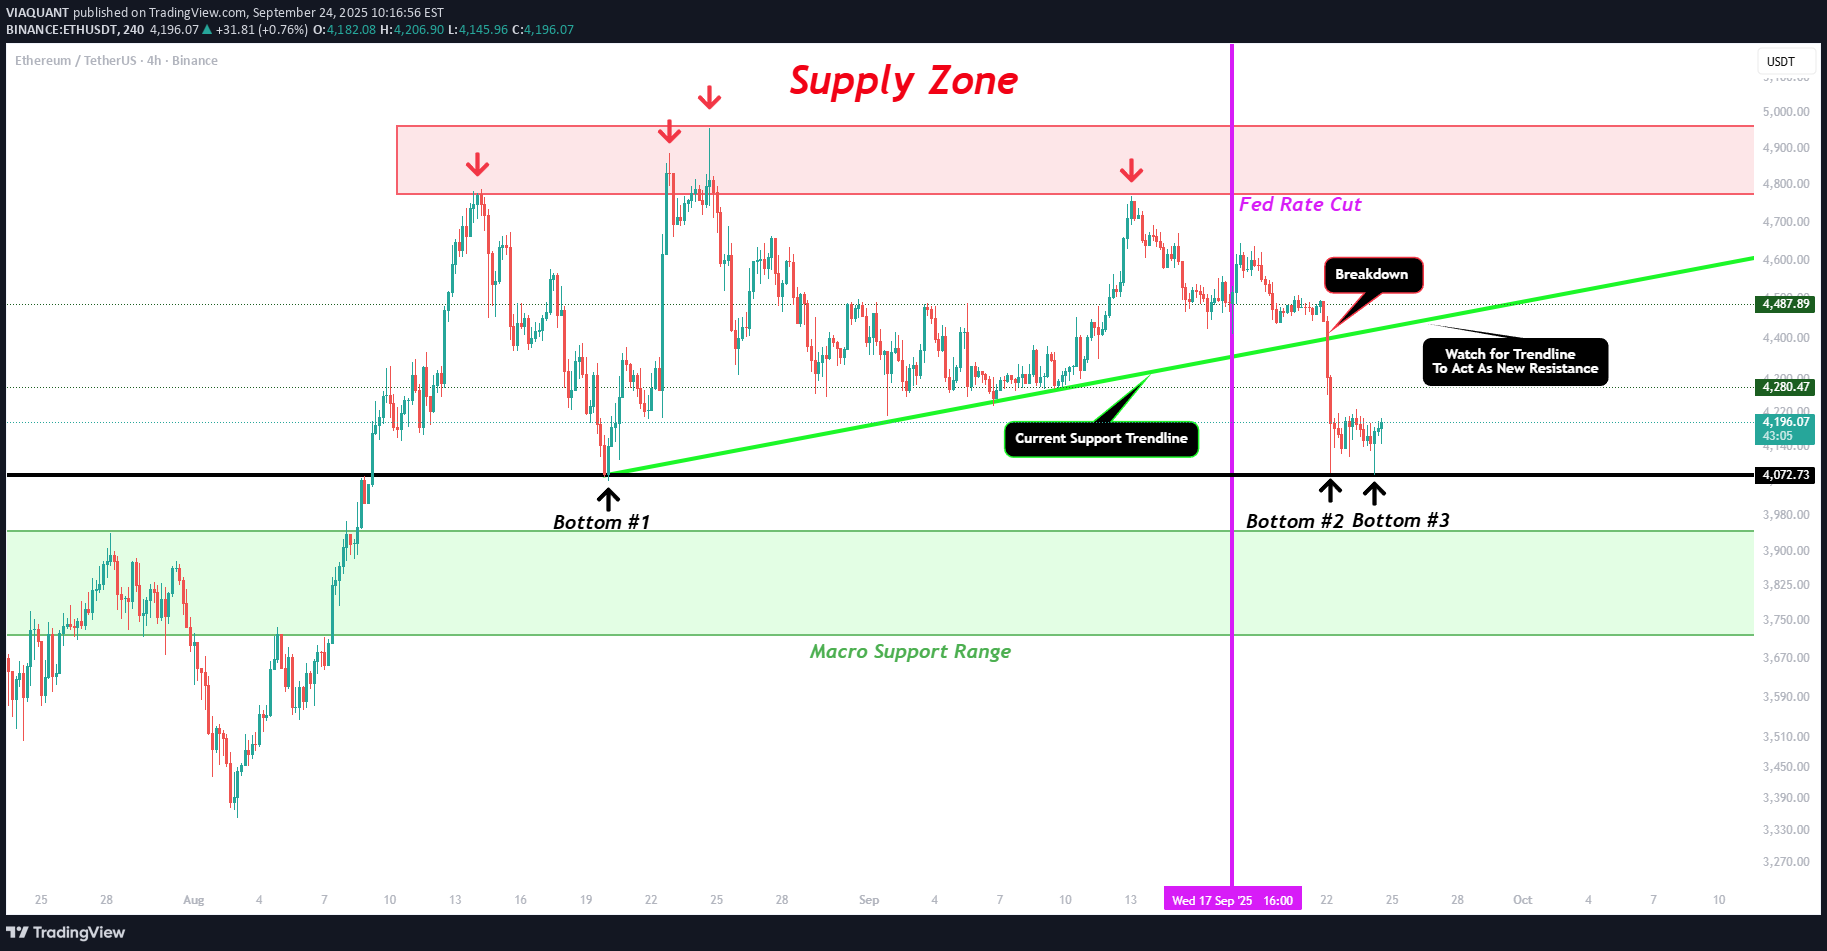
Here is the chart for pre rate cuts: After about a week of price action development we have a much better idea for the next potential move for ETH. After the rate cut (vertical purple line) we saw price have a small rally followed by a swift move to the downside. Our green trendline (current support trendline) was breached which caused a crash from around $4,400 to $4,070. Now price has established a clear low for the time being around the $4,070 level. This shows what looks like a TRIPLE BOTTOM (black arrows + black ray)! There is currently strong demand at the level which should help push price back to the $4,400-$4,500 level. If we do so this move to the upside it will be very important to watch how price action plays with our green support trendline. Now that price is below that trendline, any retest could act as a new level of sell pressure. Right now things look good for a move back to that level, but if our triple bottom around $4,070 is closed below then a move into that macro support range will be likely.
VIAQUANT
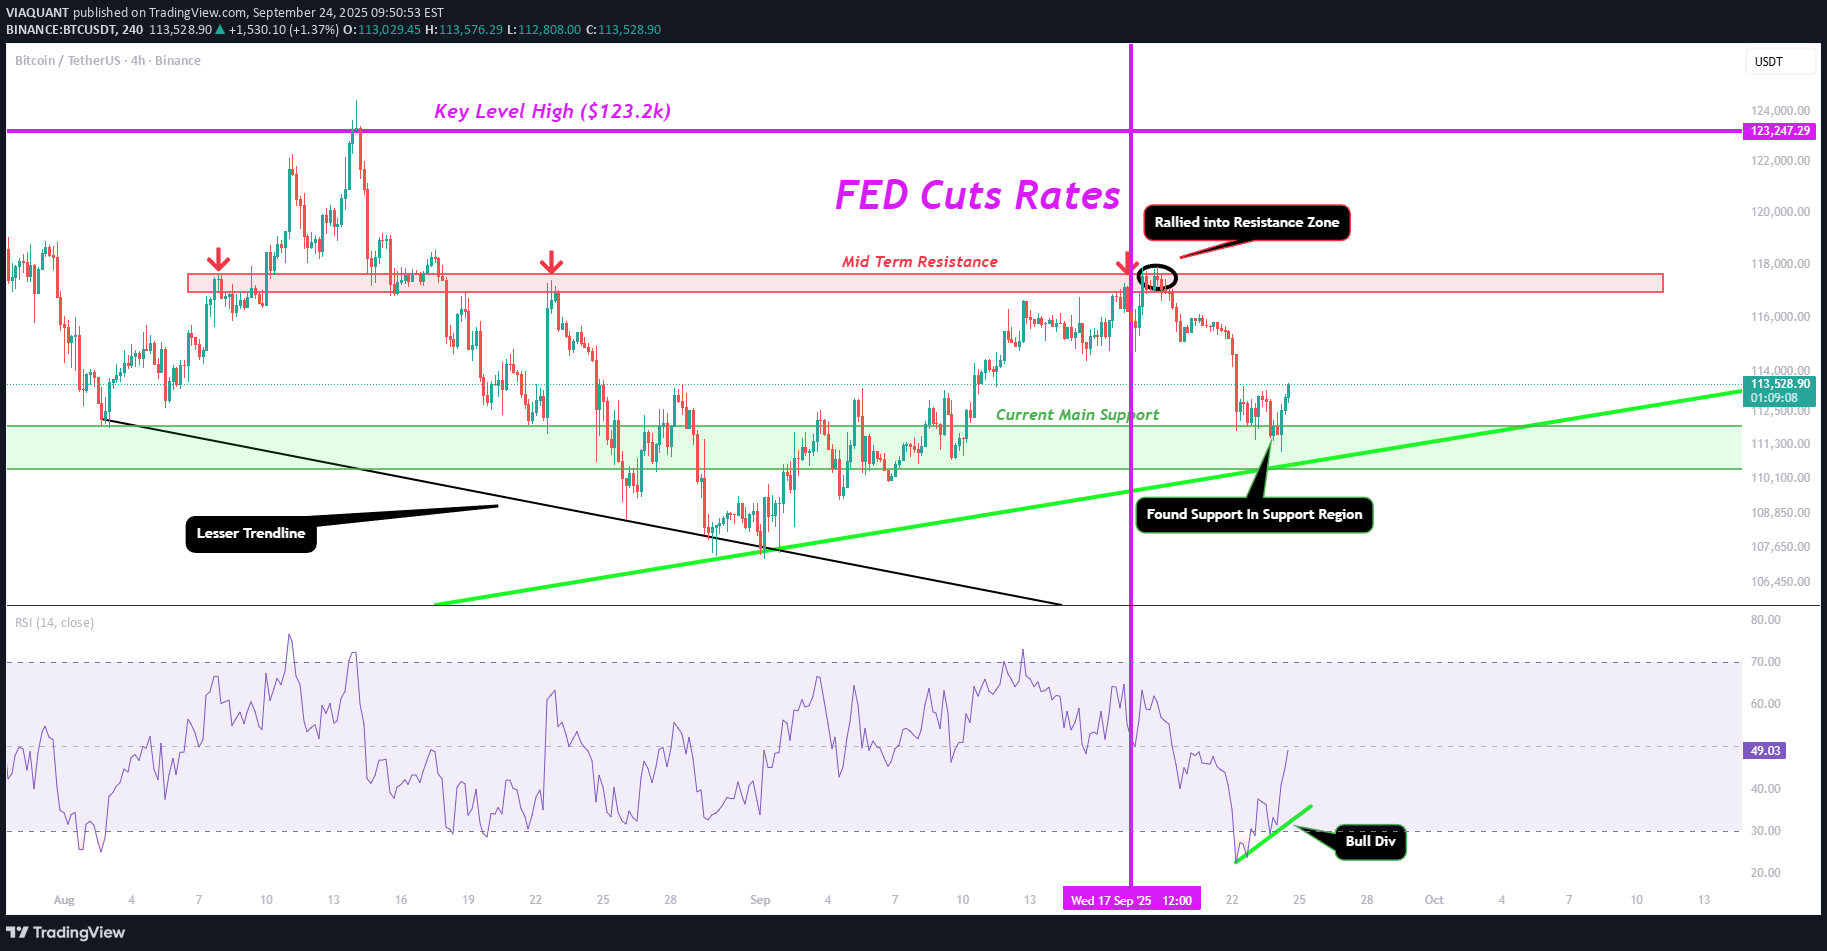
It has been a week since we saw the fed cut rates. Now it is time to reexamine price action compared to our pre-rate cut chart. That post can be found here: After the rate cut (Vertical Purple Line), we saw price dump sharply while Powell was speaking. Once he stopped, BTC rallied all the way to our red box (mid term resistance). As expected, price then started to sell off from that level of resistance. The buyers started to regain control of price action in our green box (current main support). As expected we saw many wicks into this box that were quickly eaten up by buyers. Currently, we are trying to see a break above our micro resistance level of $113.5k. If this level can be broken, the upwards momentum should continue. However, We do not want to see BTC start closing 4H candles below our green trendline (Support Trendline). That would indicate this support we are building will be negated and further downside price action will ensure. But based on the current technicals, BTC looks primed for a move back to the upside.
VIAQUANT
Just wanted to outline the chart as it sits before rate cuts. Once the market makes the move off the announcement we will reanalyze and make a follow up post on what could be next.
VIAQUANT
Just wanted to outline the chart as it sits before rate cuts. Once the market makes the move off the announcement we will reanalyze and make a follow up post on what could be next.
VIAQUANT
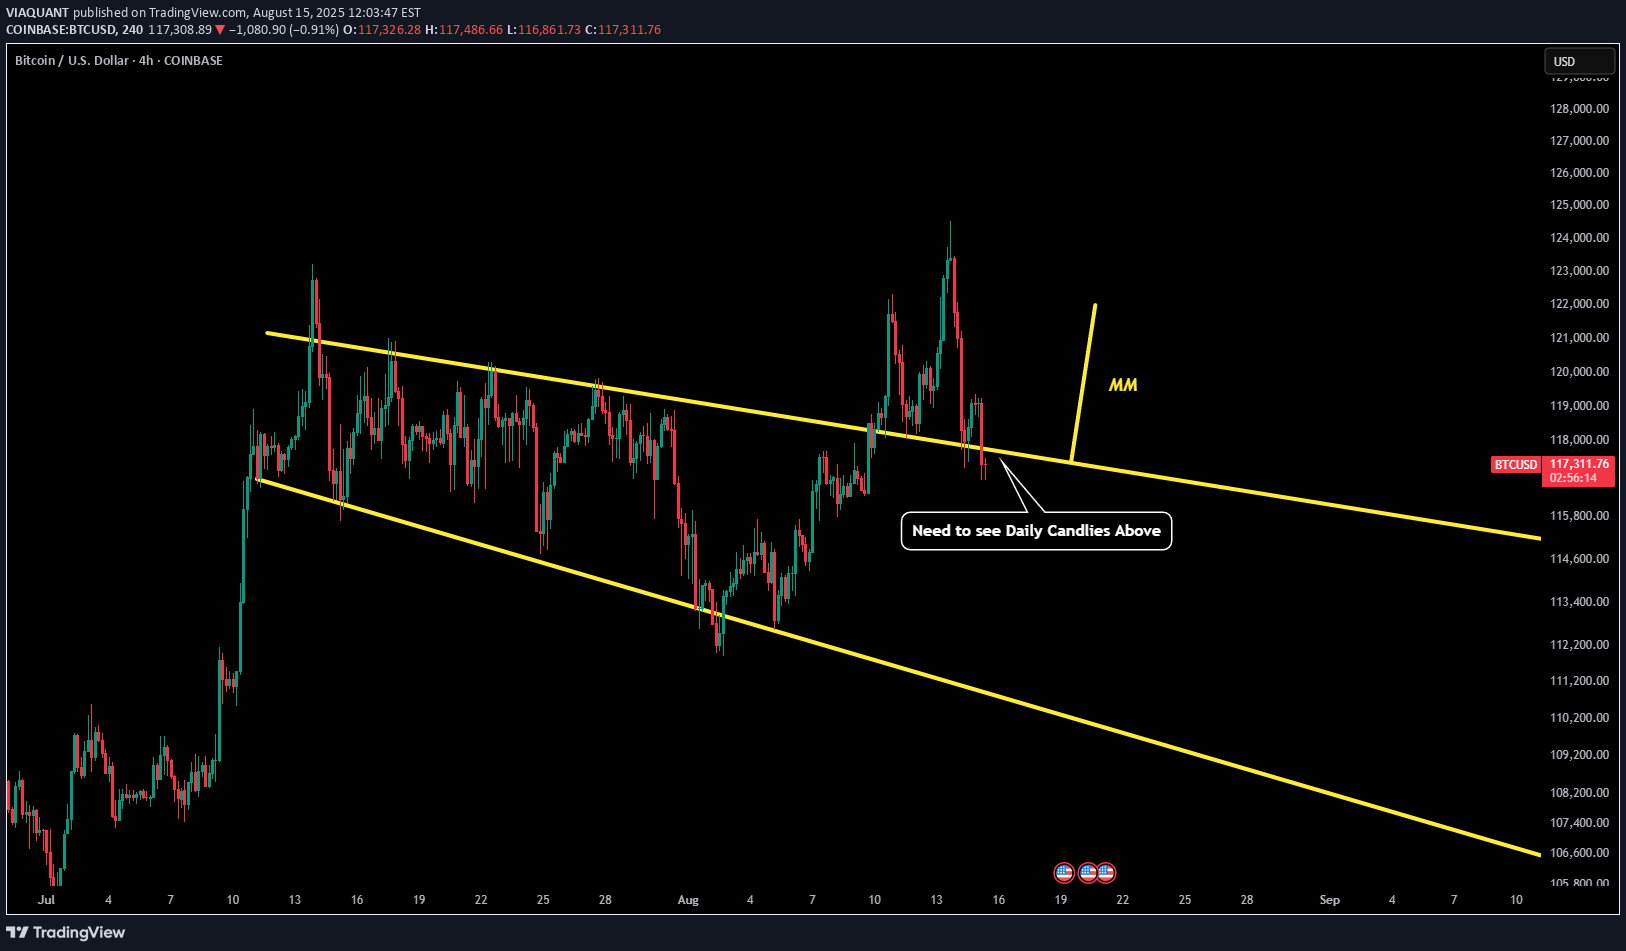
I made a post laying out the bearish scenario which seems to be more likely at this point, but given the current market structure there is also a bullish scenario and I want to lay that out right now. So in this chart we have two yellow lines. The main Line you want to pay attention to is the top one. This is the 4H timeframe so you can see all the touchpoints, but the confirmations will come on the daily. This could be considered some sort of triangular breakout pattern + retest if BTC can continue to hold the yellow line on the daily as support. If that is the case we have a MM (measured move) of $122k. If the breakout can continue and pus us to ATH then $130k as our 1.618 would be the next target. The final target above in the short term would be $134.4k-135.6k. Watch those levels as another potential high in the future.
Disclaimer
Any content and materials included in Sahmeto's website and official communication channels are a compilation of personal opinions and analyses and are not binding. They do not constitute any recommendation for buying, selling, entering or exiting the stock market and cryptocurrency market. Also, all news and analyses included in the website and channels are merely republished information from official and unofficial domestic and foreign sources, and it is obvious that users of the said content are responsible for following up and ensuring the authenticity and accuracy of the materials. Therefore, while disclaiming responsibility, it is declared that the responsibility for any decision-making, action, and potential profit and loss in the capital market and cryptocurrency market lies with the trader.