
TradingNomadic
@t_TradingNomadic

What symbols does the trader recommend buying?
Purchase History
پیام های تریدر
Filter
TradingNomadic
شبیه سازی سقوط FTX: بیت کوین به کجا میرود؟ (الگوی تجمعی صعودی جدید)
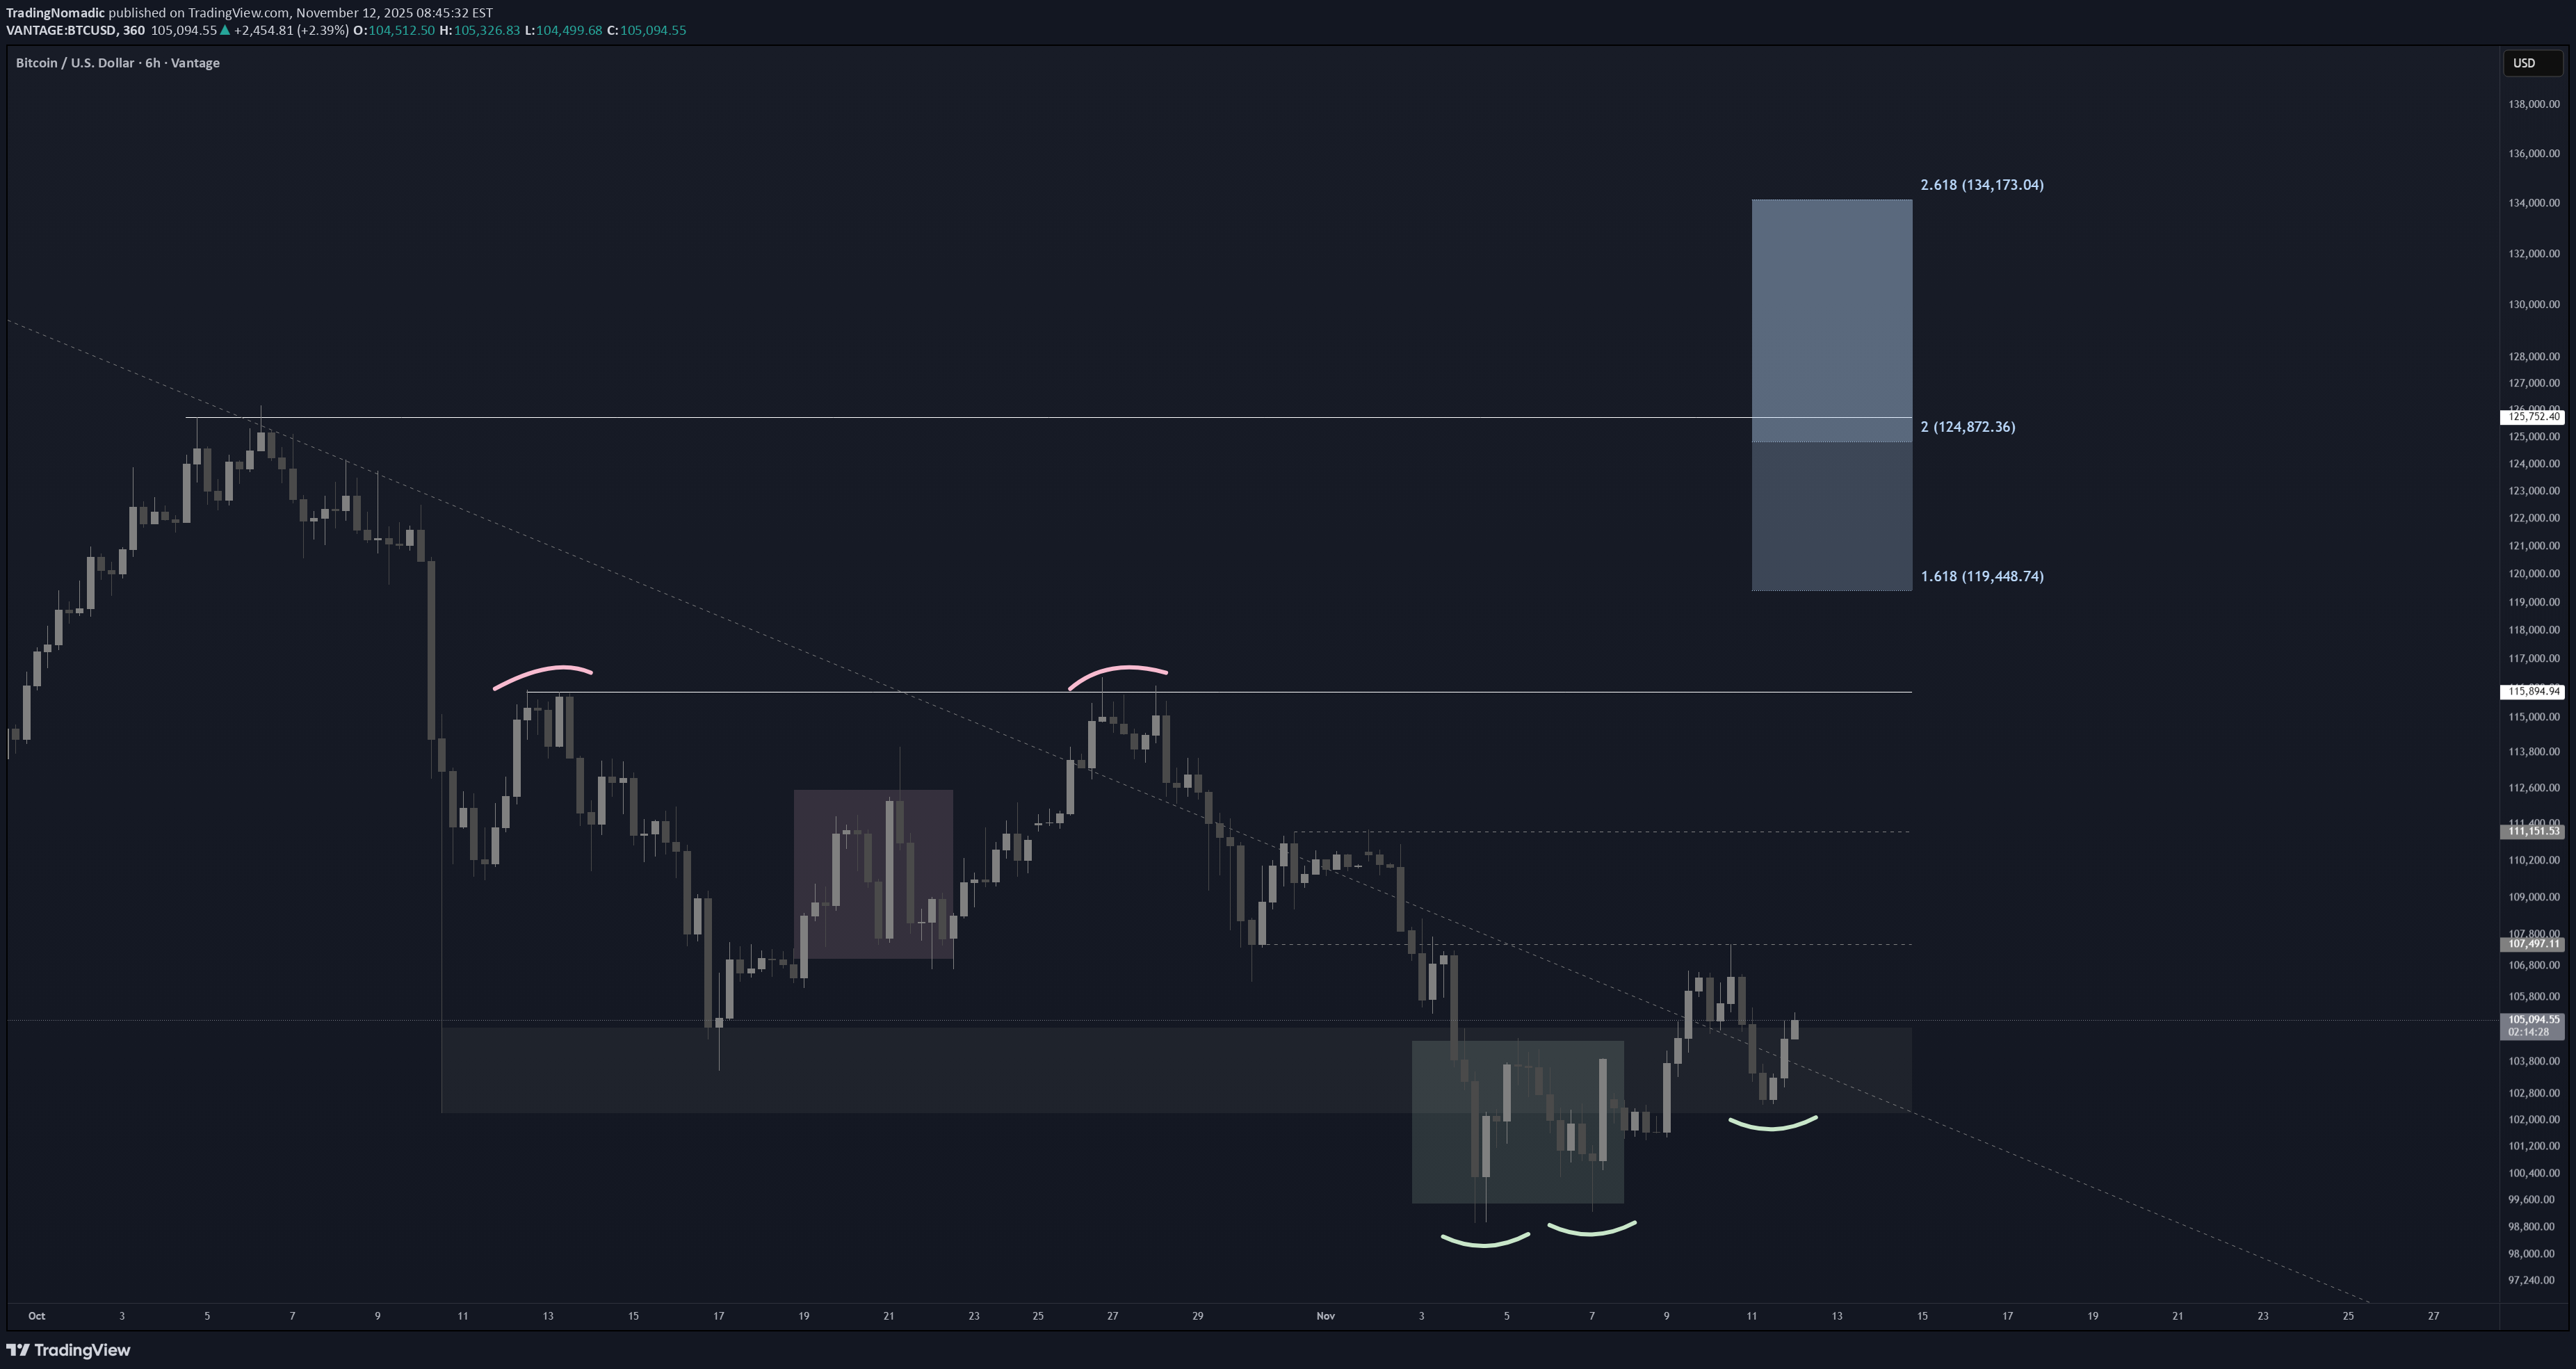
Just going to leave this here to follow along. If this was the same style reaccumulation, and reversal we saw back then, the next step would be a move higher into the range, and last point of supply, before the sign of strength move which would bring us back to the top of the range. Granted, this is at elevated prices, rather than after a major bear market, but the capitulation on Oct 11th actually far exceeded the liquidation event when FTX collapsed. Not trying to be a predictor, or hero here, but this is worth bringing up. This is inline with a few of our schematics from our channel, and we have alternative plans for downside if this failed. Give the bull case some credit until proven otherwise in a Macro uptrend.
TradingNomadic
CKB (Nervos Network): تحلیل هیجانانگیز نمودار؛ آیا منتظر رشد 100 درصدی هستیم؟
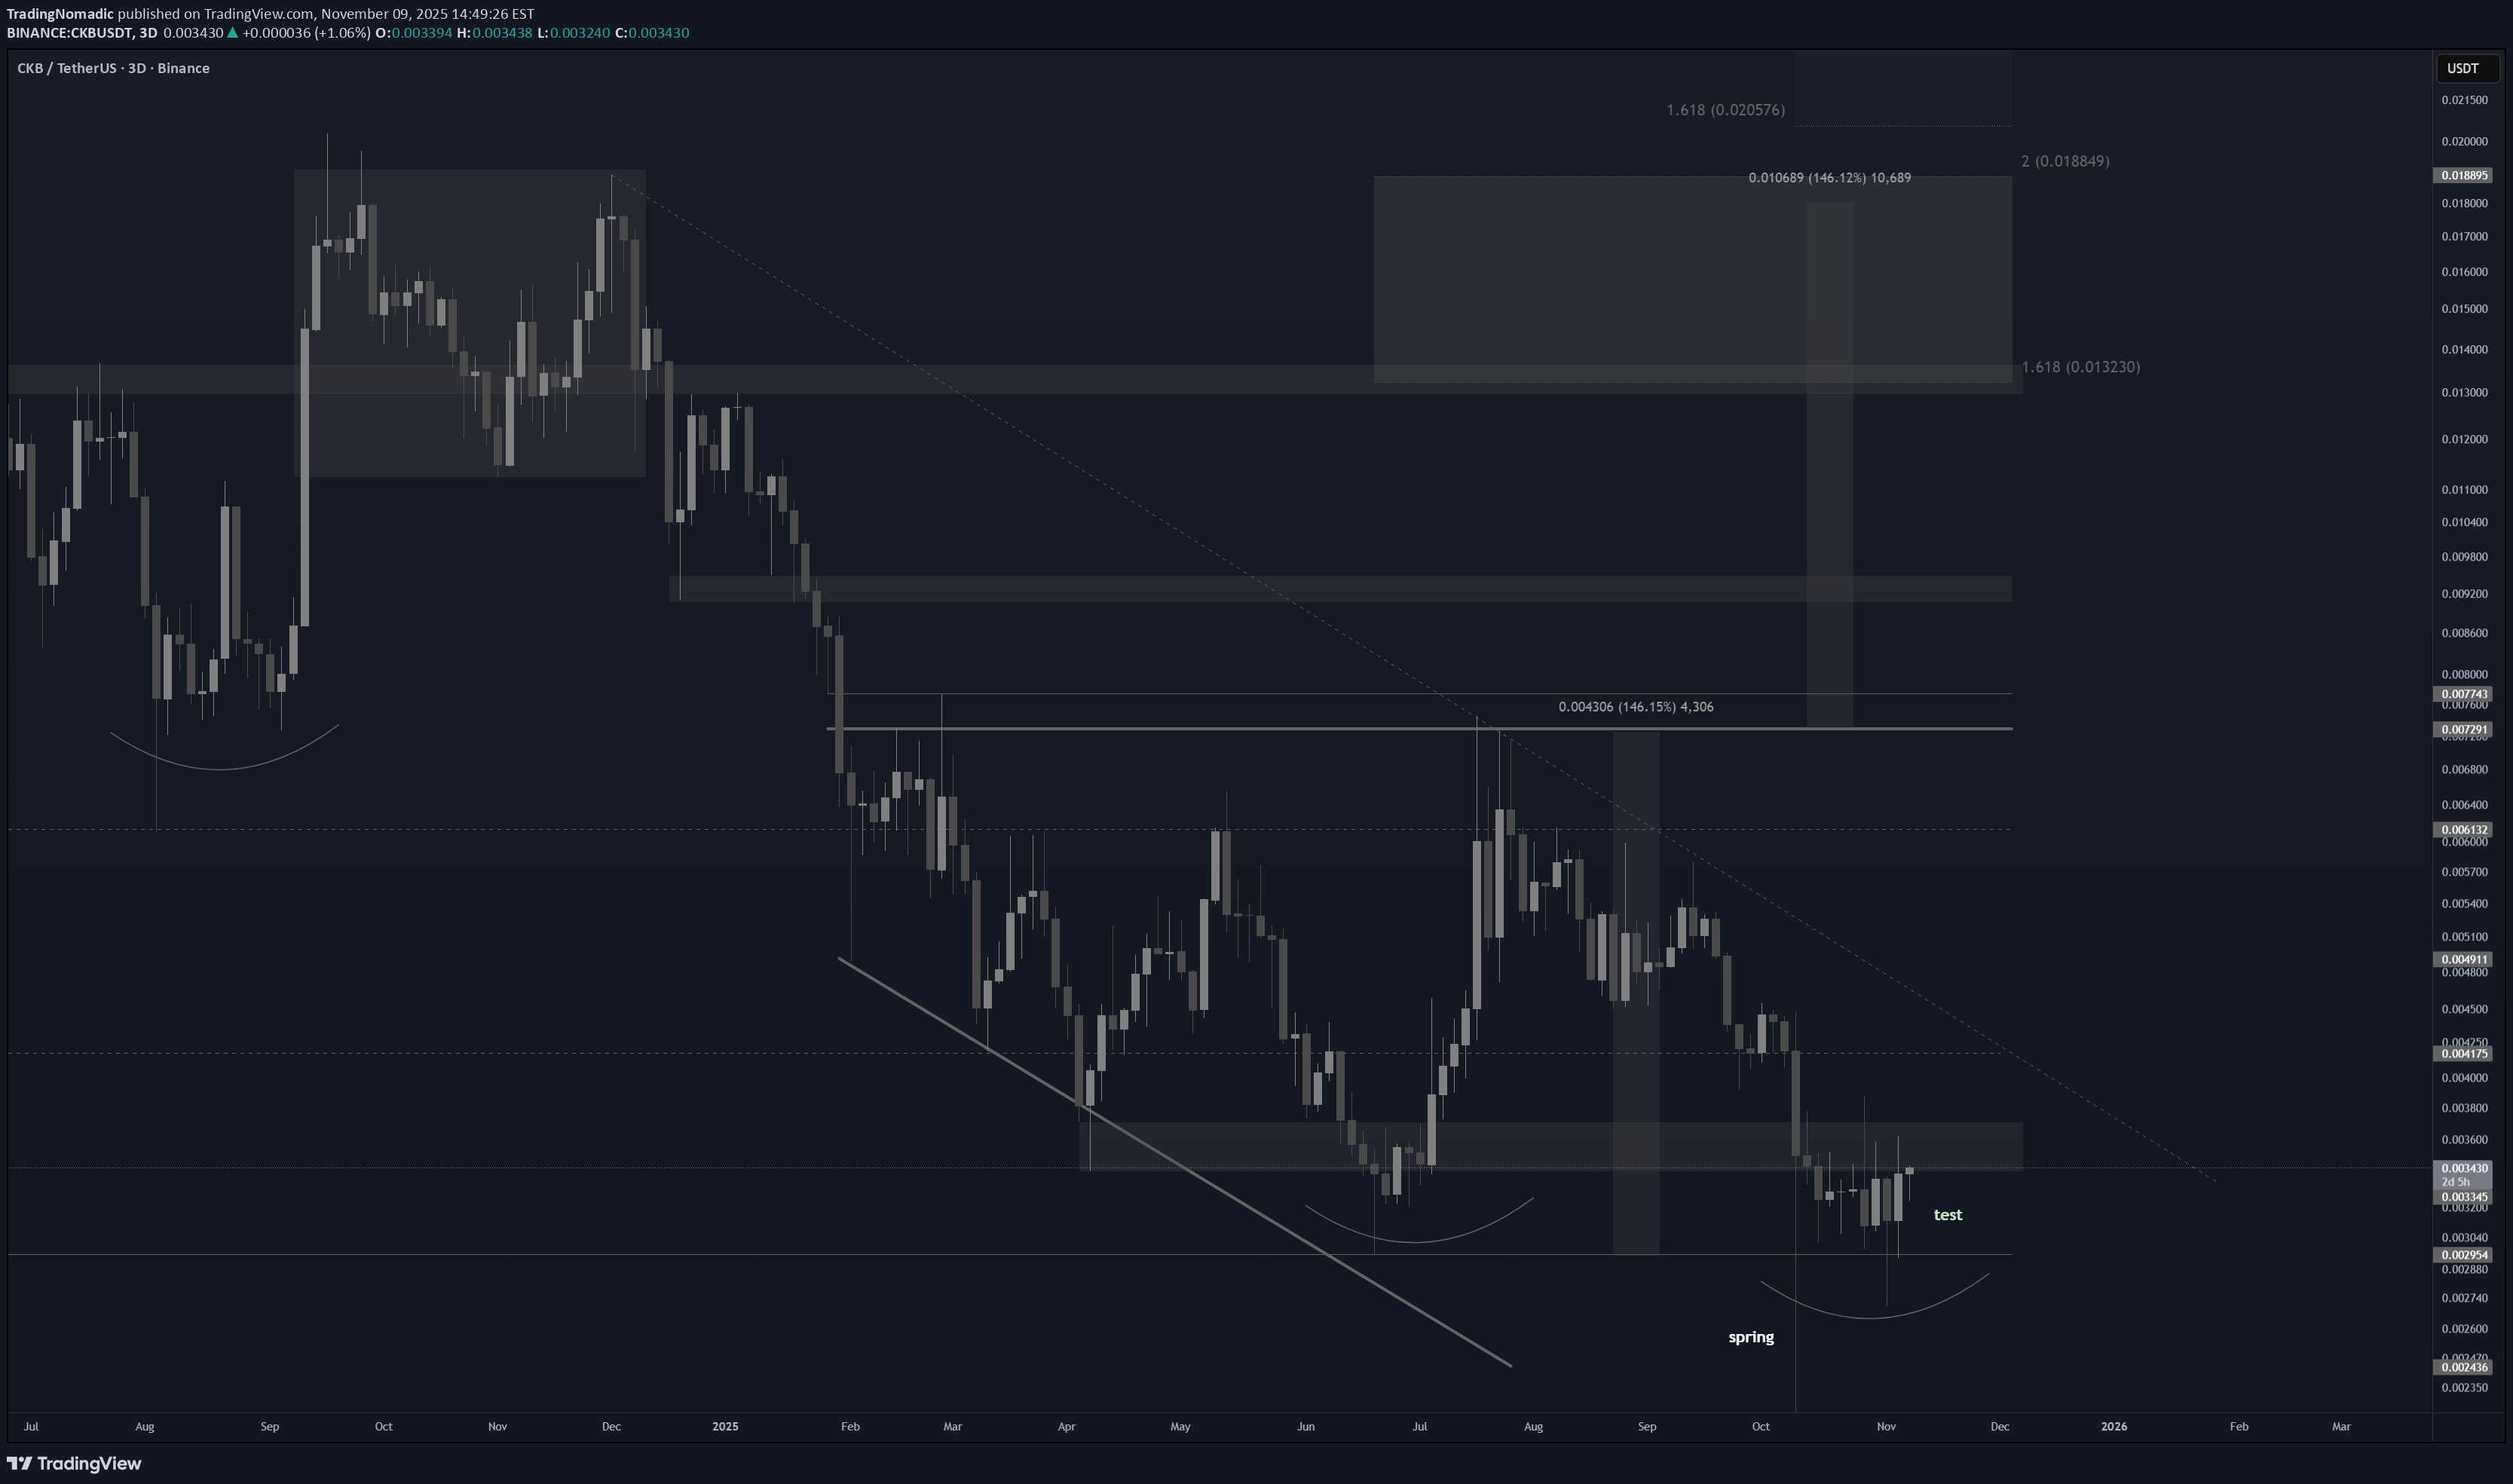
Real nice Bullish Dragon here with a Right angled and descending broadening formation as a base. Pattern target would be a 100% measured move of the range
TradingNomadic
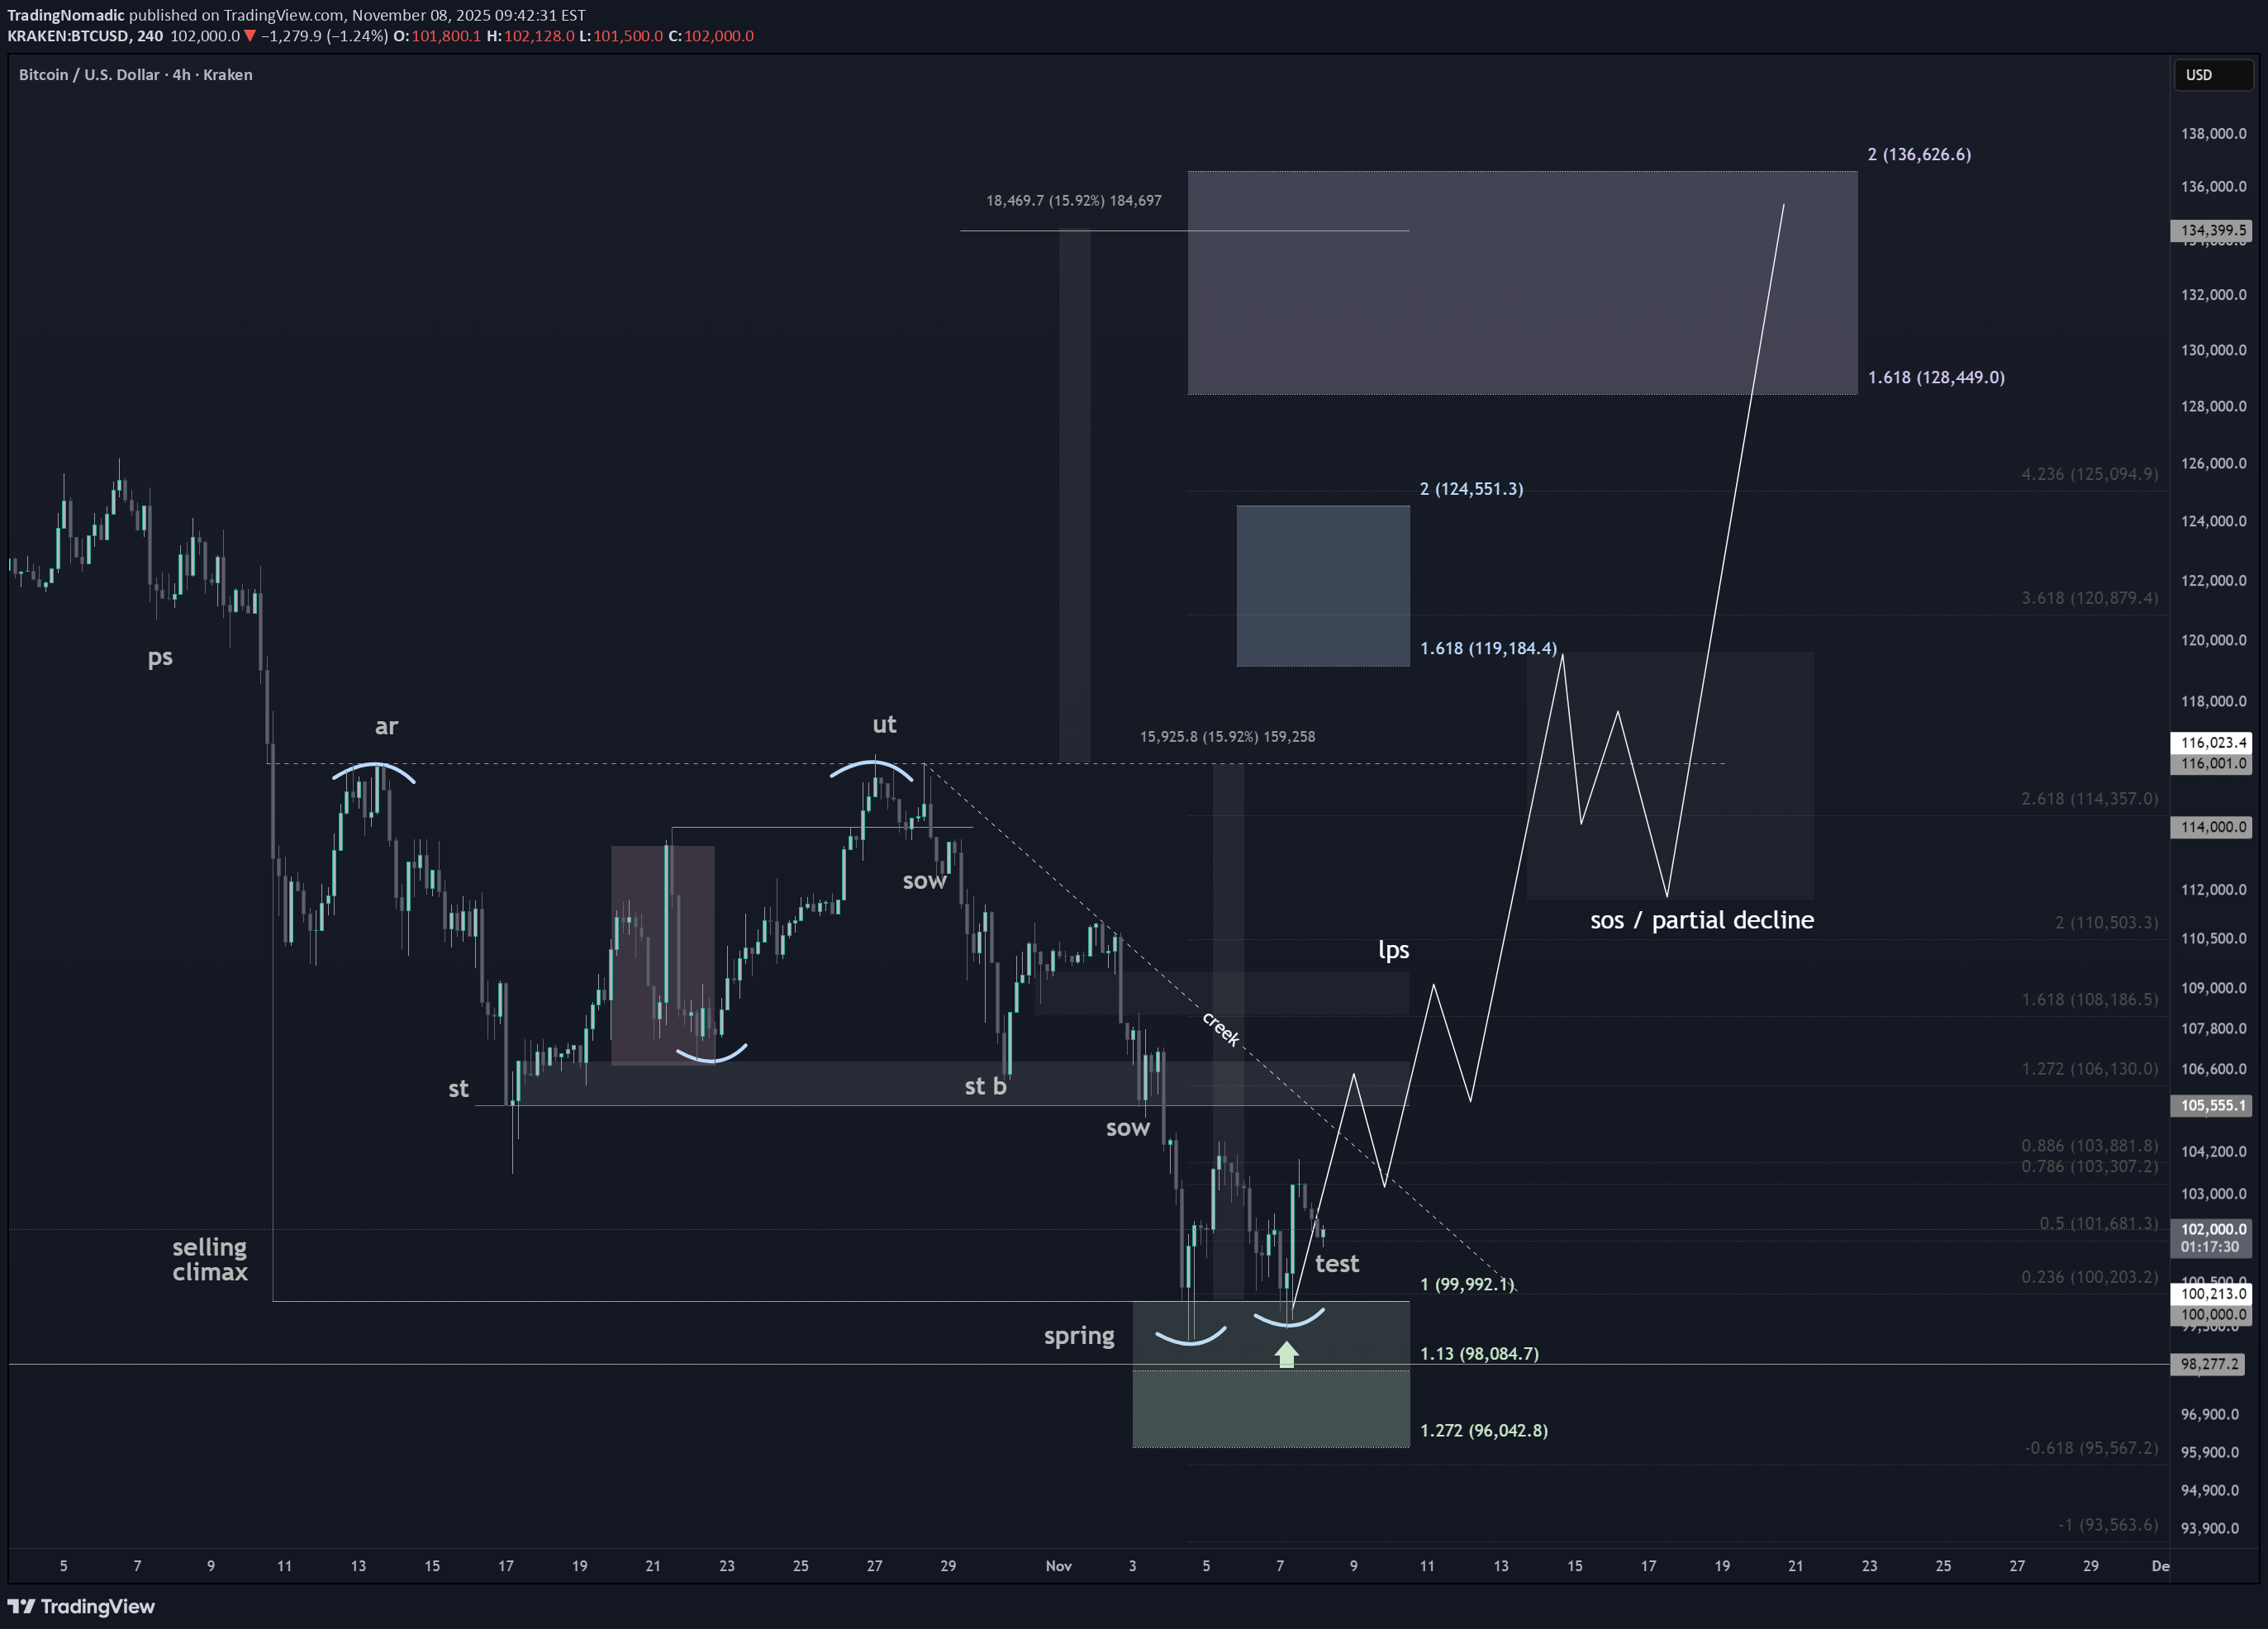
بیت کوین در مسیر صعودی جدید؟ تحلیل وایگوف برای کفسازی و جهش قیمتی
TradingNomadic
XRP - Weekly Checkback / 3 bar play

So long as this low holds up on XRP, id call this a major checkback here, above the old 2021 highs. Alongside a lot of other alt coins, XRP also has a real nice 3 bar play. a 3 candle stick pattern that implies bullish continuation, especially in the context of a major weekly checkback. This is powerful on a macro time scale. In the same respect, it would be a major red flag if that low is lost. It isnt a death sentence, but it does change the story. This is an open trade ive previously posted here, but if i were looking to add to a position, or open a new long, i would use that red flag as stop loss and reassess.
TradingNomadic
ETH / USDT supporting chart for the BTC pair

Now this isnt meant to be a prediction of any kind, rather a supporting chart to the BTC pair i posted already. This is typically how these bottoms would unfold in the case of a broadening bottom, or inverted head and shoulders. Looking for support above 1754, to reclaim this range, however it doesnt have to come back that far, and i wouldnt want to see it fall back into that deviation zone under1685. The idea being, the breakdown lower got rejected, and traders are looking for confirmation of support, back inside of the range. If thats achieved, we're going to look for the range high, and the partial decline typically, which is your last sign of strength before the mark up phase. None of this HAS to happen, just merely larping what ive seen in previous bottoms, including BTCs bear. If we see a change in character here, or a partial rise, with the inability to retest the range high / neckline, then of course, i will restrategize.
TradingNomadic
$ADA Cardano 3 rising valleys / 3 bar play!

Real nice look here for Cardano, with the 3rd rising valley, and now the 3 bar play, a 3 candle pattern suggesting of bullish continuation. Given this is the weekly chart, i would put a lot of weight into this and cautiously say, this is where we finally get a real move here. Daily momentum continues rising with volatility, which is a characteristic of a strong bullish trend underway. Simultaneously, the daily ADX has begun to rise once again from under the newly Bullish DX cloud. This is the earliest signal that a new bullish trend is technically underway. If the 3 bar play fails, or fails to close with this weeks candle body engulfing last weeks, id consider that a subtle red flag. Price should not make a new low under this pattern from here on out.
TradingNomadic
LRC - Loopring Weekly support holding

Critical area here for loopring as we test the support low from summer 2021. Real clear correlation between here at .88, and that would be the expectation if we continue to hold this low. We broke out of the initial supply line coming down, but the secondary one is also being respected as resistance for now, so that would be a sign of strength, should we break above it. Daily momentum is turning up from oversold and continues rising above .184 and could exhaust as high as .59 cents. Targets would start around 50 cents at the top of the range, and into extension levels, 88, 160, and potentially as high as the measured move / 2.0
TradingNomadic
$LTC Litecoin Weekly partial decline confirmed

Litecoin testing the highs of the range again here after a partial decline. Targets higher would start at the local 1.618 at 219, with resistance at 273, but the measured move would imply a 100% extension which would take up into about 328. If we were to make new highs here i think youll be looking at 500-700 pretty quick with the 1.618 extension reaching as high as 1500. I would not be surprised to see LTC included in the American strategic reserve, or ETF's proposed to drive price in this fashion. Youve also got the Proof of Work aspect and its relationship with Doge as a script mineable coin, and the derivatives/futures/Grayscale. Like XRP and some older coins we've been trading, i think LTC will have its day this cycle, and theres a lot of potential antagonists thatll be ready to explain where the price action came from, but thats typically after the real opportunity has passed.
TradingNomadic
CFX Double bottom / 3 rising valleys

Looking for a move above the local 618 for confirmation, but the first target would be the top of the range for the Sign of strength. Typically youll see a partial decline of sorts, which would then statistically favor a breakout into extension targets at the 1.618, and the measured move a bit higher. With daily and 3 day volatility still contracting, it could take a little time but momentum has shifted upwards, and bias remains higher without a new low.
TradingNomadic
$SYN - Sign of strength in progress

Seems to be the sign of strength move here on SYN , with a measured move from the ascending triangle on our daily, that would take you into the top of the range. Typically this is where you would expect a partial decline / consolidation while supply is absorbed. Assuming this is correctly identified, you would expect a second test of the range high which confirms the partial decline, and statistically favors a breakout there after. You would expect to see rising volume and strength into the second test, and escape velocity taking you into extension levels. The measured move finds confluence with the 1.618, and could very well be where we end up in time here.
Disclaimer
Any content and materials included in Sahmeto's website and official communication channels are a compilation of personal opinions and analyses and are not binding. They do not constitute any recommendation for buying, selling, entering or exiting the stock market and cryptocurrency market. Also, all news and analyses included in the website and channels are merely republished information from official and unofficial domestic and foreign sources, and it is obvious that users of the said content are responsible for following up and ensuring the authenticity and accuracy of the materials. Therefore, while disclaiming responsibility, it is declared that the responsibility for any decision-making, action, and potential profit and loss in the capital market and cryptocurrency market lies with the trader.