Trading1to100
@t_Trading1to100
What symbols does the trader recommend buying?
Purchase History
پیام های تریدر
Filter
Signal Type

Trading1to100

GOLD is consolidating and is within Support zone of 1940-1910, todays low at 1933 which is at 38% of the 1811-2009 move and roughly 75pts move, can GOLD continue lower possible or does it consolidate. Gold can consolidate and upside resistance = 1955-1968. break above these levels then 1975-1990 next resistance levels. Continuation from 1930's Lower then expect 1910-1900 & 1885-1855 as next support levels. Downside should hold 1910-1900 as support. Is gold consolidating the whole move from 1811-2009?? if so then 2009-1933 could be the 1st phase down(wave ,move , etc or call it whatever you like) then another consolidation from 1933-??= possibly upto 1985 then another phase lower to 1910-1900 or lower to 1885-1855. Alternate Scenario would be that 1811-2009= 1, 2009-1933=2 then market turns around and continues higher 1933-?= 3 (2010-2040 or higher). Have a great weekend.Gold continue higher from 1933-1975, 1975-1956, 1956-1993. AB=CD, price within 1985. 2 waves complete from 1933 and roughly about 40pts each but 60pts overall. FROM 2004-1933-1975-1956-1993= XABCD, if this is complete then expect 1963 support, break below 1963=1946, break below 1946= 1933 and lower. Have a great weekendGold has been within my price zone got to 1966 then turned up to get to 2007 another 40pt move, let see what happens from these levels as it has started to consolidate again, will we get another 30pt consolidation? 2007-30= 1977 quite possible as price is at 1990, my price range= 1978-1969. A little overview from 1933-32 price level: 1933-1975(40pts+/-), 1975-1956(20pt+/-), 1956-1993(40pt+/-),1993-1966(30pts+/-), 1966-2007(40pts)= 5 waves but they have overlapped too. 1933-1993= abc 1993-1966=abc(x)1966-2007=abc... on a roll here but wait 1993-1966 was the largest consolidation therefore 1966-2007=a, 2007-?=b (1978-1969) then one more wave higher 1970?-2010?= c???. Should there be a bigger consolidation a break below 1966-1963 then price could go as low as 1956-1947 or even lower to 1933 and beyond.

Trading1to100

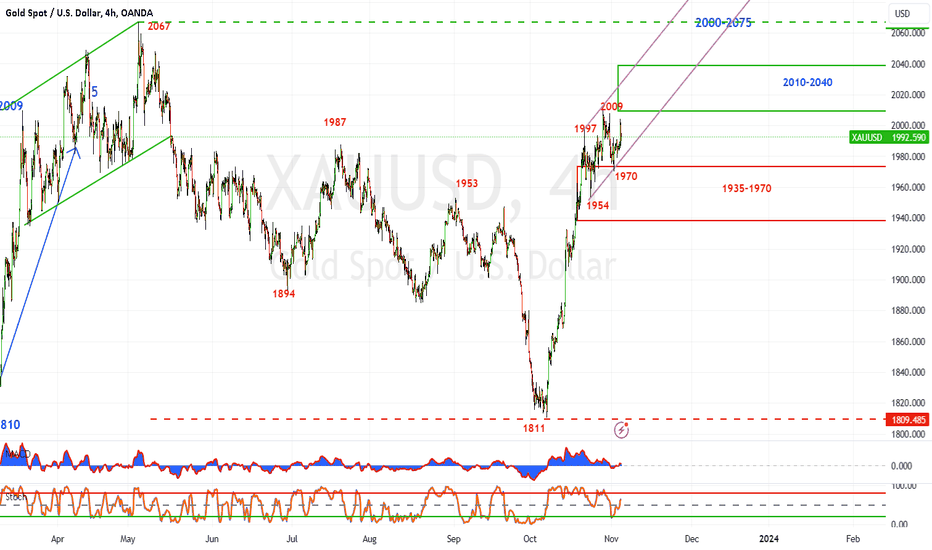
Gold price target was 2010-2035 a few weeks ago and was just shy at 2009 then tested 2004 and slowly faded away, Friday closed at 1992 and continued lower to 1957. 1970-1950 = support zone, price is here already, potential to consolidate here then continue lower to next support zone 1940-1910. Upside resistance= 1975-1982 consolidation. Should price continue below 1956-1950 then 1940-1910 next price support. Break out above 1975-1982 then expect 1995-2009 or higher to 2030-2040 and beyond.

Trading1to100

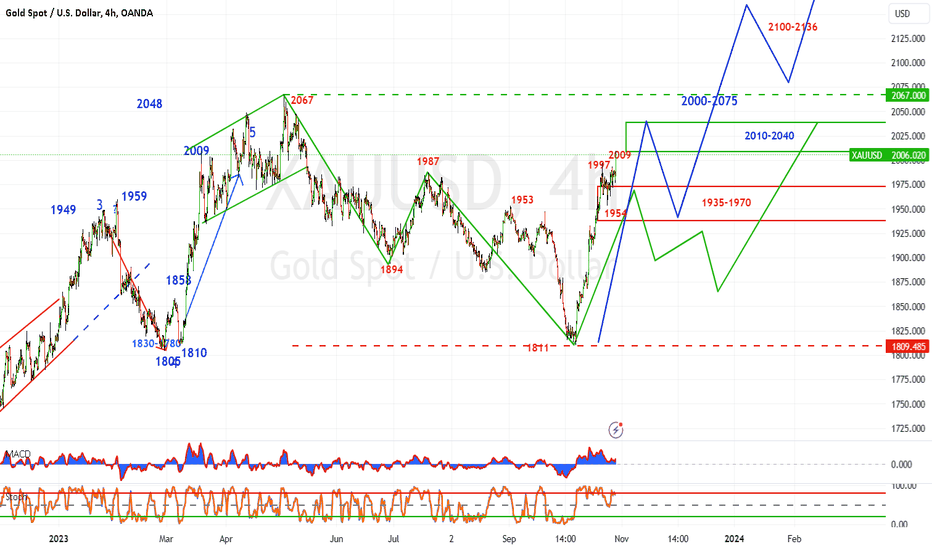
Gold has had an impressive rally from 1811 to 2009, what happens from here... Well it's at a crucial level break out or breakdown!!!. 1811-1997= 186pts, 1997-1954=43pts, 1954-2009=55pts, 2009-1970=39pts, 1970-2004=34 pts (intraday high Friday), 1992(closing price). Looking at how price is setting up there here from 1997 its overlapping and so far there is 1 move higher 1954-2009 then it consolidated down to 1970 and back to 2004. 1954-2009=AB 2009-1970=BC CD=1970+55(100%)=2025,1970+62(113%)=2032!!,1970+70(127%)=2040!!, 1970+89(162%)=2059!!! 1987-1811= 2010(113%),2035(127%),2097(162%) 2067-1811= 2012(78% Cypher),2037(88%), 2100(113%) Upside resistance= 2010-2032 then 2040-2070, break out above 2040-2070 then 2100 and higher. If 2010-2040 is the upside resistance and prices consolidate then down side support= 1970-1950, 1940-1910. Break below 1950 then potential for retest of 1800's or break even lower.

Trading1to100

Gold has been on a relentless run to the upside from 1811, it has gone up nearly vertically to todays high 2009(200pts+/-), still room for more upside? I don't know. Previous post my estimation was 2010-2040 zone for a cypher pattern and we are here now 200pts later(2009). prices could still continue higher Tag n turn (2010-2040), therefore caution would be good now. Should price continue higher above 2040 then upside resistance = 2060-2075 and break out above here will target 2100-2136, 2195-2225 & 2265-2325. However, note that if prices consolidate from these levels 2010-2040 then downside support = 1970-1935, break below then 1900-1875 before continuation of the move higher from either of these levels. Have a great weekend.

Trading1to100

SUB 2000's in sight now for gold, the rally has been relentless for now consolidations have been 20+ pts then higher. Since the last post my price range was 1935-1970 and currently at 1977, caution would be warranted at these levels, upside resistance 1970-1990 targeting 2010-2040. 1. From last post cypher in progress price target 2010-2040 price zone still in play, Once price objective is complete there will be a consolidation of about 65-110pts (+/-10pts) 1940-1910. 2. Once the consolidation takes place the between 1940-1910 the price should retest the 2040-2060 targeting 2100-2135. 3. Break out above 2060-2075 then upside price target= 2100-2135, 2195-2225 & 2265-2325. 4. 1615-2067=450pt(+/-), 2067-1810=250pt(+/-), 1810+450pt= 2260 100% 5.Near term price objective will be fulfilled could at current level 1970s or higher then a Price consolidation at 1940-1910 will be ideal however if price cannot be supported at 1940-1910 then lower price target at 1865-1840,price break at this point will target 1810-1800 and lower. GREEN line depict current scenario where price objective completion at 2010-2040 then lower to 1940-1910 or lower to below 1865-1840 etc. Blue line depicts likely upside move once price objective completion at 2010-2040 or from current levels price consolidation between 1940-1910 needs to provide support then next move higher will target 2060-2075 break out above then next price target= 2100-2135, 2195-2225 & 2265-2325.

Trading1to100

Since my last post gold was at 1860 and today its at 1930 (give or take) coming to my resistance zone of 1935-1970. So far so good 1811-1930 (120pts) could still go higher. Caution required here, should price not consolidate around current levels and continue higher then expect 1975-2005. Once price gets to 1935-1970 or the higher levels 1975-2005 then consolidation expected: 1. consolidation from 1930-1970 then possibly down to 1890-1840 2. consolidation from 1975-2005 then probable support down to 1920-1895. Chart analysis: 2067-1894-1987-1811 then to 2010-2040= CYPHER currently in progress. 1987-1885-1953-1811 then to 1950-1968= CYPHER currently in progress. Break below 1890-1840 support zone then expect lower prices all the way to 1825-1760-1725-1665. prices could fall below these levels too. Trade what you see, expect the unexpected, be patient & do your own analysis and what works for me will not work for somebody else.

Trading1to100

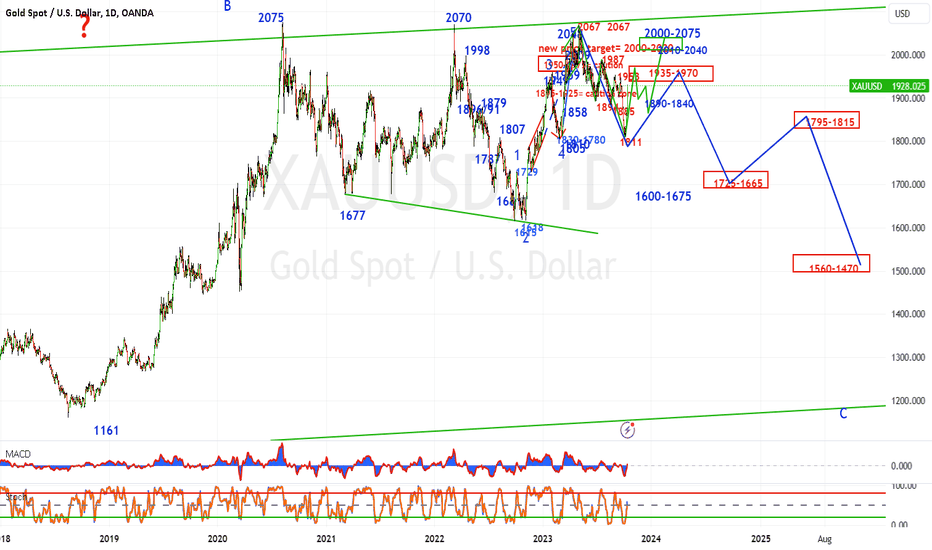
Gold has made a high at 2067 then started it next leg down and got to 1811. Bad news over the weekend and Gold starts it move higher again, caution required here, downtrend is still intact and this could well be a consolidation within the larger trend lower, upside resistance levels- 1935-1970 or even higher upto about 2000(round number). Break above 2065 then expect 2160-2235 upside resistance or higher. How Gold sets up is key for the upside and downside. Gold is still range bound between 1600-2075. Downside price support = 1725-1665, break below here then expected support at 1620-1600. Setup is important as Gold could have another consolidation from 1725-1665 back up to 1795-1815 then another move lower to 1620-1600...Break below 1620-1600 then expect 1560-1470.

Trading1to100

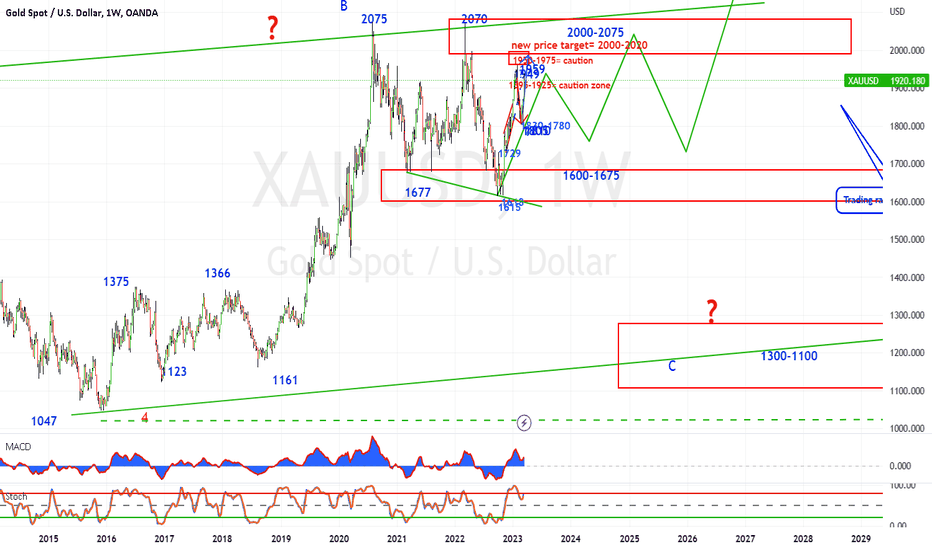
Let take a look from the last post Feb 3rd, gold did get to expected price target 1830-1780 completed at 1805-1810 and then has had this move to the upside to 1937, can it go higher probably and how high. Short term 1hr/4hr time frame: From 1805= 1805-1858=1, 1858-1810=2,1810-1937=3? or still subdividing higher and it could exceed 1959, alternate is it could consolidate for a 4th wave to 1900-1890 price zone then 5th wave higher to 2000-2020. Daily & Weekly time frame: Once the upside gets to 1959 then caution is warranted as it could stall the upside for a double top or extend to 2000-2020. At this price point it is very interesting as gold can have a bull run above 2070 a triple top or break down. Triple top then price could drop down to 1600’s or lower!!! Down side expect these Support zones: 1st support zone 1800-1780, break below here then 2nd support zone 1750-1720-1680. Below 1680 then 3rd support zone 1620-1600. there will be price consolidation on the way down. Break out above 2070: 1st Resistance zone 2130-2195, 2nd Resistance zone 2240-2360 See charts below with optional scenarios where: OPTION 1 2075-1677=A, 1677-2070=B, 2070-1615=C, 1615-??=D (2000-2020 OR 2070!!!) THEN E TO FOLLOW TO 1600'S OR LOWER OPTION 2 2075-1677=A,1677-2070=B,2070-1615=C AND NOW IN UPSIDE WHERE 1615-1728=1, 1728-1618=2,1618-1959=3,1959-1805=4,1805-??=5(2000-2020 OR 2070!!) THEN a CORRECTION OF ABOUT 50%-65% ABOUT 1850-1750.

Trading1to100

Since my last post it has been 3 weeks for gold to get to 1950-1975 zone and topped out at 1959 then took a plunge to the downside currently at 1865. See the dotted blue line(extension) on the chart at 1860 support or not that’s the golden question, its also 97pts(100pts+/-) from 1959-1862 in 2 days possible consolidation at this zone 1900-1880-1860. Break below 1860 then 1840-1825 as next support zone break below 1830 next support zone= 1800-1780. This analysis is based on daily and weekly timeframe. 1615 to 1959= 334pts, So what price zone becomes support from 1959 for the upside to continue or what price zone does it need to invalidate for the downside to continue? Enjoy your weekend.

Trading1to100

Gold is still on track within the 1st price zone = 1895-1925, clearing 1925 then next price zone =1950-1975. Breakout from 1895-1925 & 1950-1975 new price zone gets activated at 1995-2020. Price could consolidate between 1900-1920 & continue higher to the next price zone 1995-2020. Trend is your friend for now & being cautious at this stage is vital. Have a great week trading. This is my View & not trading advice
Disclaimer
Any content and materials included in Sahmeto's website and official communication channels are a compilation of personal opinions and analyses and are not binding. They do not constitute any recommendation for buying, selling, entering or exiting the stock market and cryptocurrency market. Also, all news and analyses included in the website and channels are merely republished information from official and unofficial domestic and foreign sources, and it is obvious that users of the said content are responsible for following up and ensuring the authenticity and accuracy of the materials. Therefore, while disclaiming responsibility, it is declared that the responsibility for any decision-making, action, and potential profit and loss in the capital market and cryptocurrency market lies with the trader.