Technical analysis by Trading1to100 about Symbol PAXG on 10/13/2023

Trading1to100
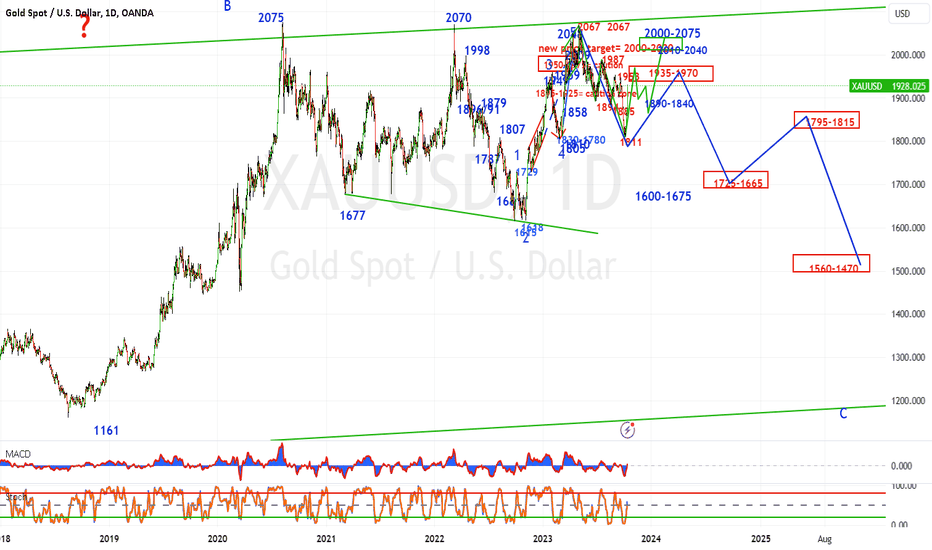
Since my last post gold was at 1860 and today its at 1930 (give or take) coming to my resistance zone of 1935-1970. So far so good 1811-1930 (120pts) could still go higher. Caution required here, should price not consolidate around current levels and continue higher then expect 1975-2005. Once price gets to 1935-1970 or the higher levels 1975-2005 then consolidation expected: 1. consolidation from 1930-1970 then possibly down to 1890-1840 2. consolidation from 1975-2005 then probable support down to 1920-1895. Chart analysis: 2067-1894-1987-1811 then to 2010-2040= CYPHER currently in progress. 1987-1885-1953-1811 then to 1950-1968= CYPHER currently in progress. Break below 1890-1840 support zone then expect lower prices all the way to 1825-1760-1725-1665. prices could fall below these levels too. Trade what you see, expect the unexpected, be patient & do your own analysis and what works for me will not work for somebody else.
