Technical analysis by Trading1to100 about Symbol PAXG on 11/5/2023

Trading1to100
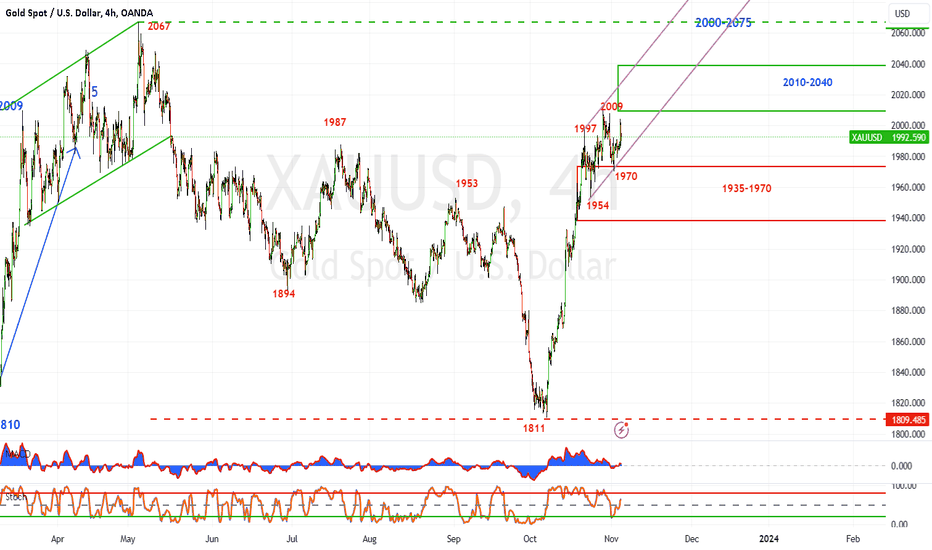
Gold has had an impressive rally from 1811 to 2009, what happens from here... Well it's at a crucial level break out or breakdown!!!. 1811-1997= 186pts, 1997-1954=43pts, 1954-2009=55pts, 2009-1970=39pts, 1970-2004=34 pts (intraday high Friday), 1992(closing price). Looking at how price is setting up there here from 1997 its overlapping and so far there is 1 move higher 1954-2009 then it consolidated down to 1970 and back to 2004. 1954-2009=AB 2009-1970=BC CD=1970+55(100%)=2025,1970+62(113%)=2032!!,1970+70(127%)=2040!!, 1970+89(162%)=2059!!! 1987-1811= 2010(113%),2035(127%),2097(162%) 2067-1811= 2012(78% Cypher),2037(88%), 2100(113%) Upside resistance= 2010-2032 then 2040-2070, break out above 2040-2070 then 2100 and higher. If 2010-2040 is the upside resistance and prices consolidate then down side support= 1970-1950, 1940-1910. Break below 1950 then potential for retest of 1800's or break even lower.
