
Traders-Lounge
@t_Traders-Lounge

What symbols does the trader recommend buying?
Purchase History
پیام های تریدر
Filter
Traders-Lounge
Solana Bullish scenario
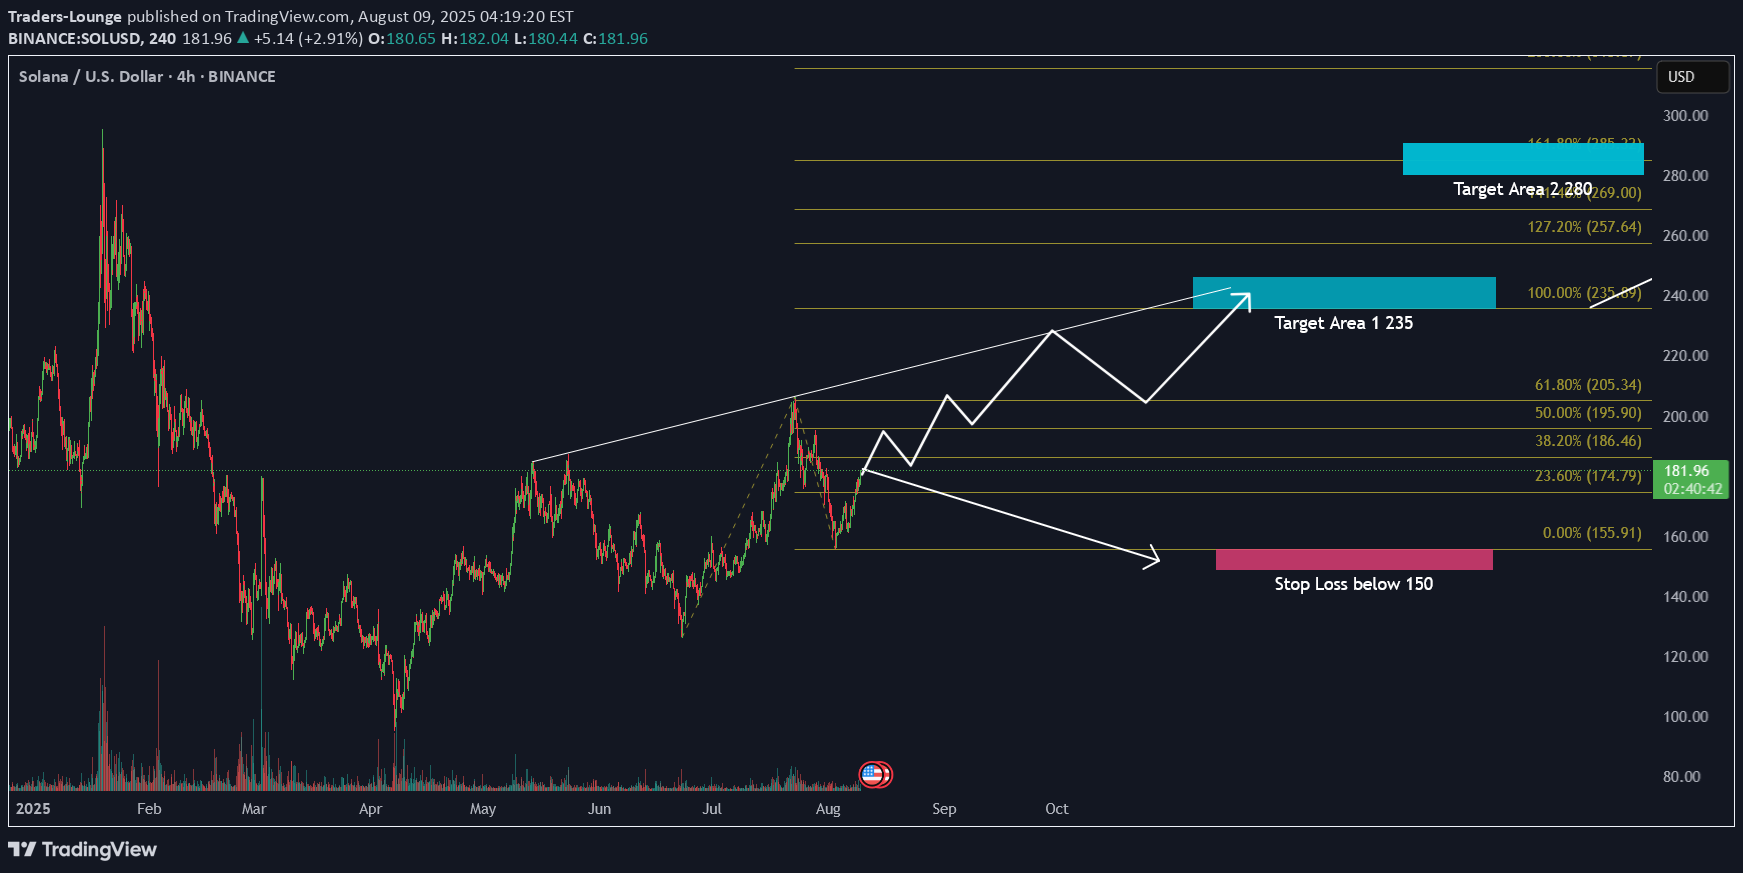
Current Price:181.37 Setup: SOL has bounced strongly from the 155 to 160 support zone and is now reclaiming key Fibonacci retracement levels. The structure suggests a potential bullish continuation if momentum sustains. Key Levels: Support: 174.79 (23.6% Fib), $155.91 (major support) Stop Loss: Below 150 to protect capital in case of breakdown Targets: Target Area 1: 235 (100% Fib Extension) Target Area 2: 280 (141.4% 161.8% Fib Extension zone) Bullish Case: If price maintains above 174 and breaks the 195 205 zone, it could trigger a strong rally towards 235 and potentially 280. Structure resembles a continuation move following the July rally. Bearish Risk: Failure to hold above 174 could lead to retests of 160, and a break below 150 would invalidate the bullish outlook. Outlook: Bias remains bullish as long as the 174 180 range holds. A breakout above 205 would confirm the next impulsive leg toward 235+. hashtag#SOL hashtag#Solana hashtag#AltSeason hashtag#Crypto hashtag#BTC hashtag#ETH hashtag#BullRun hashtag#Traderslounge
Traders-Lounge
Btc Bullish breakout
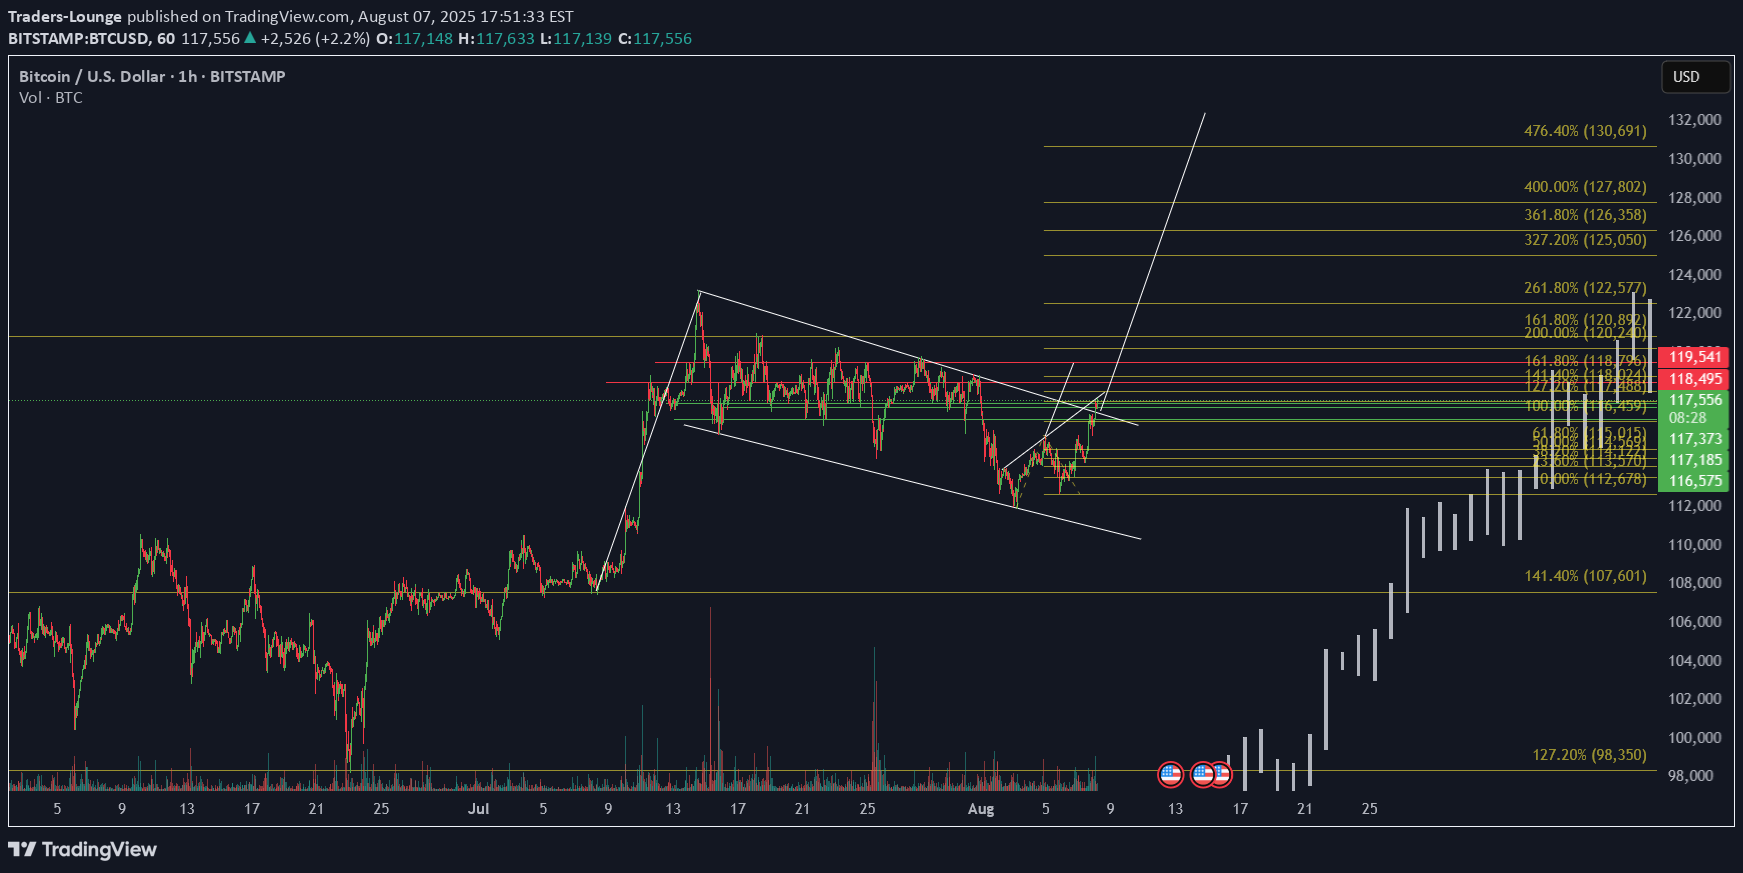
Technical Highlights: Pattern Breakout: BTC has broken out of a descending wedge, a bullish reversal pattern. Fibonacci Extensions: The price projection levels are drawn from the recent swing low to high: 1.618 (161.8%) 120,892 2.618 (261.8%) 122,577 3.618 (361.8%) 126,358 4.764 (476.4%) 130,691 = Target Area Volume: A noticeable volume spike supports the breakout. Current Price: Around 117,225 reclaiming above key resistance levels. Bullish Confirmation Levels: 117,373 (Previous resistance now acting as support) 118,495 and 119,541 Strong horizontal resistance to clear Sustained close above 120K could lead to a parabolic move toward 130K+
Traders-Lounge
XAUUSD (Gold) Bullish Trade setup

XAUUSD (Gold) Technical Analysis 📉 Bearish Trendline Breakout & Retest: Price has broken above a descending trendline and successfully retested it as support, signaling a potential trend reversal. AB=CD Pattern: A harmonic AB=CD pattern is in play, supporting the bullish continuation scenario. Bullish FVG (Fair Value Gap): Gold has taken support from a Bullish Fair Value Gap, indicating strong demand in that zone. Wyckoff Upthrust Move: A Wyckoff Upthrust has played out, suggesting a possible spring and absorption of selling pressure. Trend-Based Fibonacci Projection: The next major Fib extension level (100%) is at 3285, providing a key upside target. Trade Setup 📈 Buy @ CMP: 3203 🛡 SL: 3152 🎯 TP1: 3235 🎯 TP2: 3285⚠️ Risk Management is the Key to success 🔐
Traders-Lounge
ETHUSDT bullish idea
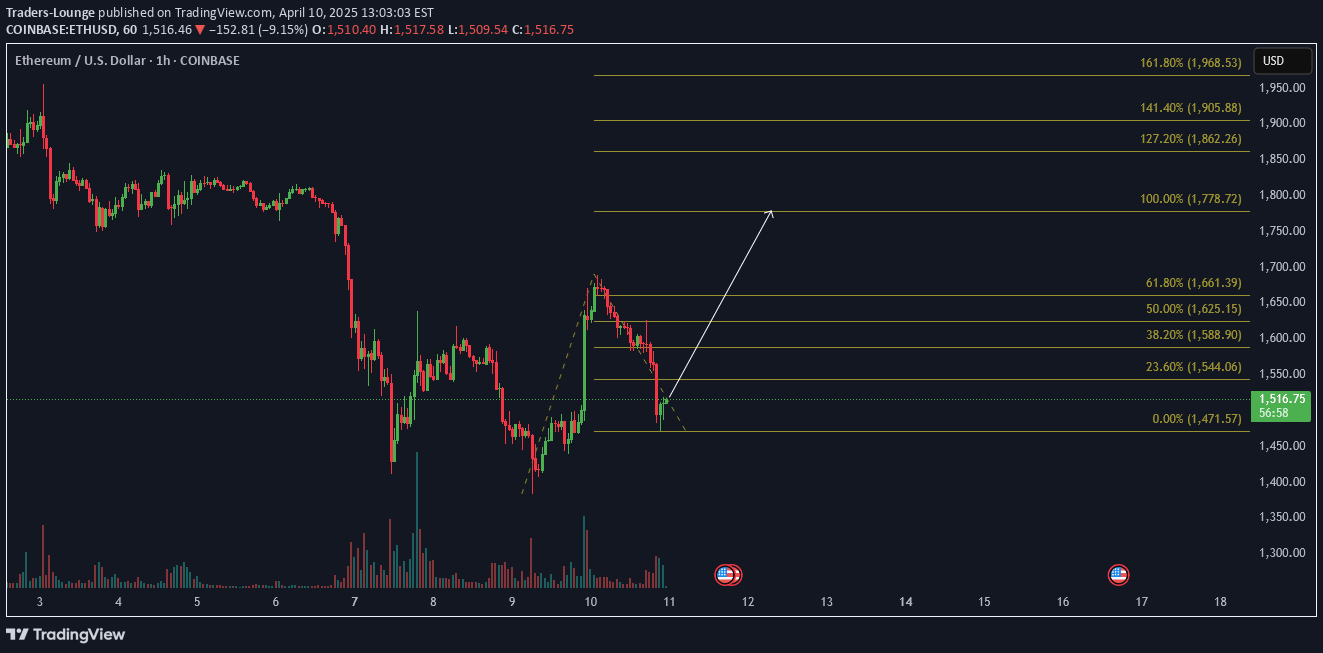
Ethusdt for long term made support after creating a double bottom it can test the previous levels
Traders-Lounge
BTCUSD Analysis for Long term Bullish scenario

In this analysis, I break down Bitcoin’s historical price action to project potential future moves strictly using price action, Fibonacci extensions, measured moves, and macro patterns. No indicators no guesswork just clean structure and market rhythm. Historical InsightUsing the trend-based Fibonacci extension from the 2017 bull run, we observed how price respected key extension levels in the 2021 cycle particularly the 161.8 and 361.8 zones.2021 Bull Run Measured MovesFrom the higher low at $9,155, BTC made a 55,900-point rally, followed by a 36,300-point correction, and then another impulsive 39,500-point move, perfectly testing fib extensions.Current Price ActionBTC recently made another 55,900-point move from the $52,500 higher low, followed by a 32,700-point correction. If this mirrors the 2021 rhythm, we can anticipate a reversal within the 36,000–37,000 point correction range.Macro Pattern: Cup and HandleFrom the $68,745 high to the $15,627 bottom and the climb back to $73,600 Bitcoin has formed a clear cup and handle pattern. The projected target for this pattern sits between $117,000 and $119,000.This analysis combines past behavior with current structure to identify potential bullish continuation always based on confirmation not prediction.If you appreciate clean price action with real structure and historical logic follow for more in-depth analysis. Let’s see how this plays out.#Bitcoin #BTCUSD #PriceAction #TechnicalAnalysis #Fibonacci #CupAndHandle #CryptoTrading #BTCAnalysis #MeasuredMoves #BullMarket #ChartPatterns
Traders-Lounge
Ethusdt Long tradeplan

Ethereum gave a consolidation breakoutAfter completing a range expected Target points on the previous liquidity area2132 2227 2299 2530Entry at 1965-1970Stop loss at the last low of 1817
Traders-Lounge
Algorand swing trade long setup

Algo swing tradeAlgorand possible move of AB=CD Buy from 0.437 to 0.401SL 0.270TP 1: 0.534Tp 2: 0.594Tp 3: 0.780
Traders-Lounge
Doge Long idea

Traders-Lounge

Traders-Lounge
Xauusd Long idea short term trade

Gold (XAUUSD) Broke out the trendline resistance and is now breaking out the horizontalresistance at 2627Buy at 2628-2633SL at 2615 TP 2641 TP2 2655TP3 2661
Disclaimer
Any content and materials included in Sahmeto's website and official communication channels are a compilation of personal opinions and analyses and are not binding. They do not constitute any recommendation for buying, selling, entering or exiting the stock market and cryptocurrency market. Also, all news and analyses included in the website and channels are merely republished information from official and unofficial domestic and foreign sources, and it is obvious that users of the said content are responsible for following up and ensuring the authenticity and accuracy of the materials. Therefore, while disclaiming responsibility, it is declared that the responsibility for any decision-making, action, and potential profit and loss in the capital market and cryptocurrency market lies with the trader.