
Trader_Petri
@t_Trader_Petri

What symbols does the trader recommend buying?
Purchase History
پیام های تریدر
Filter
Signal Type
Trader_Petri
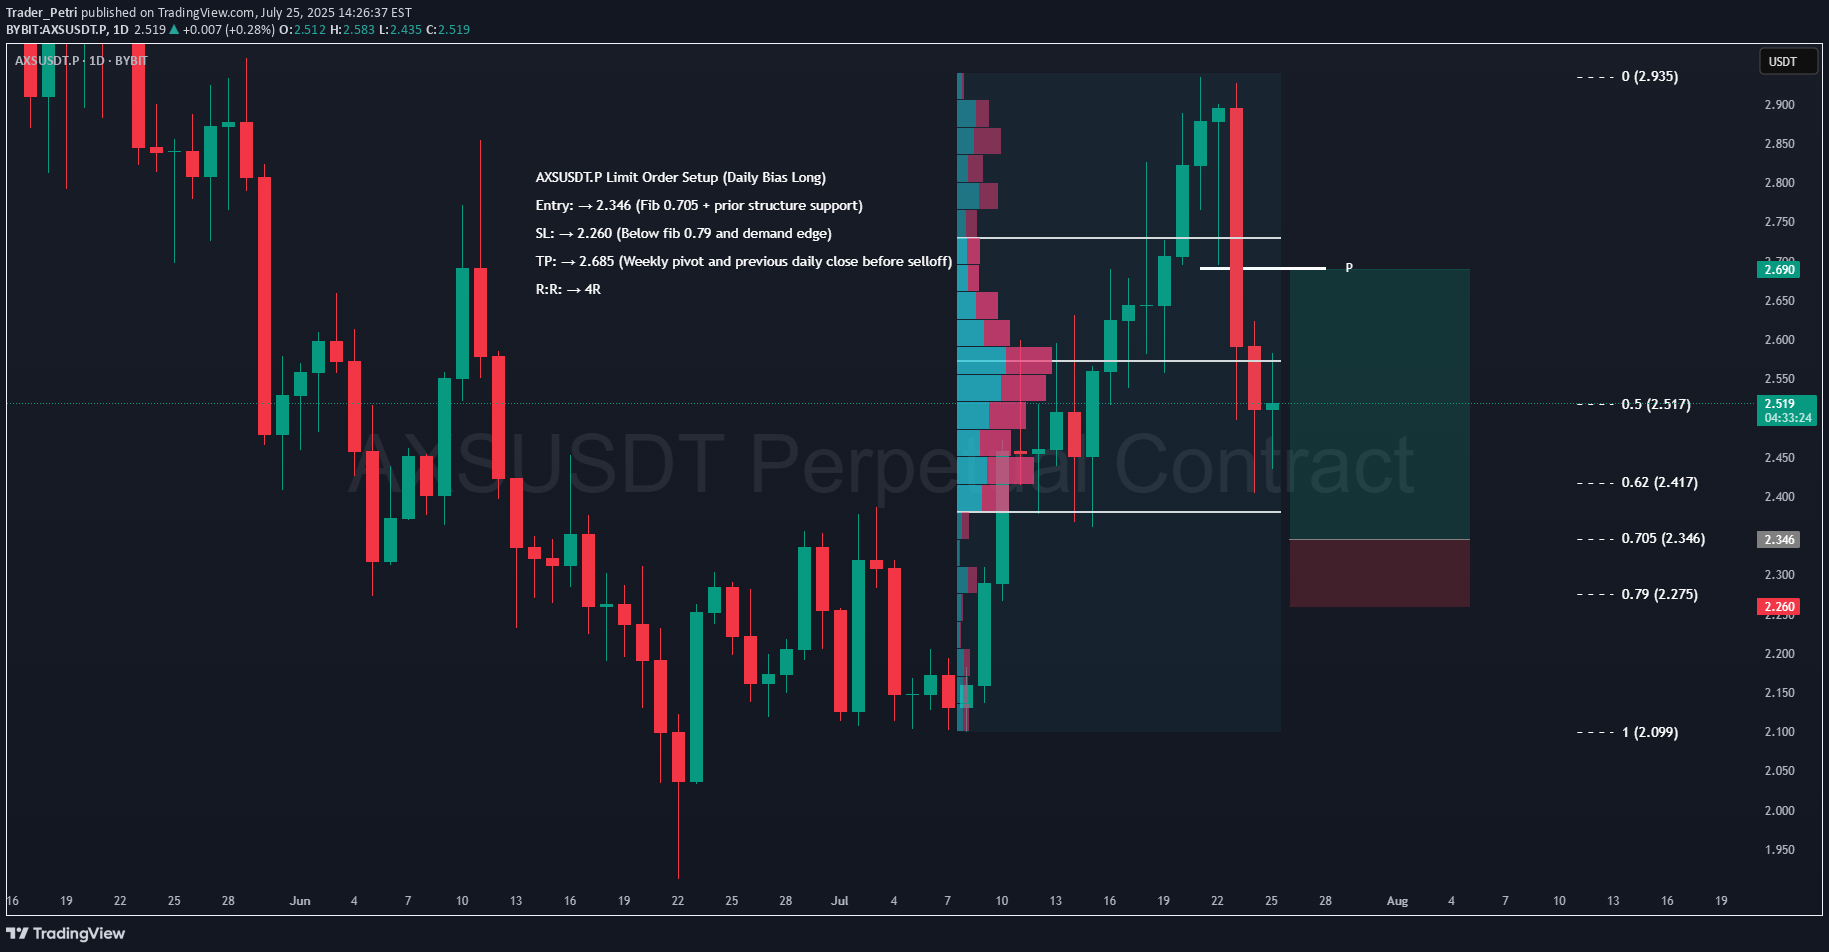
AXS Limit Order Setup (Daily Bias Long) Entry: → 2.346 (Fib 0.705 + prior structure support) SL: → 2.260 (Below fib 0.79 and demand edge) TP: → 2.685 (Weekly pivot and previous daily low before selloff) R:R: → 4R DISCLAIMER: I am not providing trading signals or financial advice. The information shared here is solely for my own documentation and to demonstrate my trading journey. By openly sharing my process, I aim to put pressure on myself to stay focused and continually improve as a trader. If you choose to act on any of this information, you do so at your own risk, and I will not be held responsible for any outcomes. Please conduct your own research and make informed decisions.Entry hit.I added TP1 at 2.52 (2.02R) It’s at the 0.5 fib and just before the daily FVG I’ll take out 60% there if it hits, and probably won’t have any other TP beyond that other than Final TP at 2.69.Price came just a whisker from my SL yesterday, tapped 2.265 while my stop was at 2.260. Now it's in profit though. If TP1 at 2.52 hits, I’ll move SL to BE.SL hit during market dump.
Trader_Petri

Price closed above both key levels I mentioned — 181 and the HTF S&R at 188 — with momentum and structure confirmation. That gave me enough conviction to enter a long. https://www.tradingview.com/chart/SOLUSDT.P/IJqRTCMQ-SOL-Potential-Cup-Handle/ 🎯 Final TP aligns closely with the measured move target: 245. 📈 SL is already at breakeven after TP1 hit — risk-free from here. Let’s see if SOL completes the full handle breakout.Entered trade: 21 July, ~10:45 UTC+3. TP1 hit. SL moved to BE.
Trader_Petri

SOL might be shaping up to be a pretty clean cup & handle . Could be big, but we’re not there just yet. Levels I’m watching: 181: Main neckline. Want to see a daily close above with volume. 188: HTF S&R — secondary confirmation. Clears this, and I’d say the move is real. Measured target: Somewhere around 245–251 if it plays out. Let’s see if SOL has more in the tank.
Trader_Petri

After checking BTC HTF charts, my take is that there is a resistance around $123K–$125K zone (psychological + measured move extensions). I drew a fib extension in november last year where I pointed out that 108K+ will be ATH Q1 2025 (check my TV post). It hit 110K, so pretty close. The next level was 125K, so that´s pretty close to were we are now (123K). So were are we heading now? I might draw a new fib soon, but I see that monthly is strongly bullish. Stoch RSI is turning up from mid-range, so still has room to run. Volume hasn't spiked dramatically, so a healthy climb without blow-off. 100K looks like a resistance turned into support (also a psychological level). Weekly is bullish with last weeks strong candle managed to breakout from that 110K level (should now be resistance level). Volume is increasing week-over-week the last weeks which confirms breakout strength. I see that if we loose 100K it could be critical (invalidation of bullish BIAS). On daily the Stoch RSI is curling downward from overbought which might imply cooling off = short-term retrace. Price has rallied sharply and is currently pulling back slightly after tagging 123K. A pullback to 110-116K looks likely. It would be healthy and expected.
Trader_Petri

In the last couple of days, momentum and structure have aligned across the board. Daily reclaimed its breakout zone with conviction, and 4H structure held strong through the recent pullback. We’re seeing clear confluence stack up in the key support zones, including order blocks, breaker blocks, and fair value gaps, all pointing toward healthy re-accumulation rather than a full reversal. Volume profile confirms strong support beneath, and Stochastic RSI on 4H has reset and started turning upward. All of this gives solid reason to scale in confidently across the mapped zones rather than chase strength, so I’ve placed 3 limit long orders on LINK, all anchored in the HTF zones I outlined in my recent idea (link below). https://www.tradingview.com/chart/LINKUSDT.P/jViQKeYH-LINK-MTF-Breakdown/ ________________________________________ Limit Long Orders: • Trade 1 [1.42R] → SL: 13.7 | Entry: 15.48 | TP: 18 • Trade 2 [3.81R] → SL: 13.3 | Entry: 14.9 | TP: 21 • Trade 3 [5.16R] → SL: 13.3 | Entry: 14.55 | TP: 21 ________________________________________ 📍 Trade 1 is positioned higher, just around the 15.20–15.50 decision zone — tighter TP at 18 and wider SL to allow some breathing room. The goal here is to catch continuation early if momentum holds. 📍 Trades 2 & 3 are set deeper, around the 14.80 and 14.50 zones — key areas of volume and fib confluence I highlighted earlier. Both target 21 for higher R. 🧩 The idea: scale in as price dips, adjusting SL/TP to match the depth and structure. No need to chase — just let the levels work. DISCLAIMER: I am not providing trading signals or financial advice. The information shared here is solely for my own documentation and to demonstrate my trading journey. By openly sharing my process, I aim to put pressure on myself to stay focused and continually improve as a trader. If you choose to act on any of this information, you do so at your own risk, and I will not be held responsible for any outcomes. Please conduct your own research and make informed decisions.Entry hit on Trade 1.If price reaches 16.75, I will take 40% profit (TP1) on Trade 1 and move the stop loss to breakeven. If the full TP at 18 is hit, I will cancel Trade 2 and Trade 3 — unless either has already been triggered, in which case I will manage them separately.Noticing potential pattern confluence on the daily. There’s a possible inverse head and shoulders forming with a neckline breakout, and price action also resembles a cup and handle structure. If these hold, they could support a bullish continuation. Adds some conviction to the long plan, but will still watch for confirmation or a retest before getting too confident.TP1 (16.75) hit on trade 1. Moved SL to BE. Now risk-free and profitable!Now ( @16.8 ) adjusting SL up to 16.20, just below the 4H FVG and recent structure. Locks in a bit more profit while still giving the trade some breathing room for a move towards TP2 at 18. That 16.20 would be under the 15M low volume area and also below the 50 EMA, which should hold if bullish momentum is to continue. Gives the trade some room but protects gains if it rolls over. Let’s see how it plays out.Got a comment on the three-limit order setup, so just adding a quick note here: The idea behind it is to stay prepared without needing to monitor every move. If price just taps into one of the key HTF zones and runs, I’m in, but if it pulls back deeper, the staggered orders let me scale in without catching a falling knife blindly. It adds structure and cushions the entry risk. I’ve found this especially useful when setting limit orders without confirmation, especially if I’m not at the screen. Keeps the plan mechanical but still aligned with the bigger picture.SL moved up to 16.74, just under TP1 level. Price is now holding around the 15M POC at 17.09. Locks in more profit while having some room for price to push toward TP2 at 18.Full TP hit. Cancelling trade 2 & 3. Nice profits!
Trader_Petri

Been tracking this one across the board – Daily, 4H, and 15M are now all in sync. Bullish structure is clear, but we’re entering mid-to-premium zones so it’s more about patience now. Daily Outlook Structure broke up above 14.80 and we’re holding above the high-volume zone around 14.50. Clean reclaim of value and FVG filled – price is now dancing near the top of that range. Still some room before the big HTF resistance up at 18+. 4H Structure Solid HH/HL trend holding. Fibs and volume aligned: 14.85 was the 0.618 zone from the last leg and it bounced right off. If bulls defend the 15.20–15.50 pocket, momentum stays with them. 15M Zoom-In HLs forming cleanly. That 15.20–15.50 zone? It’s loaded – FVG, OB, and a breaker block all stacked in there. Price poked into some light supply around 15.85 – we either squeeze through soon or pull back first. Zones I’m Watching Over Next 1–3 Days: 14.80–15.00 → reload zone if we dip 15.20–15.50 → key intraday decision area 15.85–16.00 → first real test of breakout strength 18.00–18.80 → HTF magnet zone if momentum continues Staying patient here. No rush to chase. Just watching how price behaves around those stacked zones. If 15.20 holds firm, I’ll stay bullish through the weekend.Quick add: 15.20–15.50 is mainly a 15M structure zone, not 4H. Still key for short-term momentum.Daily structure is also starting to look like a potential cup and handle. A small pullback here could form the handle and it is worth watching if momentum continues.
Trader_Petri

Limit long placed on MAGIC after strong impulsive breakout and retrace into structural support, overlapping the golden pocket zone and anchored volume clusters. Price is compressing just below a minor supply shelf, and the setup targets a continuation move into recent highs. Risk is tightly defined with favorable reward-to-risk, and capital protection is structured early. I'm entering before full confirmation to gain better RR. The trade accepts possible deeper pullback or invalidation in exchange for prime fill location and front-running potential continuation. The setup blends 4H and 15M structure. On the 4H, price retraced into the 0.382–0.5 fib levels from the July breakout and is holding above EMA confluence and mid-channel demand. The 15M shows fair value gaps, order blocks, and volume shelf demand near 0.1855, with recent wicks rejecting lower prices. A higher low may be forming. Limit Long MAGICUSDT.P Entry: $0.1855 Stop-Loss: $0.1823 Total Risk: 1% of account capital TP1: $0.1975 (40% – cover exposure + reduce risk). Move SL to BE [R: 3.64] TP2: $0.2043 (40% – primary exit near local supply) [R: 5.68] TP3: $0.2150 (20% – continuation target) [R: 9.11] Take profit one locks in early gains and removes risk. TP2 aims for full move toward prior swing highs. TP3 leaves a runner in case continuation develops. SL is tucked just under the 15M structure and key volume support, outside minor wick zones but tight enough for good RR. ✅ Weekly bullish structure ✅ 4H demand + fib retrace ✅ 1H volume support + BOS ✅ 15M OB + FVG rejection DISCLAIMER: I am not providing trading signals or financial advice. The information shared here is solely for my own documentation and to demonstrate my trading journey. By openly sharing my process, I aim to put pressure on myself to stay focused and continually improve as a trader. If you choose to act on any of this information, you do so at your own risk, and I will not be held responsible for any outcomes. Please conduct your own research and make informed decisions.Midnight entry (UTC+3) hit. Now it’s either liftoff or instant SL execution 😂💀Plan to take this short hedge at 0.1869 if the long doesn't hit SL first. Setup based on FVG rejection. SL at 0.1915, targets at 0.1835 / 0.1785 / 0.1706.SL hit. I am out. To bed.What Went Wrong (in hindsight): I placed the limit order when conditions looked solid — clean structure, confluence stacking, and a high-probability setup based on the then-current market state. But price stalled, chopped sideways, and lost momentum. The market evolved, but I didn’t adjust. I left the limit order active even after the edge had weakened. When price eventually hit the level, it wasn’t the same high-probability setup anymore — and I got tagged into a dead zone with no confirmation and no strength. ⸻ 🧠 Lesson: High-probability setups can degrade over time. ➡️ A good setup at 18:00 might be a trap by 23:00. If the trade doesn’t trigger quickly or cleanly, it’s often a signal in itself. The edge is in the timing + context, not just the level. Next time: ❌ Don’t marry the limit. ✅ Reassess before entry — or require confirmation.
Trader_Petri

Limit swing long placed on LTC based on consolidation above higher timeframe support and compression below a descending trendline. The setup targets a potential breakout continuation, with defined invalidation and a clear take profit ladder. Risk is tight, reward to risk is strong, and capital protection is included. I am entering before full confirmation due to the price squeezing near support. I accept the chance of a failed breakout in return for early entry and better reward to risk. The setup combines both daily and one hour timeframes. The daily shows structure holding above support and pressing into the trendline. On the one hour chart, the 0.236 Fibonacci level has held after an impulsive move, with high volume support around 84 to 85. A higher low is forming locally. Limit Swing Long LTC. Entry: $84.25 Stop-Loss: $81.70 Total risk: 1% of account capital. TP1: $86.80 (30% – early profit, reduce risk). Move SL to $84.7. [R: 1.00] TP2: $91.70 (40% – take out most capital) [R: 2.92] TP3: $103 (20% – trend continuation) [R: 7.35] TP4: $124 (10% – moonshot runner) [R: 15.59] Take profit one locks in gains and reduces exposure. Take profit two is the main target near resistance. Take profits three and four aim for continuation if the breakout develops. Stop loss is placed below structural support and the 0.236 Fibonacci level, far enough to avoid noise but close enough to protect capital. DISCLAIMER: I am not providing trading signals or financial advice. The information shared here is solely for my own documentation and to demonstrate my trading journey. By openly sharing my process, I aim to put pressure on myself to stay focused and continually improve as a trader. If you choose to act on any of this information, you do so at your own risk, and I will not be held responsible for any outcomes. Please conduct your own research and make informed decisions.
Trader_Petri

I’ve entered a swing long on AKT at $1.048, targeting a potential trend reversal off a developing base structure. This setup is riskier than my others, as price is still below macro resistance and hasn’t confirmed a full breakout yet. However, the high R:R potential and strong volume support at this level make it a worthwhile calculated risk. The setup is based on the daily chart for structure and volume confluence, and the 1-hour chart for entry timing.My stop is placed below structural invalidation, and I have two profit targets: one conservative (TP1) and one trend-continuation (TP2). I plan to move my stop to breakeven after TP1 is hit in order to protect the trade and let the remainder run risk-free.Entry at $1.048 – Price is compressing into a base with heavy volume support around $1.00–$1.10. The entry is just above a high-volume node and near fib retracement levels. 1H structure supports the idea with higher lows forming.Stop-loss at $0.98 – Below the consolidation base and high-volume support. If broken, the setup is invalidated and structure breaks down.TP1 at $1.23 – Prior breakdown level and first supply zone. Logical place to take partial profits and move stop to breakeven. Locks in ~2.7R.TP2 at $1.50 – Full rotation target to upper volume gap and possible fib extension. If momentum builds, this is where I expect a major reaction. Gives ~6.6R.DISCLAIMER: I am not providing trading signals or financial advice. The information shared here is solely for my own documentation and to demonstrate my trading journey. By openly sharing my process, I aim to put pressure on myself to stay focused and continually improve as a trader. If you choose to act on any of this information, you do so at your own risk, and I will not be held responsible for any outcomes. Please conduct your own research and make informed decisions.Entered @ $1.048. Keeping fingers crossed!Moved SL to breakeven early despite original plan to do it at TP1. Managing multiple trades so locking in risk-free to protect capital while setup still looks valid.If TP1 at $1.23 hits, I’ll move SL up to $1.10 to lock in a bit more profit as it sits above the recent consolidation and keeps the trade protected without cutting it too tight.SL hit at BE. No win, no loss.
Trader_Petri

API3 making HL and HH on daily. Putting on a limit trade with final TP just below weekly trendline and SL below recent low. Aiming for a 8R trade. Entry just below daily POC.DISCLAIMER: I am not providing trading signals or financial advice. The information shared here is solely for my own documentation and to demonstrate my trading journey. By openly sharing my process, I aim to put pressure on myself to stay focused and continually improve as a trader. If you choose to act on any of this information, you do so at your own risk, and I will not be held responsible for any outcomes. Please conduct your own research and make informed decisions.
Disclaimer
Any content and materials included in Sahmeto's website and official communication channels are a compilation of personal opinions and analyses and are not binding. They do not constitute any recommendation for buying, selling, entering or exiting the stock market and cryptocurrency market. Also, all news and analyses included in the website and channels are merely republished information from official and unofficial domestic and foreign sources, and it is obvious that users of the said content are responsible for following up and ensuring the authenticity and accuracy of the materials. Therefore, while disclaiming responsibility, it is declared that the responsibility for any decision-making, action, and potential profit and loss in the capital market and cryptocurrency market lies with the trader.