
Trader408
@t_Trader408

What symbols does the trader recommend buying?
Purchase History
پیام های تریدر
Filter
Signal Type
Trader408
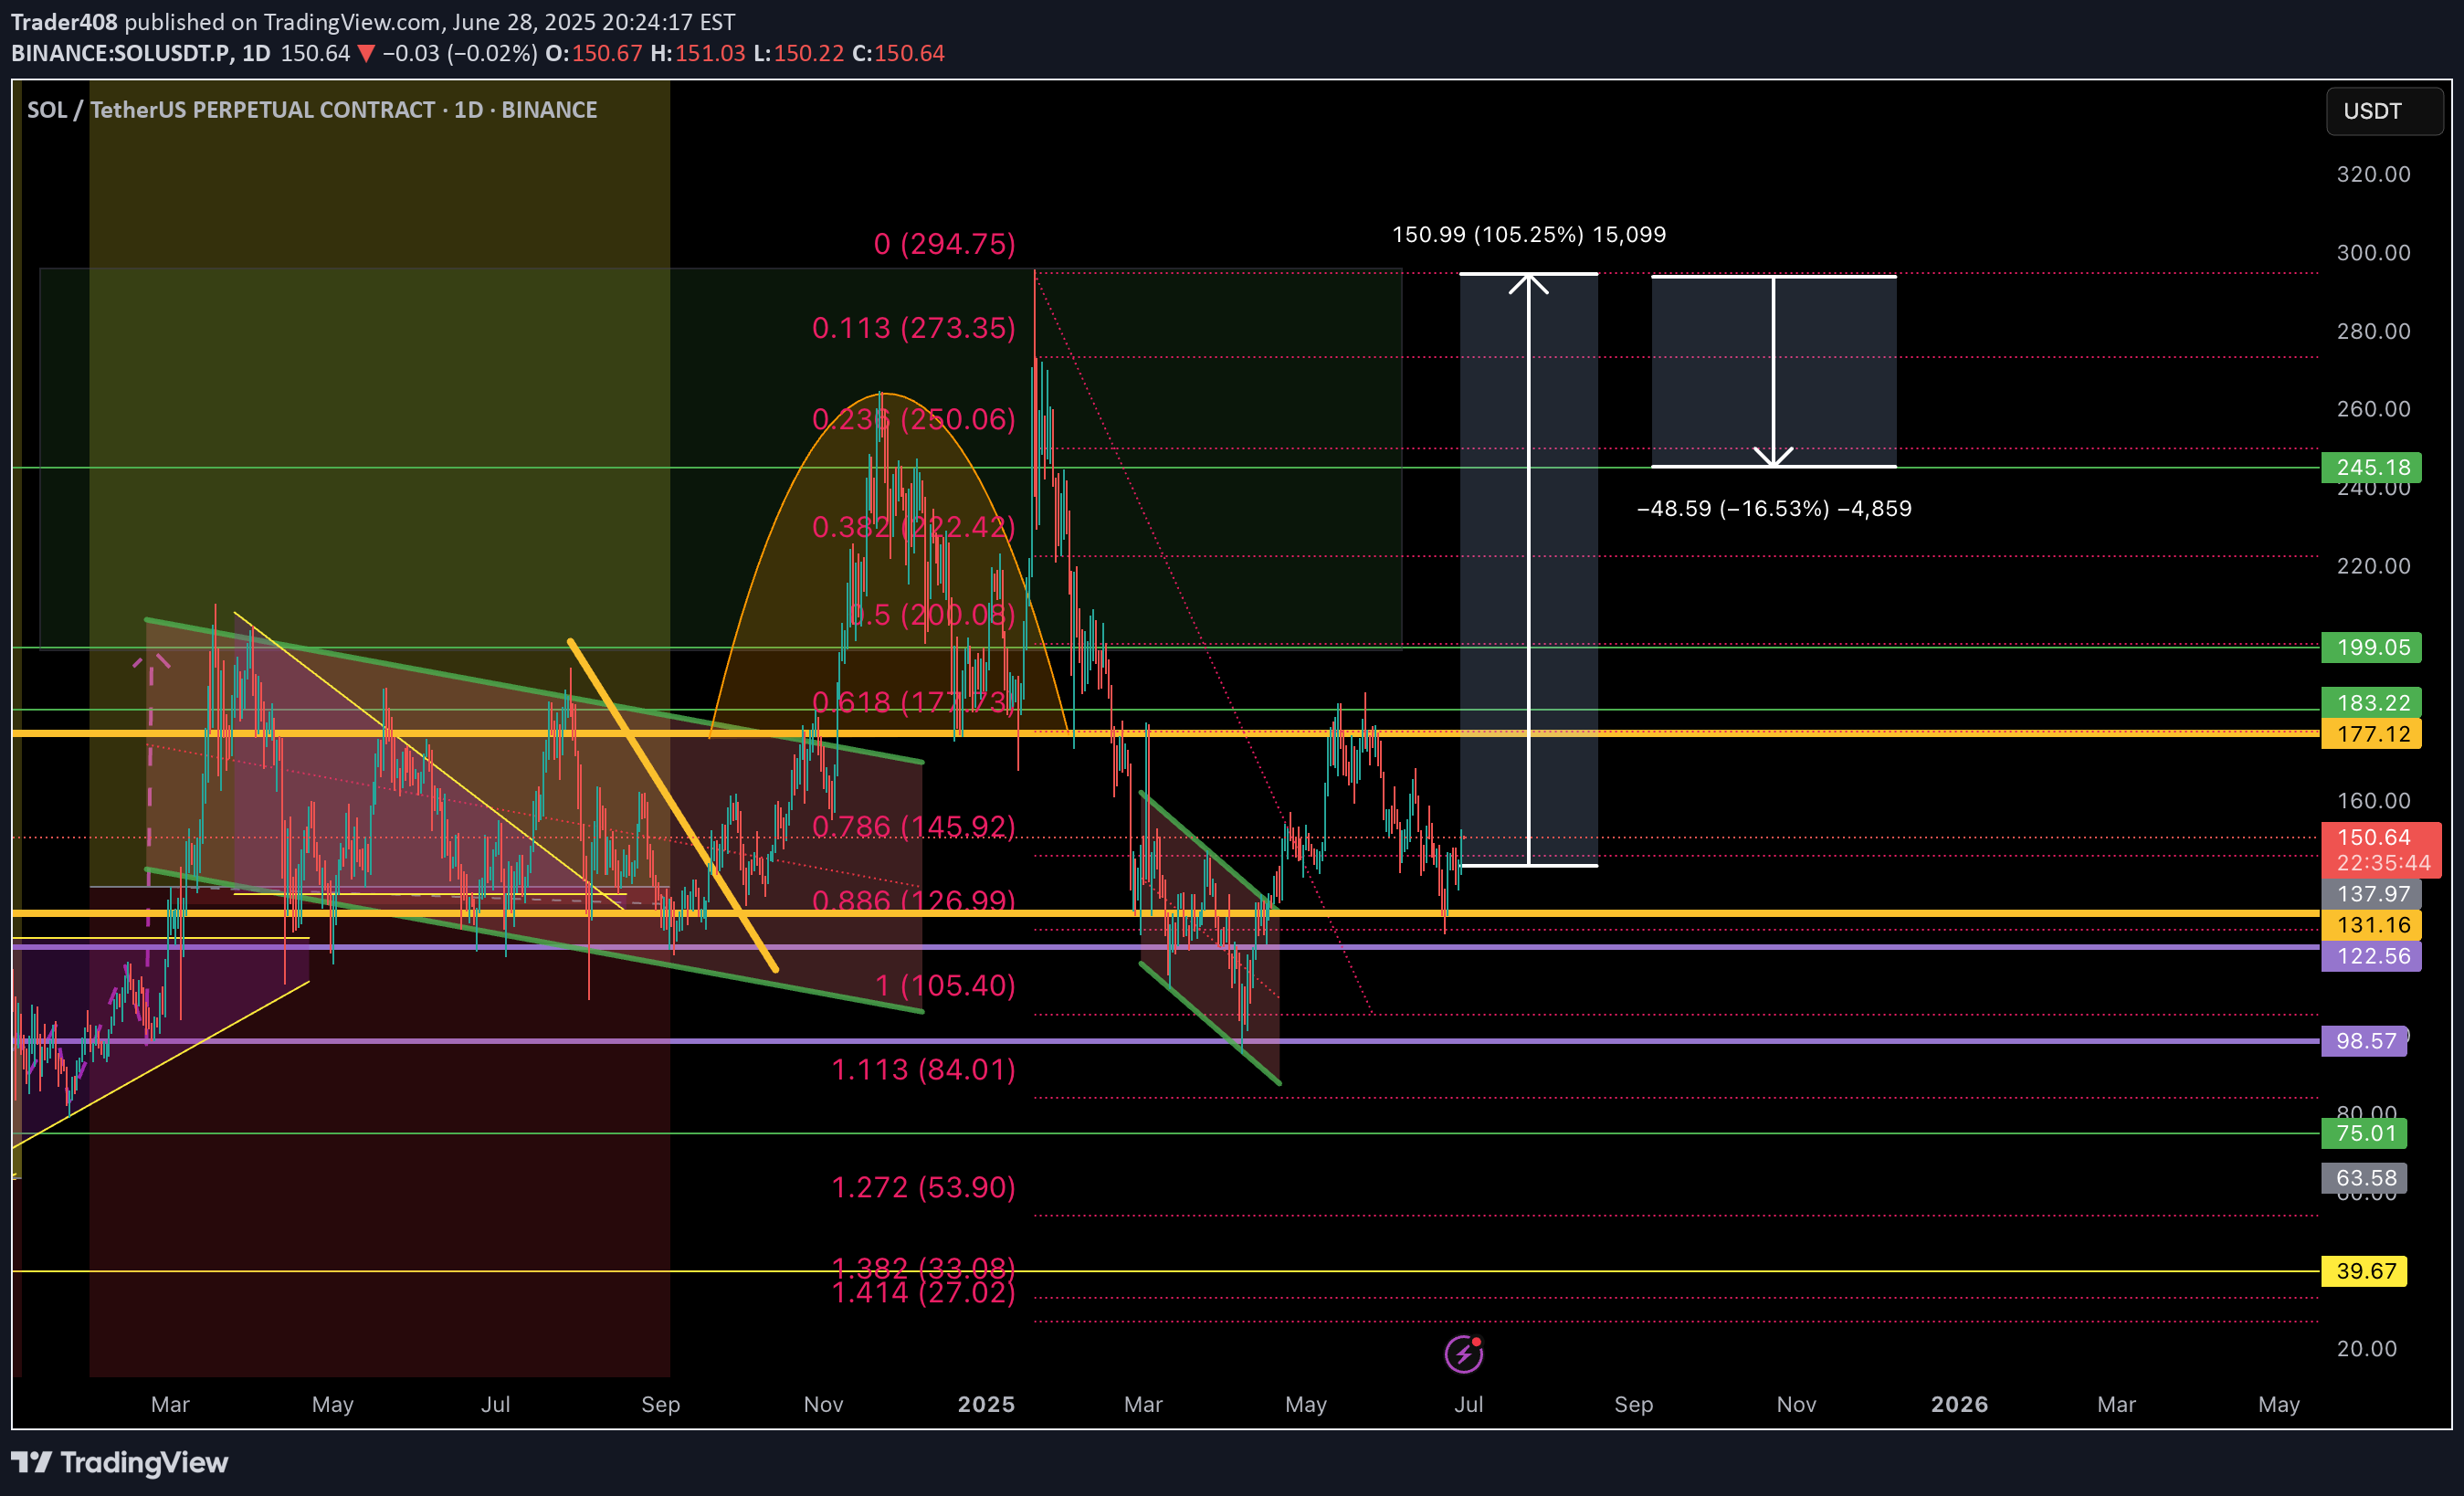
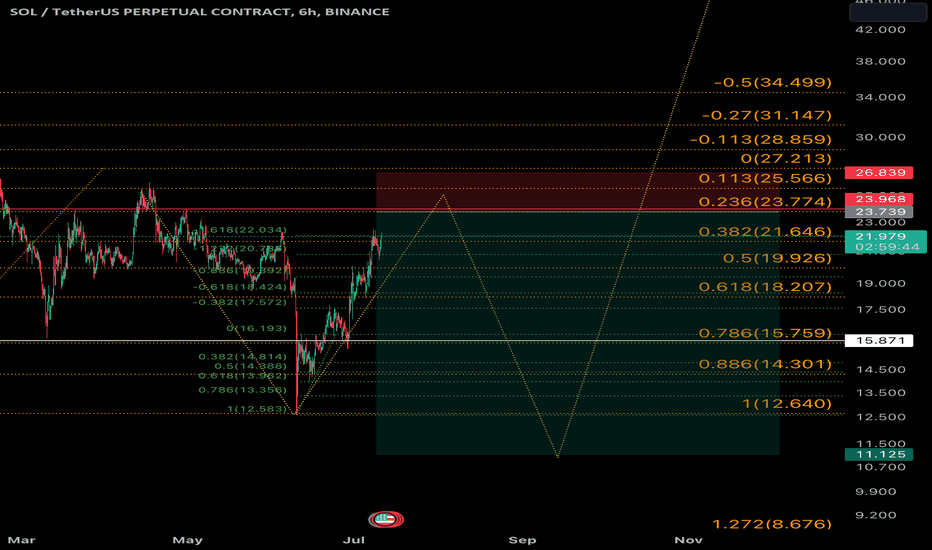
📈 SOL/USDT Long-Term Setup: Potential for 100%+ Upside or 16% Downside This chart presents a Fibonacci-based technical outlook on Solana (SOL/USDT) on the daily timeframe. 🔍 Key Highlights: Current price: $150.65 Major resistance zones: $177.12, $183.22, and $199.05 Fibonacci retracement levels (from $294.75 high): 0.618 at $171.32 0.5 at $200.08 0.382 at $222.42 Strong support at $137.97, $131.16, and $122.56 Downside risk to $126.99 (0.886 Fib) or even $105.40 (1 Fib) Bullish target: $301.64 (+105.25%) Bearish scenario: $126.99 or lower (-16.53%) 📊 The chart includes harmonic structures and descending/ascending channels suggesting consolidation, but the current structure could pivot into a bullish continuation if key resistances are broken. 🎯 Risk-to-Reward Ratio Favorable for Bulls: The setup offers a potential 105% upside against a 16% downside, making it attractive for medium- to long-term traders. ⚠️ As always, manage your risk appropriately and consider macroeconomic factors.
Trader408
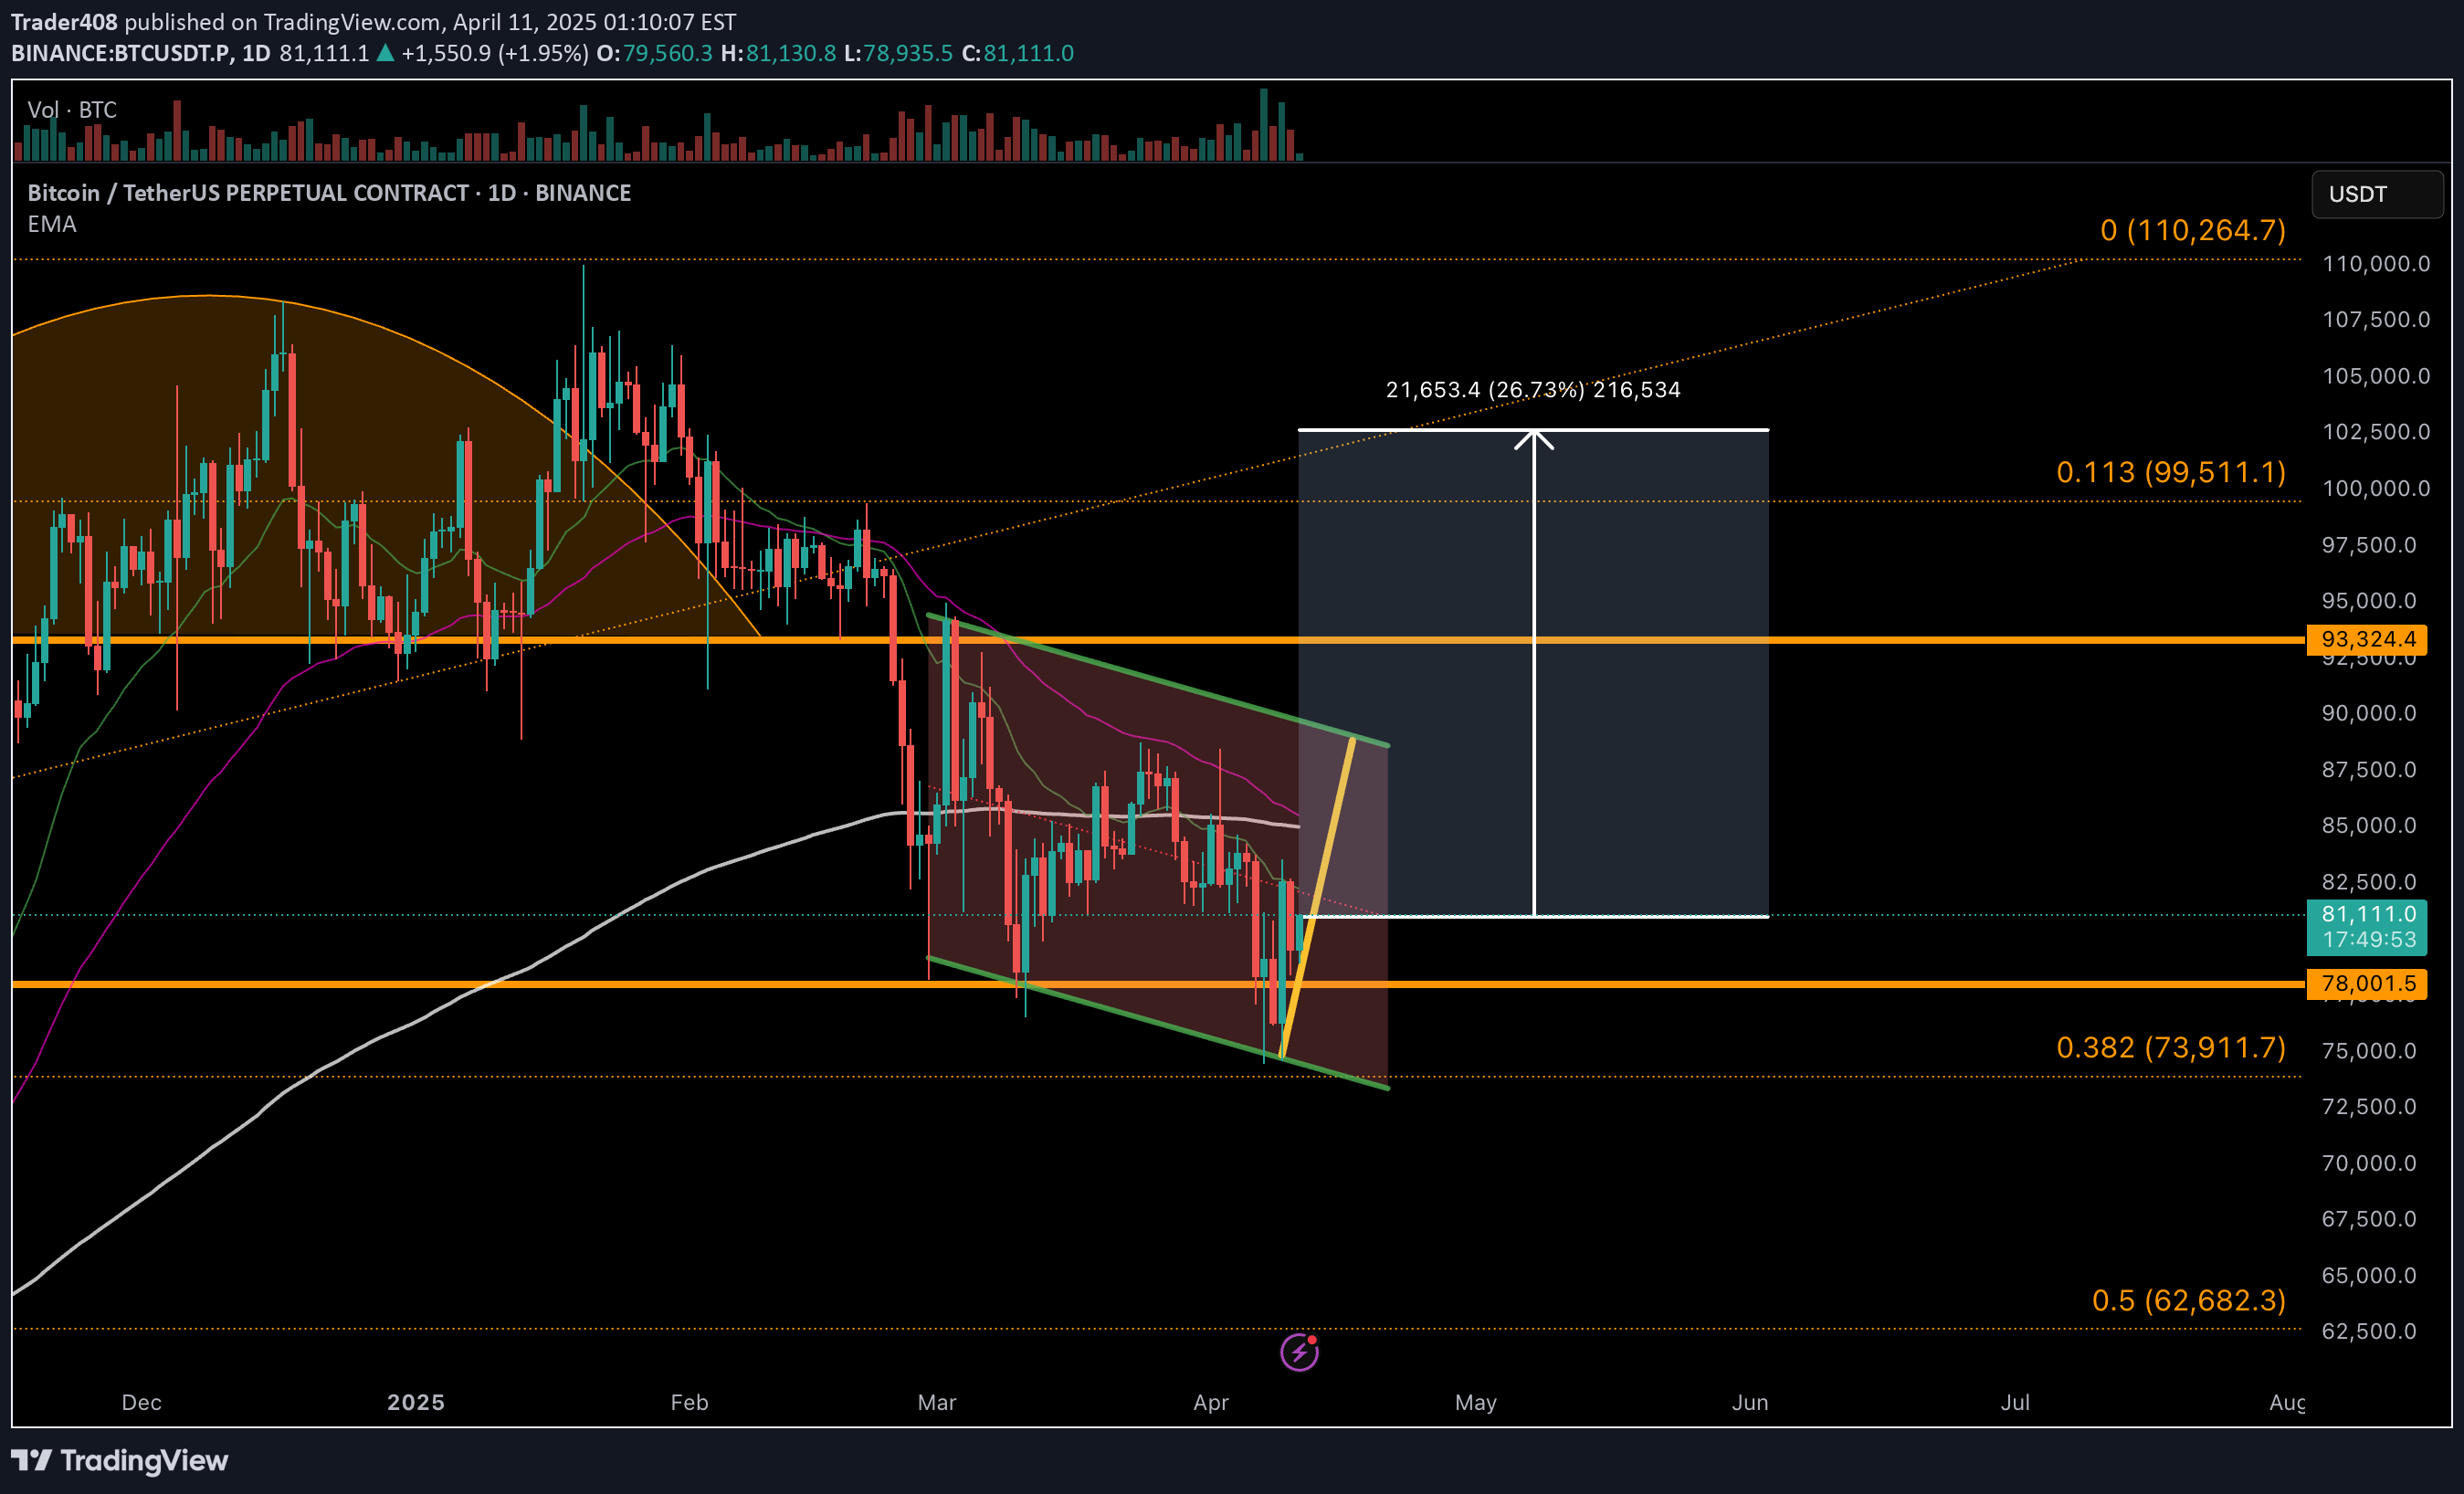
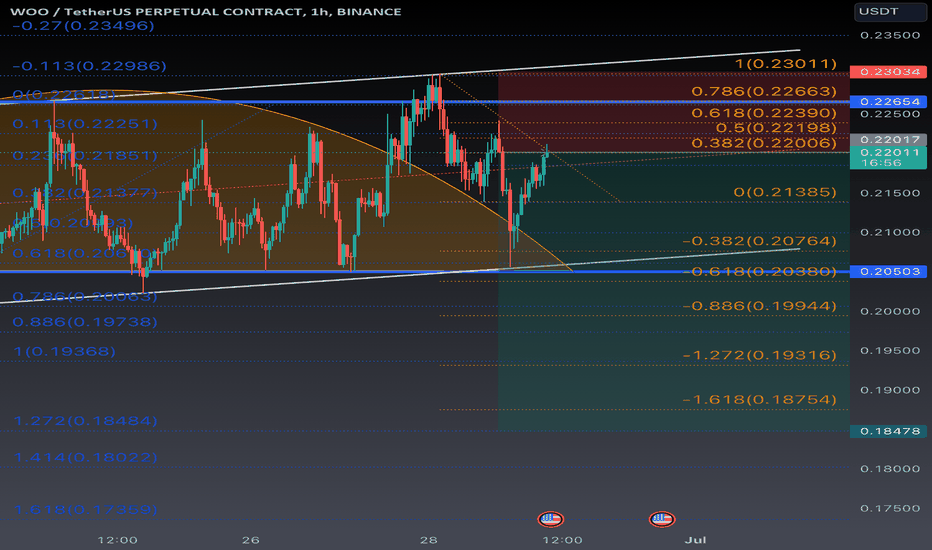
its a descending channel. Usually, a fractal is preceded by 3 driver but in this case, I have identified a channel that might indicate a reversal. Let me know what you thing of it. NFA.
Trader408
Its likely to see price increase with btc performance so far. A blow off the top to complete the three driver target to A
Trader408
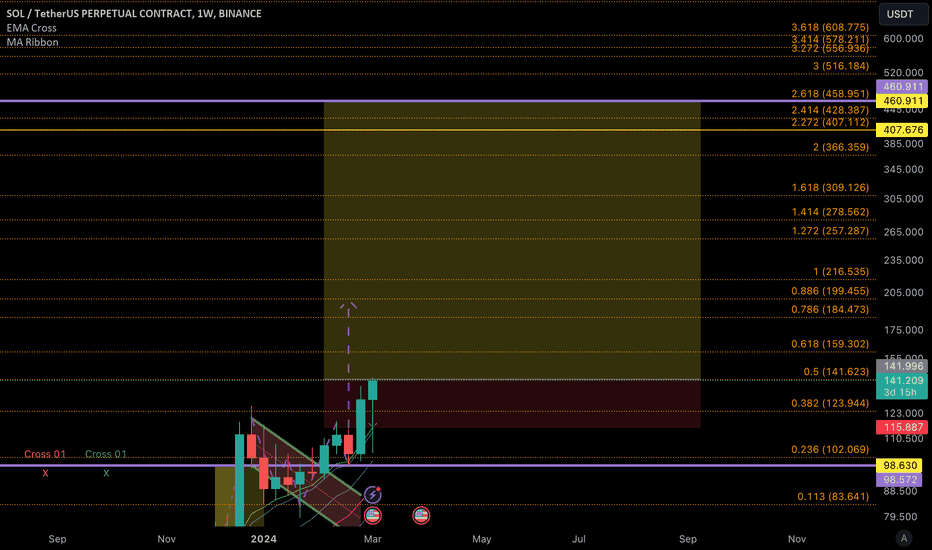
This is a fib extension that is yet to complete at 1. / $18 Once $18 his, it will be the break out of the falling wedge. Price has attempted to break golden fib severally. I t might happen this time.
Trader408
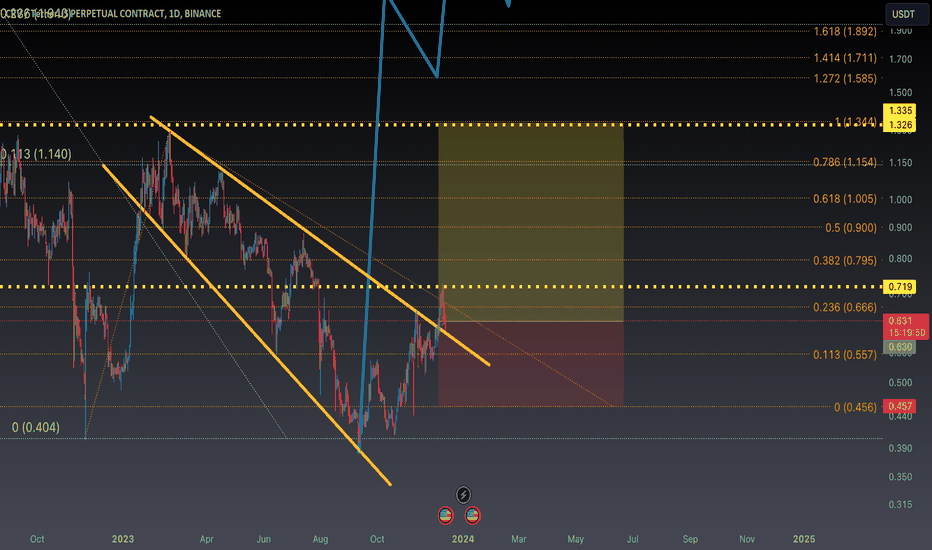
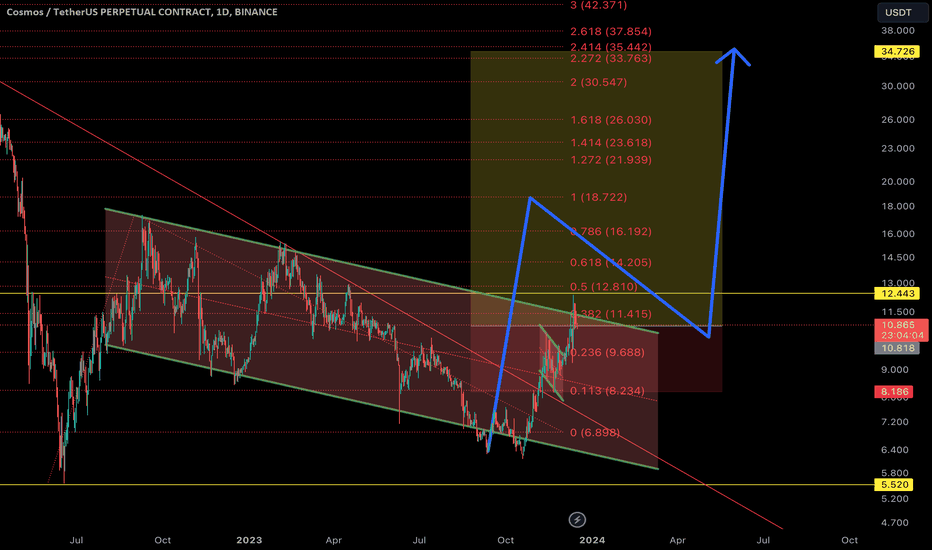
A livermmore cylinder pattern might breakout here. First take profit is at fib 1. You can also wait for the breakout to this point and reenter at 0.236. Not financial advice.
Trader408
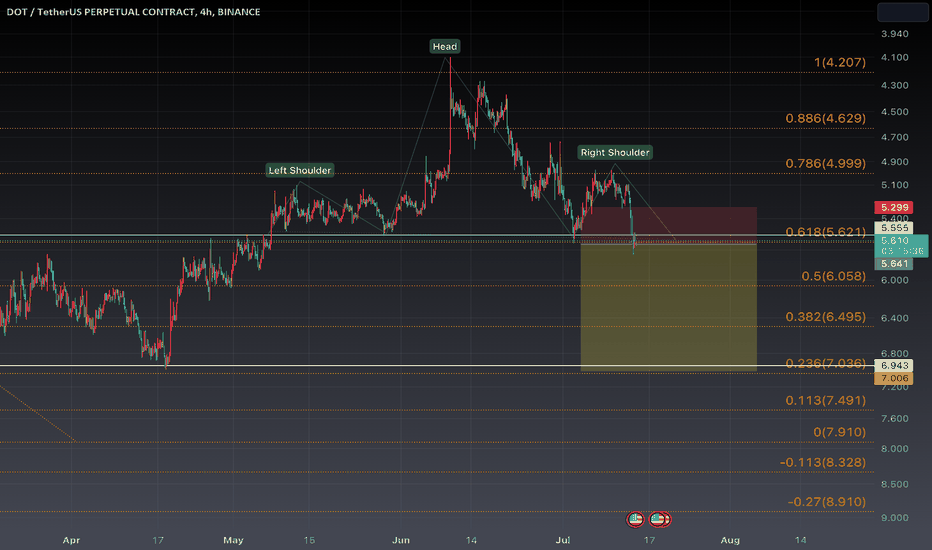
Head and shoulder pattern on DOT. This pattern is a variation of a double bottom. the right shoulder represents the retest of the double bottom. we could see a breakout to $7
Trader408
A trend is likely to give an opportunity for a re-entry.
Trader408
If this plays out, take profit along the way • This is a reversal pattern and you can use it for a short or long position as long as you can identify it on either an inverted or normal chart • The pattern is characterised by Higher low followed by a lower low and a deep dive that can be traded. * You can allow the deep dive to play out completely before taking the reversal position * Research more on the 3 driver pattern and the fib. levels.
Trader408
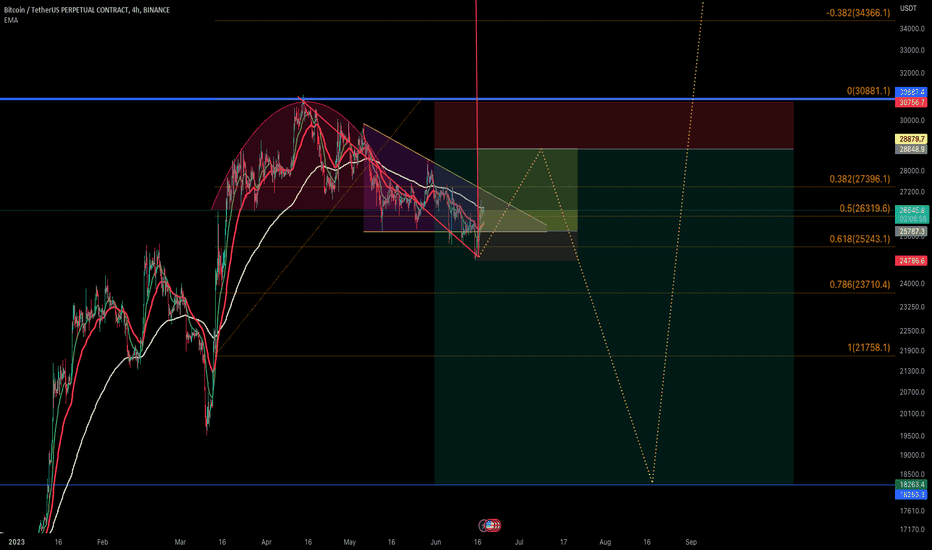
In strong bull case, we can see a new swing high In case of a rejection at 29k, we should expect a lower price at 18800 and its up from there.
Trader408
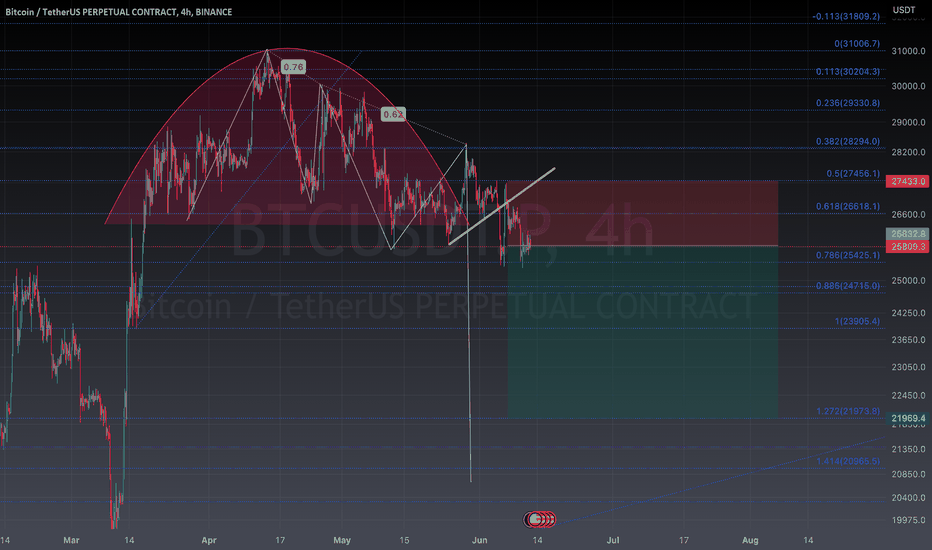
Fractal method on BTC Seeing a possible flush to the 22k area. this is because of the fractal pattern that has now broken down. Entry at 25800 or higher. Bulls expect a double bottom bullish move but are in for a surprise . Refer to the linked post
Disclaimer
Any content and materials included in Sahmeto's website and official communication channels are a compilation of personal opinions and analyses and are not binding. They do not constitute any recommendation for buying, selling, entering or exiting the stock market and cryptocurrency market. Also, all news and analyses included in the website and channels are merely republished information from official and unofficial domestic and foreign sources, and it is obvious that users of the said content are responsible for following up and ensuring the authenticity and accuracy of the materials. Therefore, while disclaiming responsibility, it is declared that the responsibility for any decision-making, action, and potential profit and loss in the capital market and cryptocurrency market lies with the trader.