
TotoshkaTrades
@t_TotoshkaTrades

What symbols does the trader recommend buying?
Purchase History
پیام های تریدر
Filter
TotoshkaTrades
اصلاح قیمت اتریوم (ETH): پایان اصلاح یا شروع طوفان جدید؟
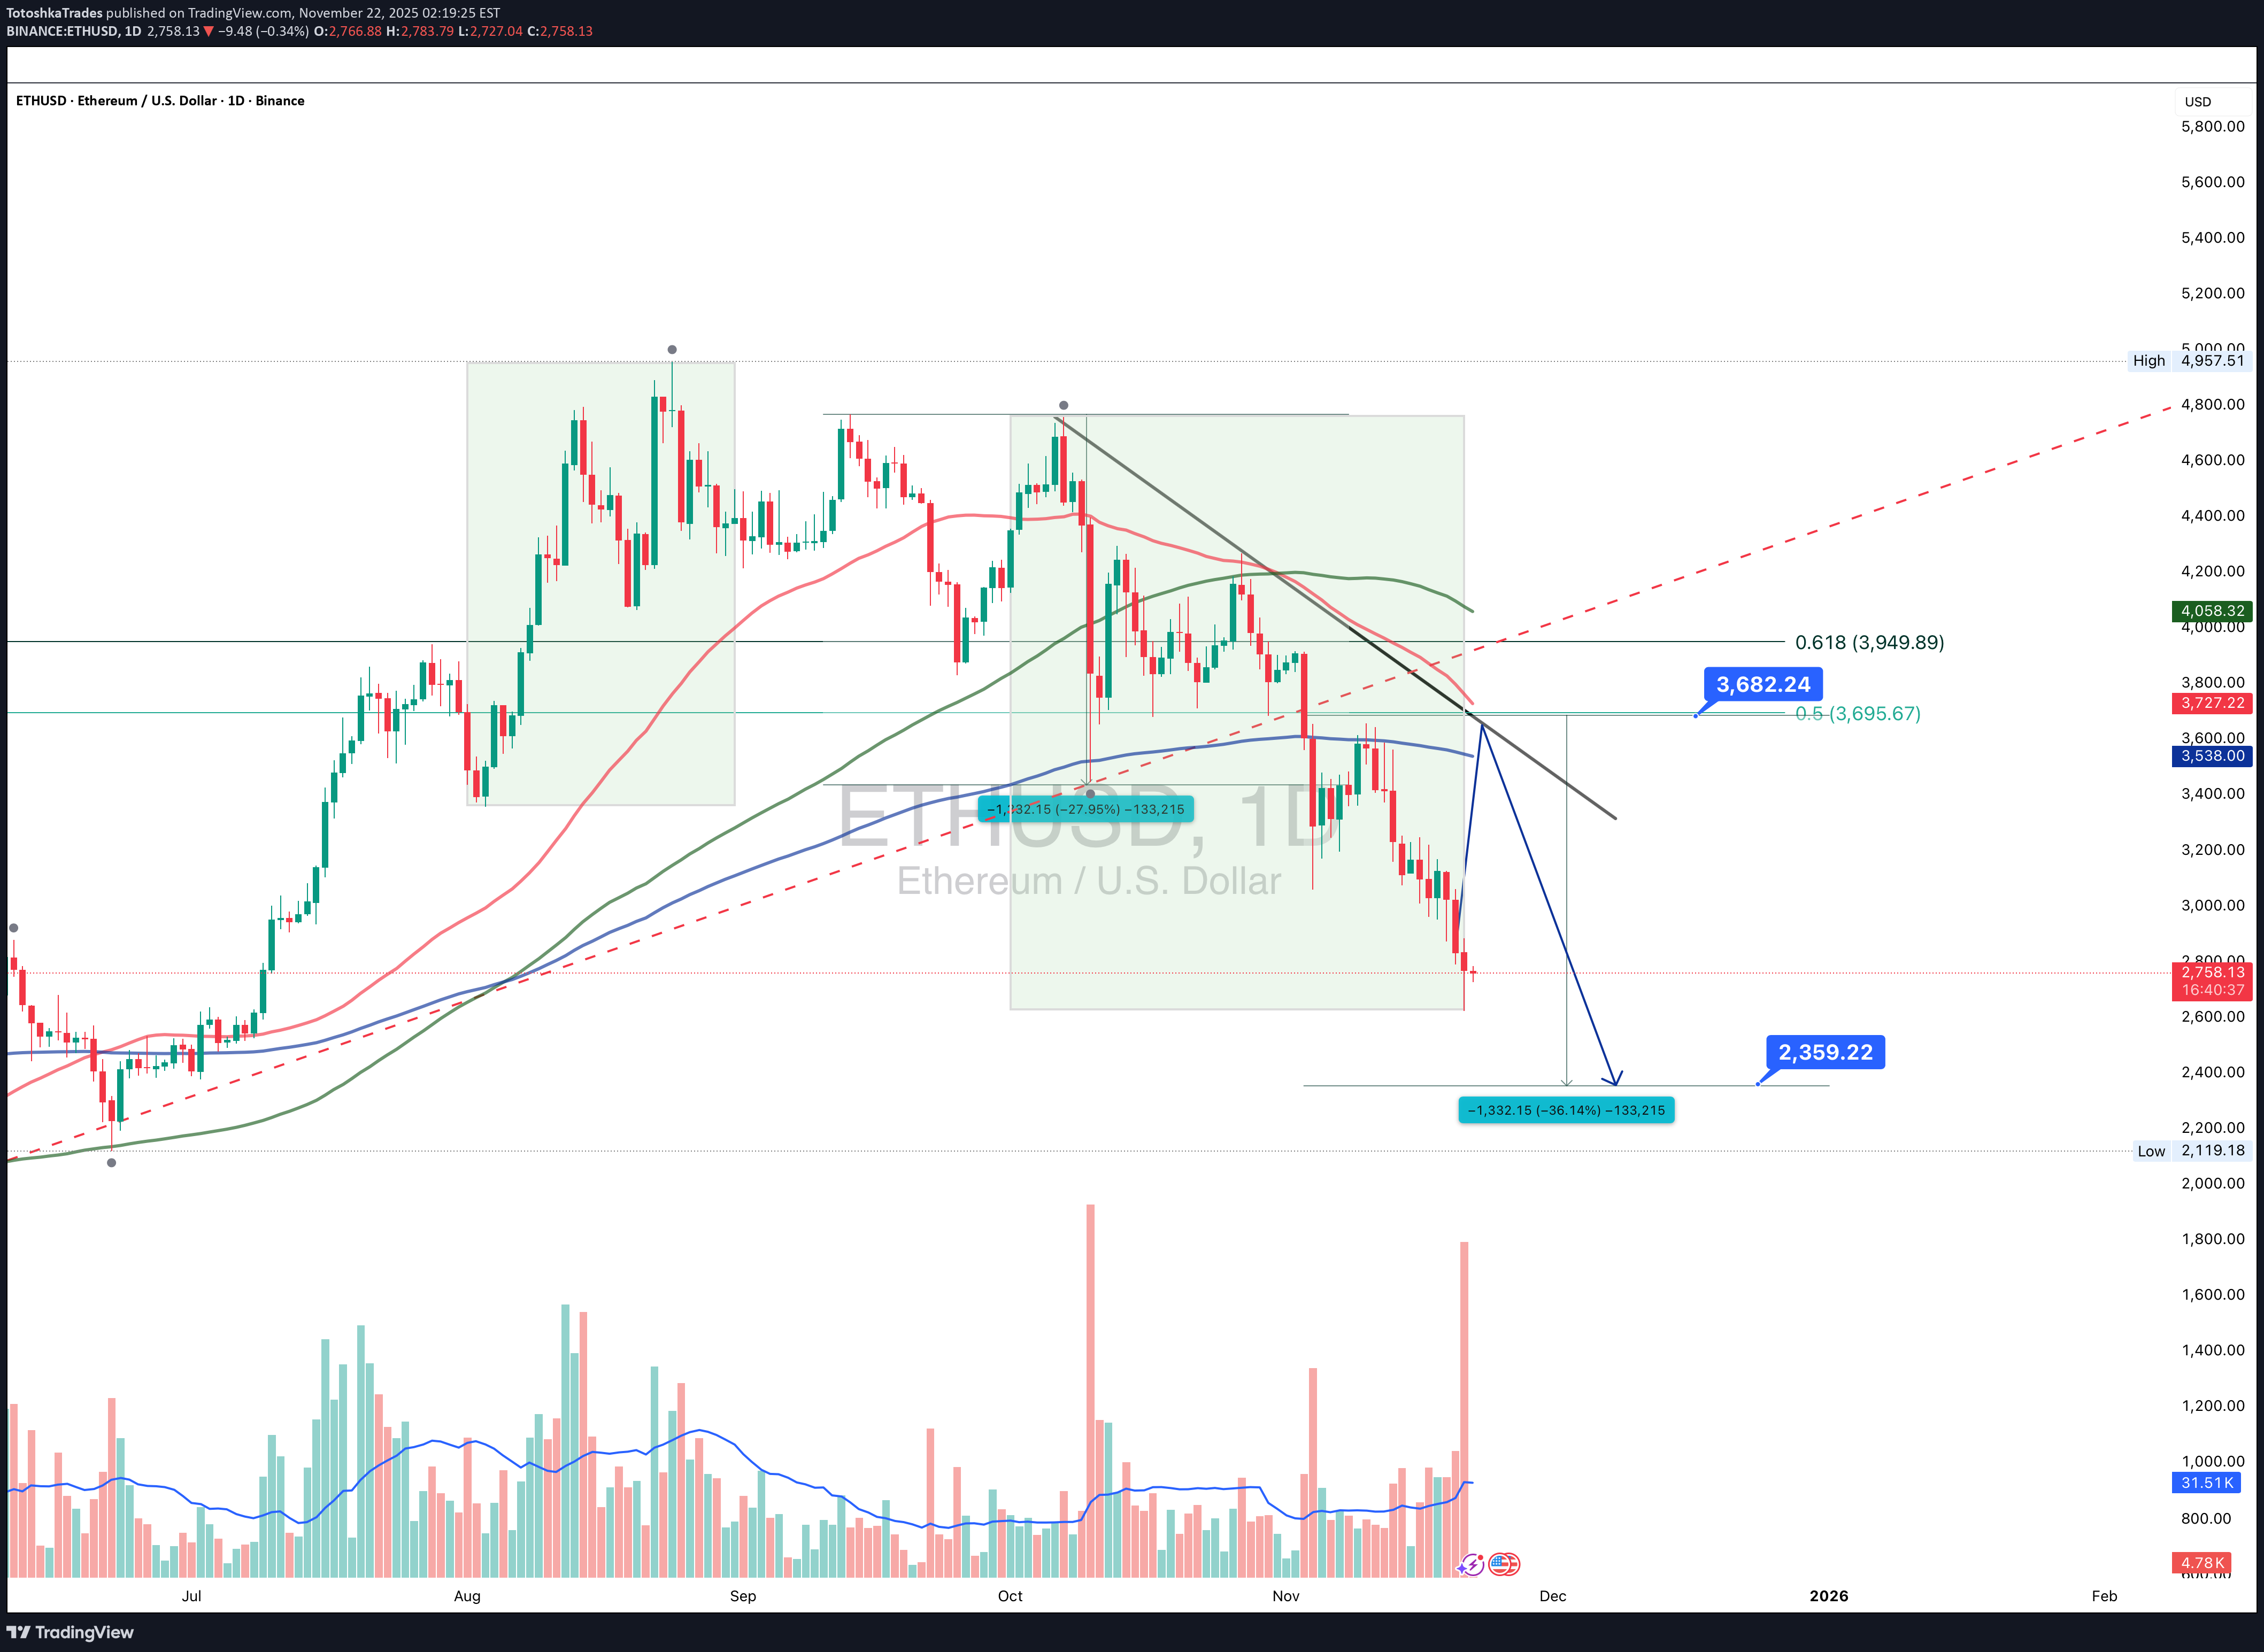
Ethereum continues to trade within a clear bearish structure: after breaking below key daily moving averages, the decline accelerated, pushing the price into the 2720–2800 zone an area that previously acted as a short-term reversal cluster. The trendline from the recent top is broken, and a retest of the 3600–3700 resistance (0.5–0.618 Fib) remains the key scenario before any continuation of the downtrend. Only a confirmed breakout above 3700 would shift the structure back to bullish. A deeper correction target sits around 2360–2400, where symmetry projections and previous accumulation zones converge. Fundamental snapshot (Nov 22): network activity is stable, but downward pressure persists due to lower transaction fees and reduced validator revenue. Capital inflows remain weak, and ETH’s dominance continues to erode against L2 networks and alternative L1s. The market is waiting for strong catalysts such as real-world asset tokenization and institutional adoption. In the short term, sentiment leans neutral-to-bearish, supporting the probability of a move toward 2360–2400. As long as ETH remains below 3600–3700, the bearish scenario holds priority. A breakout above 3700 would flip the structure, but current price action still favors continuation of the correction. Ethereum is full of surprises - yet price levels tend to be much more disciplined than traders.
TotoshkaTrades
بیت کوین در آستانه سقوط یا جهش بزرگ؟ راز حمایت کلیدی MA100 چیست؟
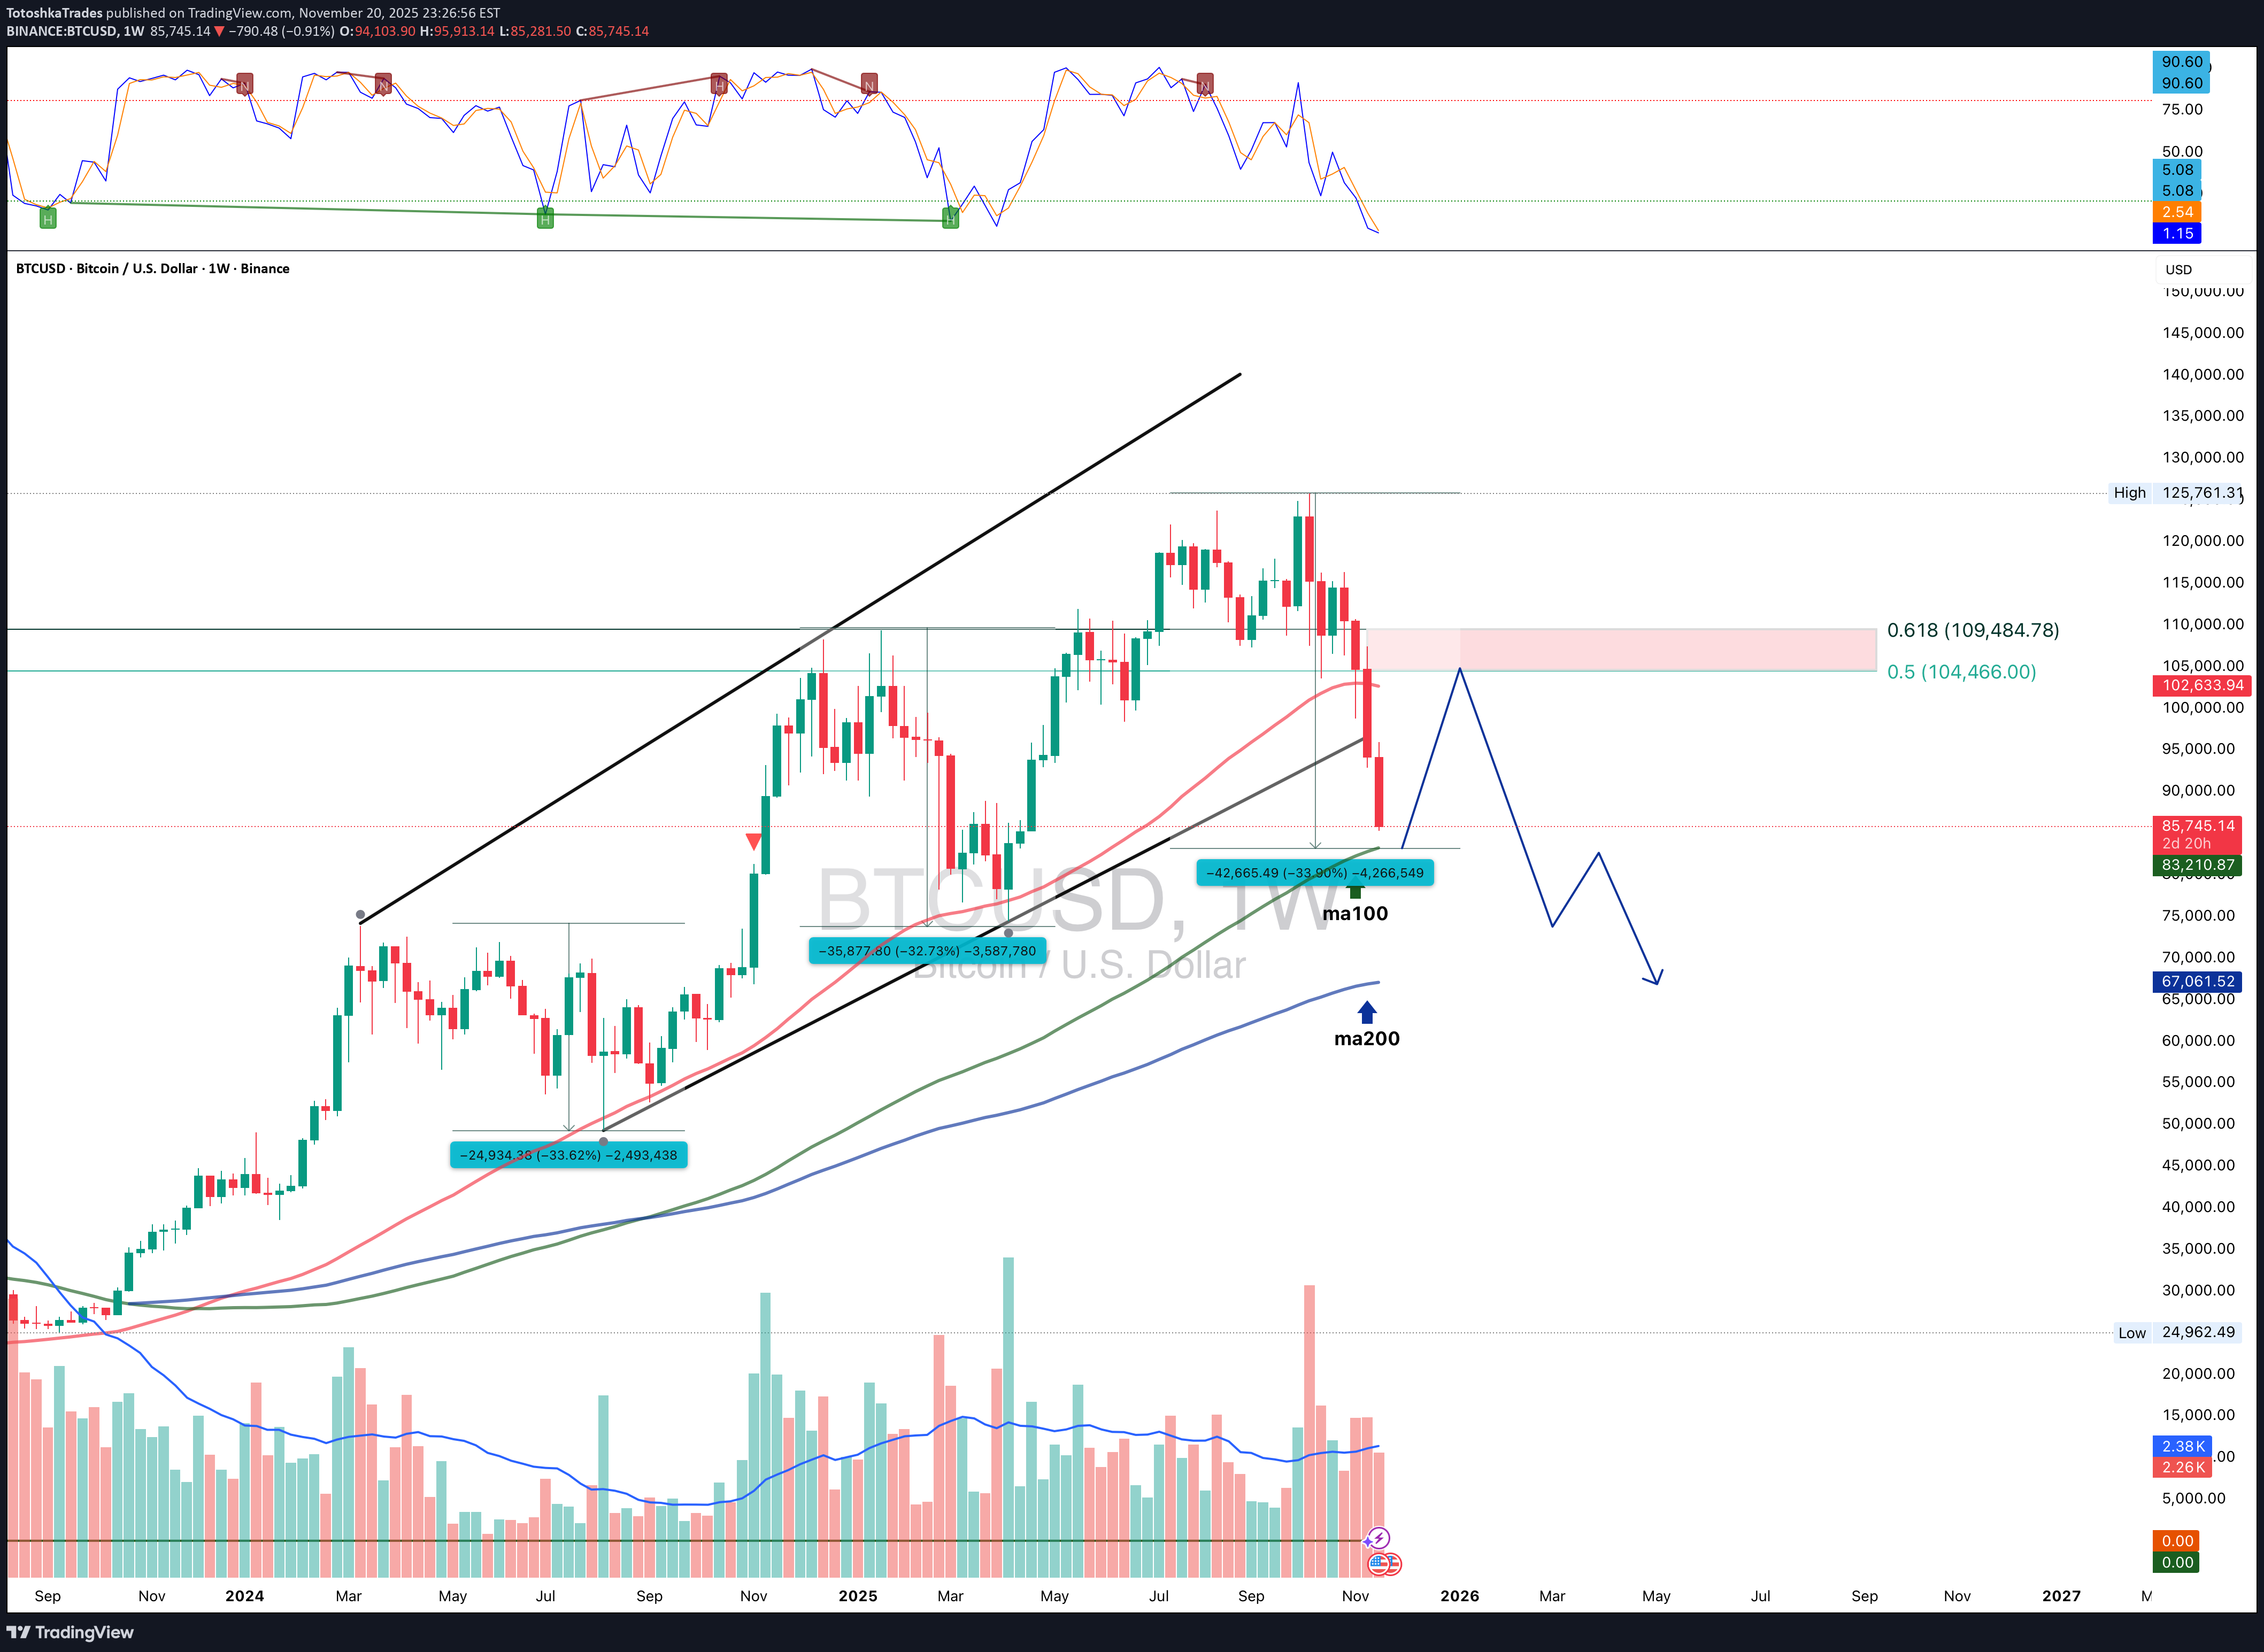
Bitcoin trades in the 85,500–86,000 area, moving steadily toward the key weekly MA100 around 83,200 - the primary dynamic support of this cycle and the level where prior corrections have consistently formed bullish reactions. As long as price respects the lower boundary of the rising channel, BTC maintains a controlled corrective structure: liquidity is being taken below local lows, setting up the conditions for a rebound into the major 104–109K supply zone. This area remains the central mid-term target for recovery, aligning with the 0.5–0.618 Fibonacci cluster, the upper boundary of the previous distribution range and the zone of prior large-scale selling. Fundamentally as of November 21, the market is shifting from euphoria into redistribution: ETF and institutional flows have slowed, large holders are taking profits, and a strong dollar alongside elevated real rates is pressuring risk assets. Network strength remains intact - hashrate near all-time highs and miners still expanding capacity - even though their margins are tightening. This is a typical late-stage cycle environment: short-term downside pressure with long-term trend strength preserved. As long as BTC has not yet touched the MA100, the base scenario remains a dip into 83K followed by a rebound toward 104–109K. A breakout above 110K restores bullish continuation, while a loss of 80K accelerates the move toward 70–75K and the weekly MA200. This correction is not the end of the cycle - it’s a cooling phase after an overheated expansion. Bitcoin does what it always does: terrifies everyone near MA100, then moves exactly when most have given up waiting.
TotoshkaTrades
تسلا روی 380 تثبیت شد: آیا رسیدن به 530 دلار ممکن است؟
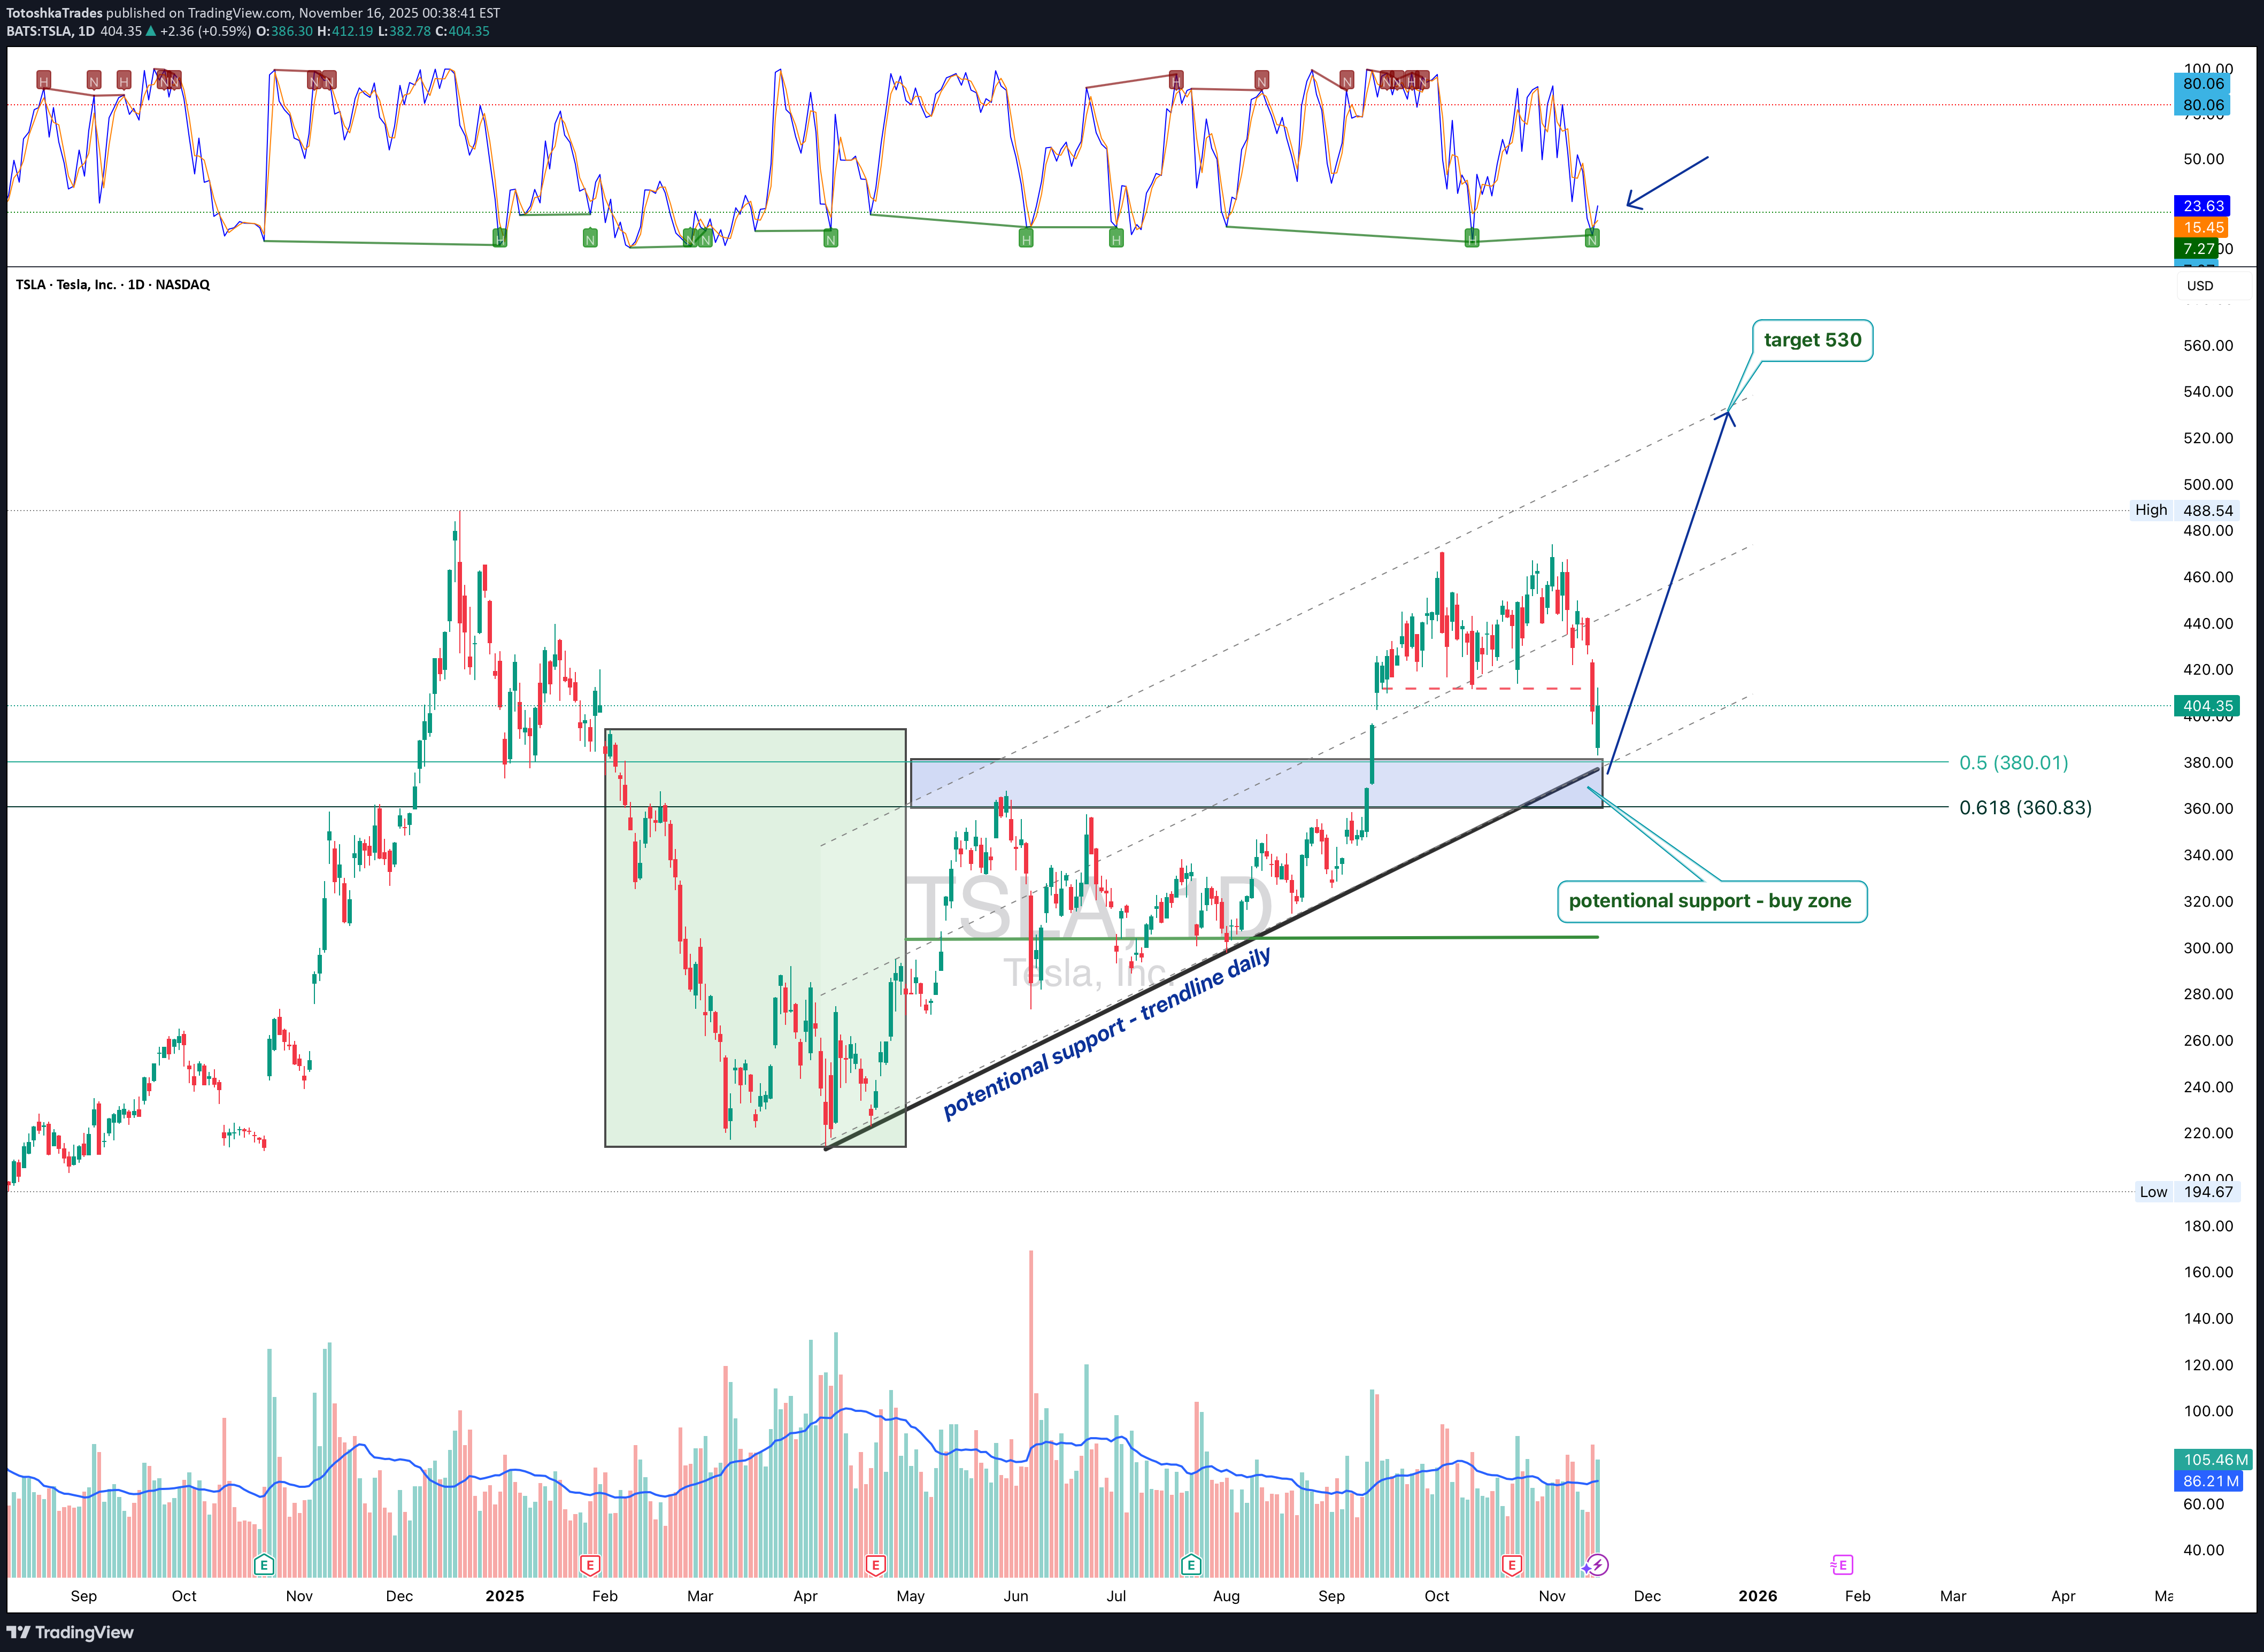
Tesla pulled back precisely into the 380 area, lining up with the 0.5 Fibonacci retracement and the daily trendline, and bounced, confirming 360–380 as a key buy zone. This region combines the prior breakout range, trendline support and fresh accumulation. The next critical step for bulls is a clean breakout and hold above 412 dollars - the main resistance of the recent corrective leg and the local cap for the last swing. A sustained move above 412 unlocks room toward 450 and then the major upside target near 530 within the broader ascending channel. Company: Tesla is the global leader in EVs, battery systems and energy solutions, combining manufacturing, software, autonomous driving and large-scale storage infrastructure. Fundamentally , as of November 16, Tesla is in a transition phase: auto margins are lower than during the previous peak cycle due to price cuts and stronger competition, yet volume growth, scaling of the energy segment and improved factory efficiency help to stabilize profitability. Cash flow remains strong, the balance sheet is solid, energy and services are taking a larger share of total revenue, and long-term expectations are anchored by FSD progress and the robotaxi roadmap. For the market, Tesla is still the flagship brand of the EV sector, and any signs of margin stabilization tend to bring institutional money back quickly. Tactically , as long as price holds above 380 and doesn’t break below 360, the retest-before-continuation scenario remains the base case. A confirmed breakout above 412 becomes the technical trigger toward 450 and then the 530 target along the upper channel. A loss of 360 would shift the picture into a deeper correction, but the current structure still looks more like a pause within an uptrend than a top. Tesla loves to scare everyone with sharp red candles, then casually act like it was just warming up for the next leg.
TotoshkaTrades
بیت کوین در آستانه سقوط جدید؟ تحلیل کلیدی محدوده مقاومت ۱۱۳ هزار دلار
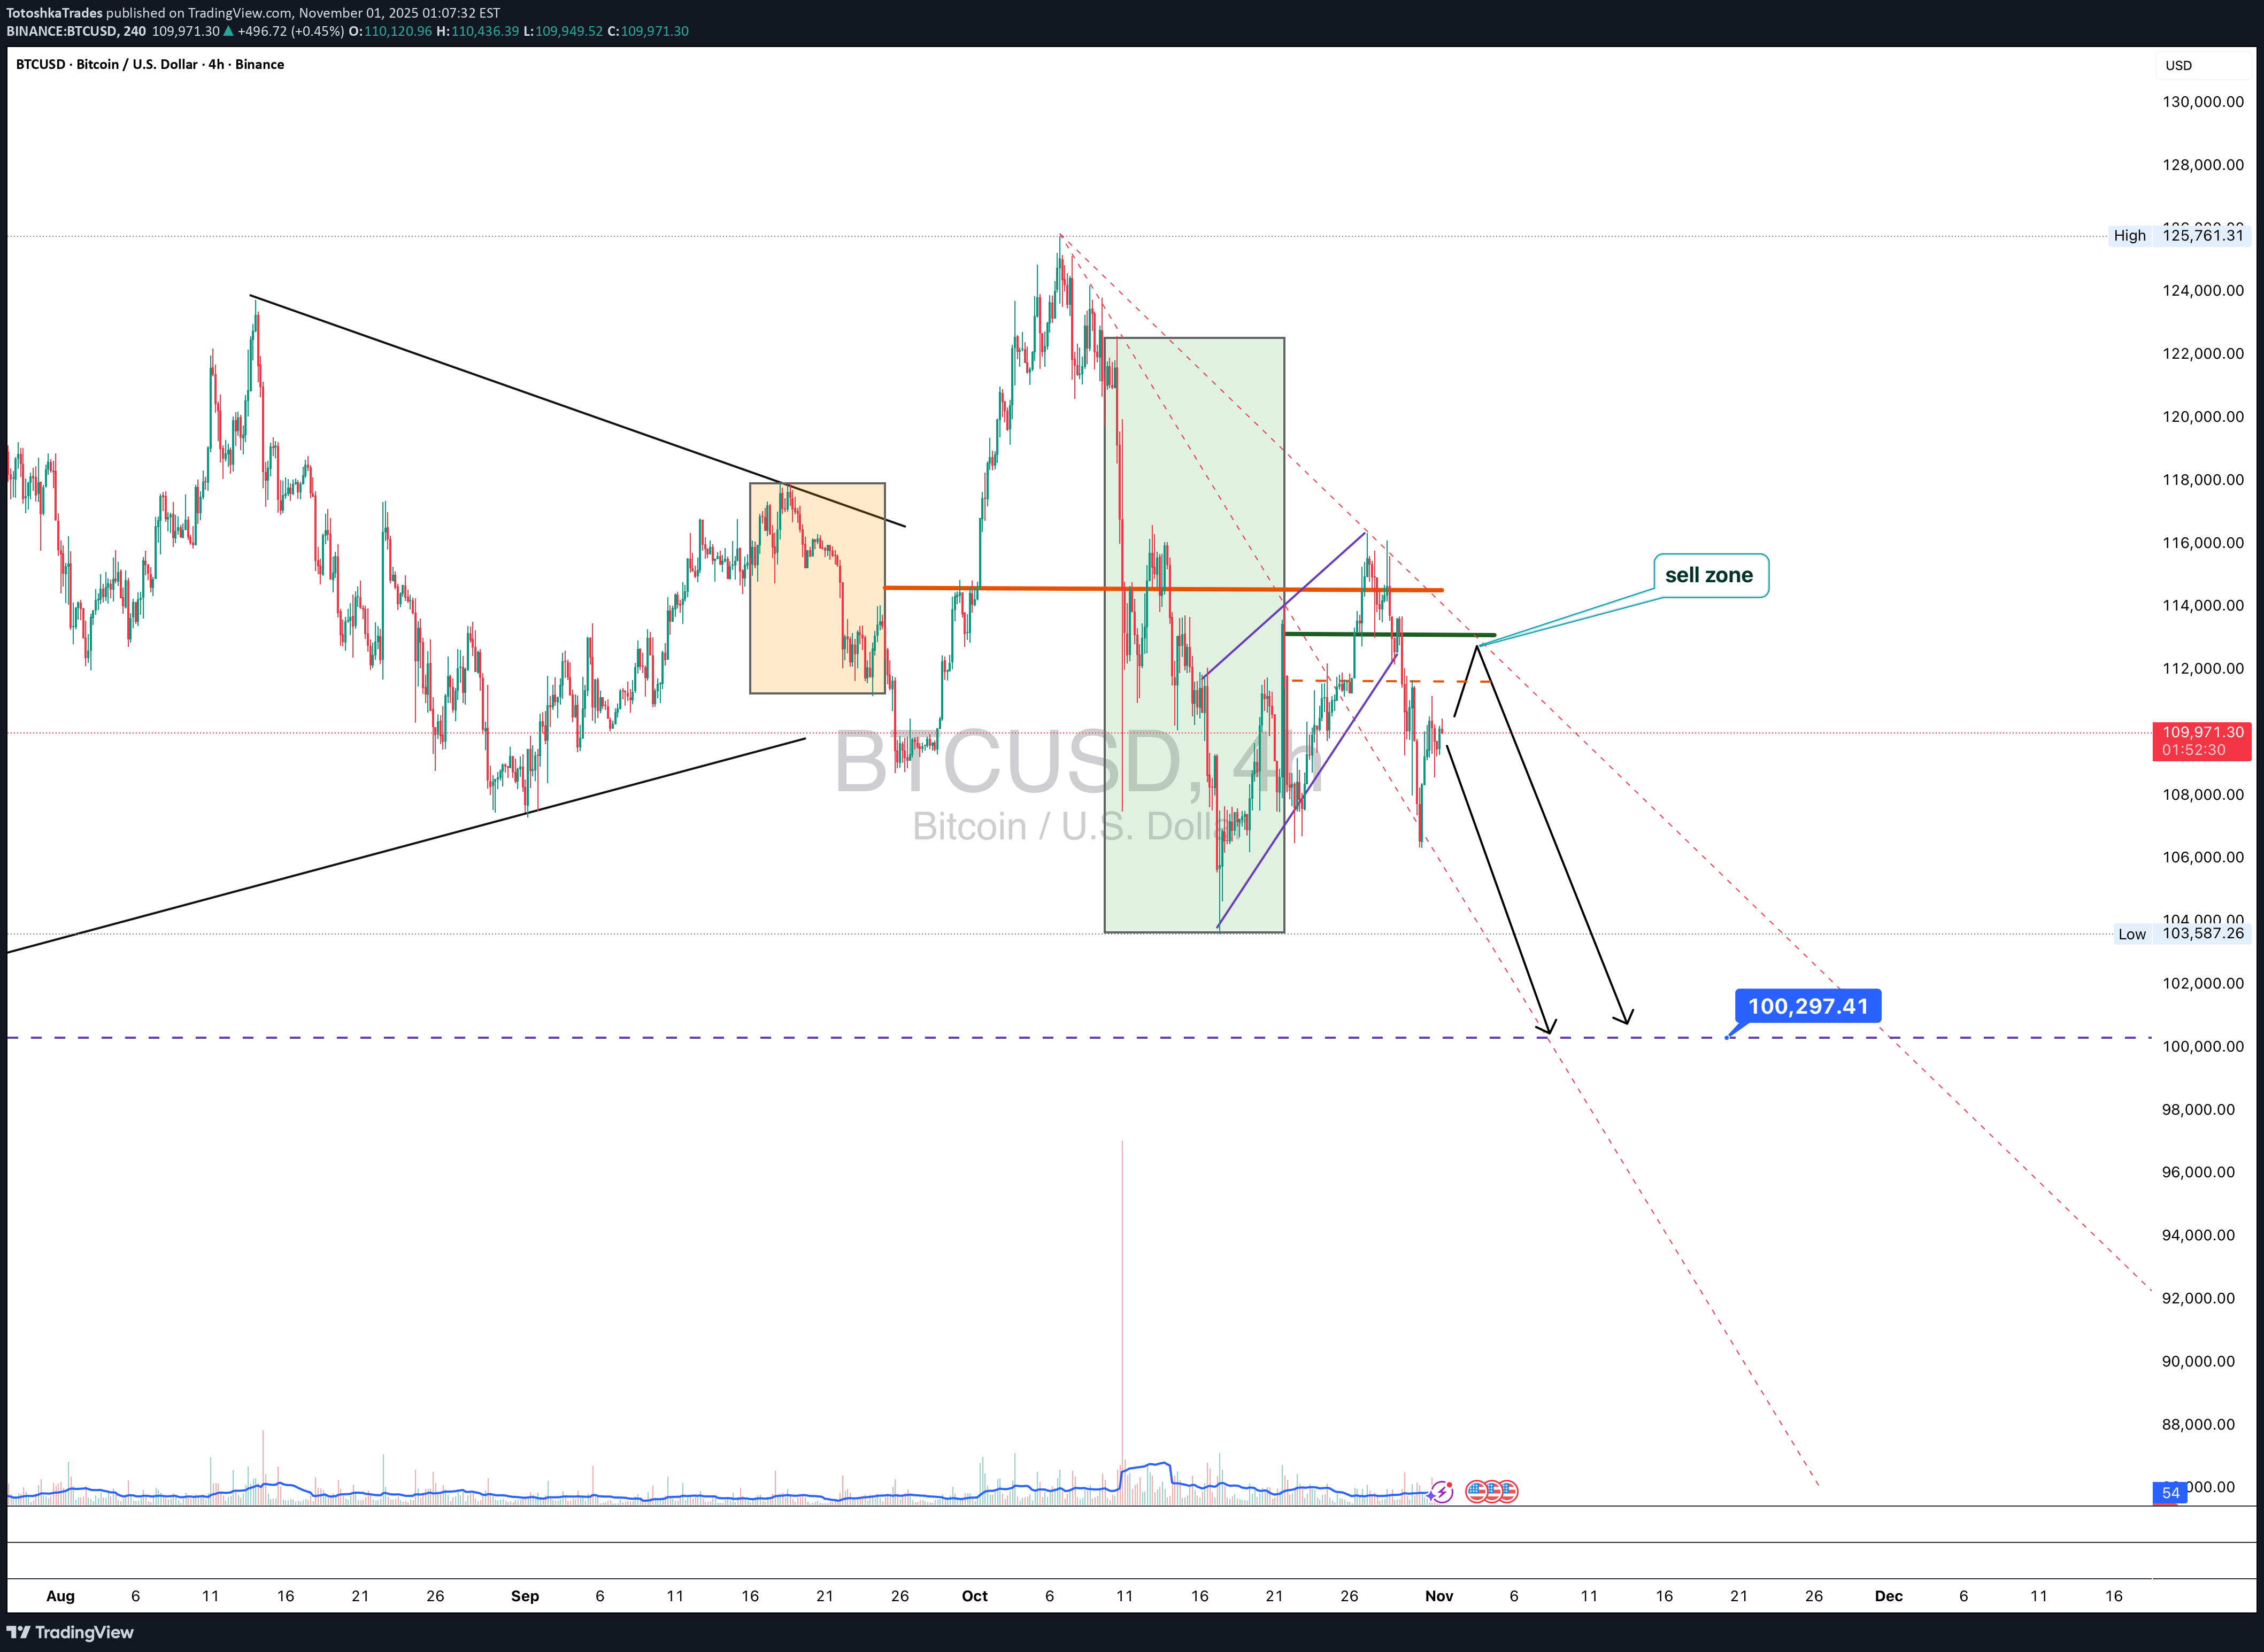
On the 4H chart, Bitcoin is retesting a critical resistance area - the 111K–113K sell zone, where a descending trendline, prior support-turned-resistance, and local volume cluster converge. This confluence makes the current level a potential short-entry area. After failing to sustain above 115K, BTC entered a corrective phase. The recent bounce looks like a retest of the broken structure, and unless bulls reclaim 113K+, the bias remains bearish with a target near 100K–101K, a key liquidity zone. Technically, momentum is fading: – Bearish RSI divergence at recent highs; – Volume contraction on rallies, expansion on drops; – Price structure forming a likely ABC correction, with wave C projection toward 100K. Fundamentally , near-term pressure persists as traders take profits and global risk sentiment cools ahead of potential Fed guidance. However, the macro bull case remains intact - hashrate at all-time highs, growing institutional adoption, and supply tightening continue to underpin long-term support. Tactical plan: short entries near 111K–113K, targets 100K–101K. Invalidation above 113.5K. Even in a bull market, gravity never takes a holiday.#BTC scenario worked out, deal closed at tp
TotoshkaTrades
طلا پس از صعود انفجاری: آیا زمان خنک شدن و اصلاح فرا رسیده است؟
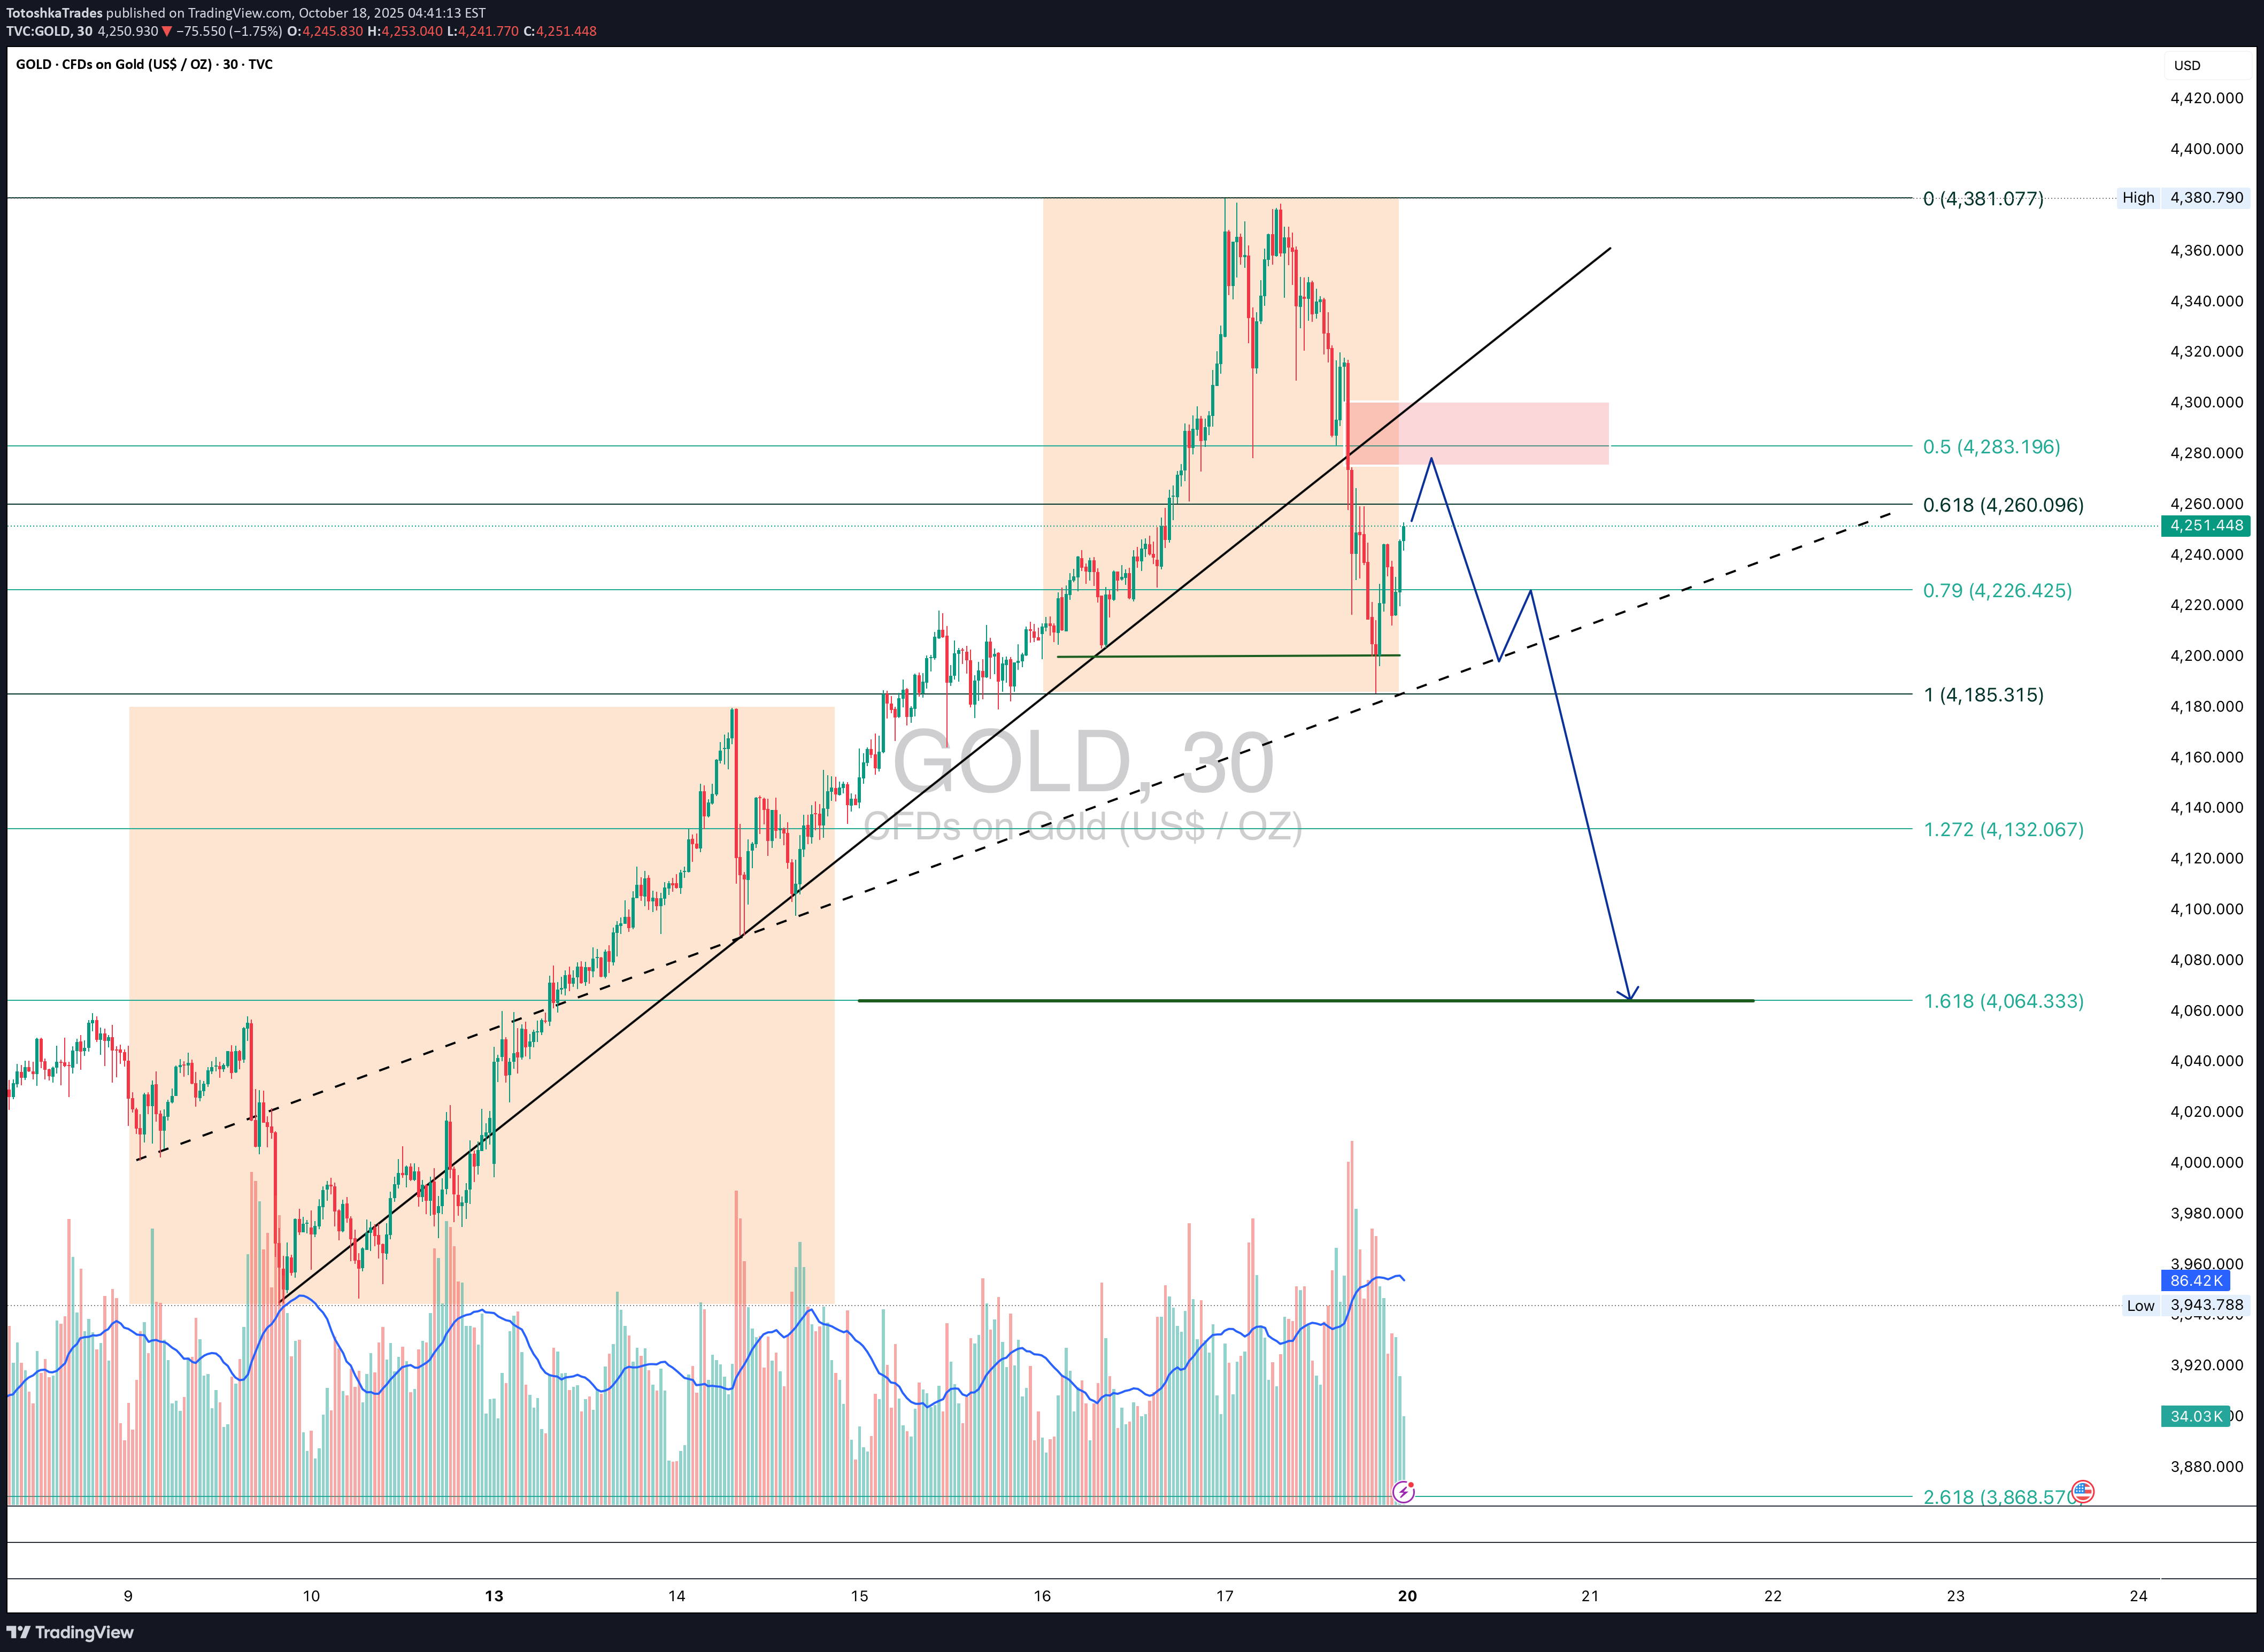
After a sharp rally, gold seems ready for a breather. The chart shows a break of the short-term trendline followed by a retest from below. The price is now hovering near $4250, testing the 0.618 Fibonacci level - a classic resistance area where sellers often step in. If the pullback continues, the next downside targets lie near $4185 and $4064. However, as long as the $4200 support holds, bulls still have a chance to regain control. Fundamentally , gold remains supported by global uncertainty and dovish central banks, but technically, a healthy correction was long overdue. Tactical plan: watch $4260 closely. If sellers hold, the drop could extend. If buyers reclaim the level - bears will have to retreat. Remember: don’t try to catch falling gold - it cuts both ways.
TotoshkaTrades
GOLD 1H - flag breakout confirms bullish momentum
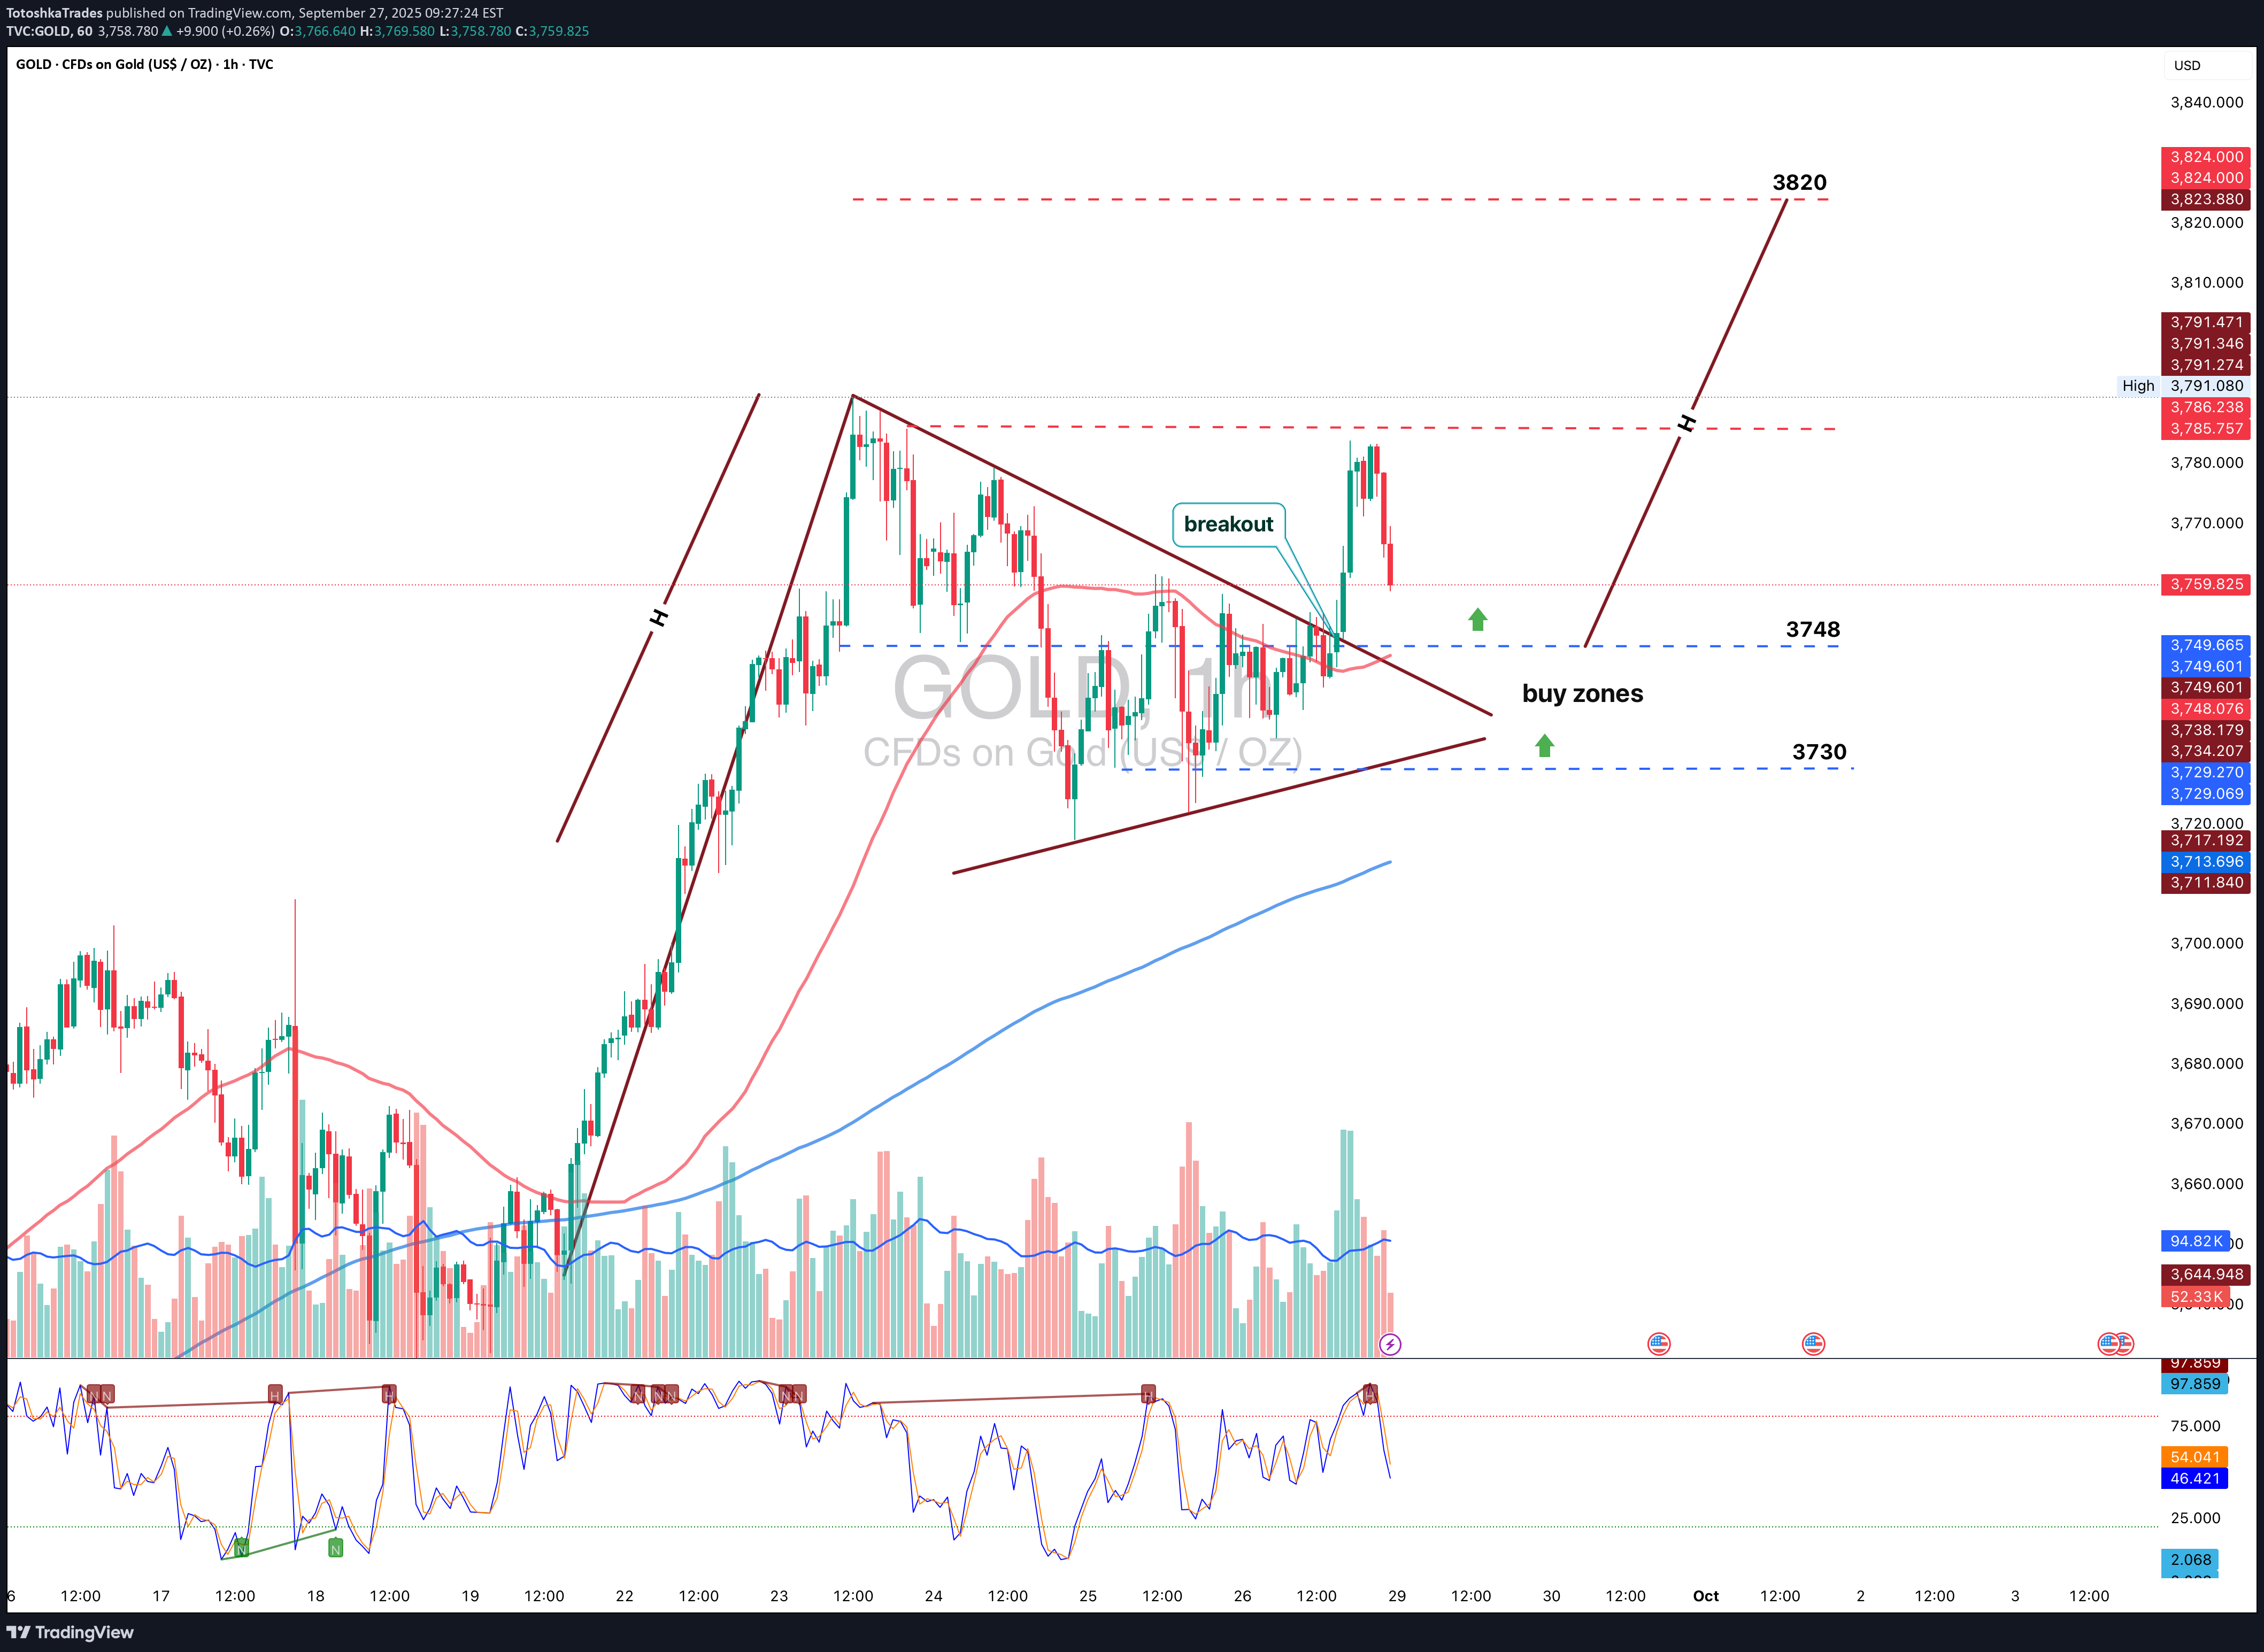
On the 1H chart, gold has completed a bullish flag formation and already broken out to the upside. Key retest levels sit at 3748 and 3730, where buyers may confirm control. With EMA50 and EMA200 holding below, structure remains bullish. RSI has cooled off, supporting a potential continuation move. Fundamentally , dollar weakness and Fed uncertainty sustain safe-haven demand. Tactical plan: watch for price reaction on a possible retest of 3748–3730, as buyer interest here could launch a push toward 3820–3830. The breakout has already happened - now gold needs confirmation to extend the rally.
TotoshkaTrades
Gold – patience versus greed
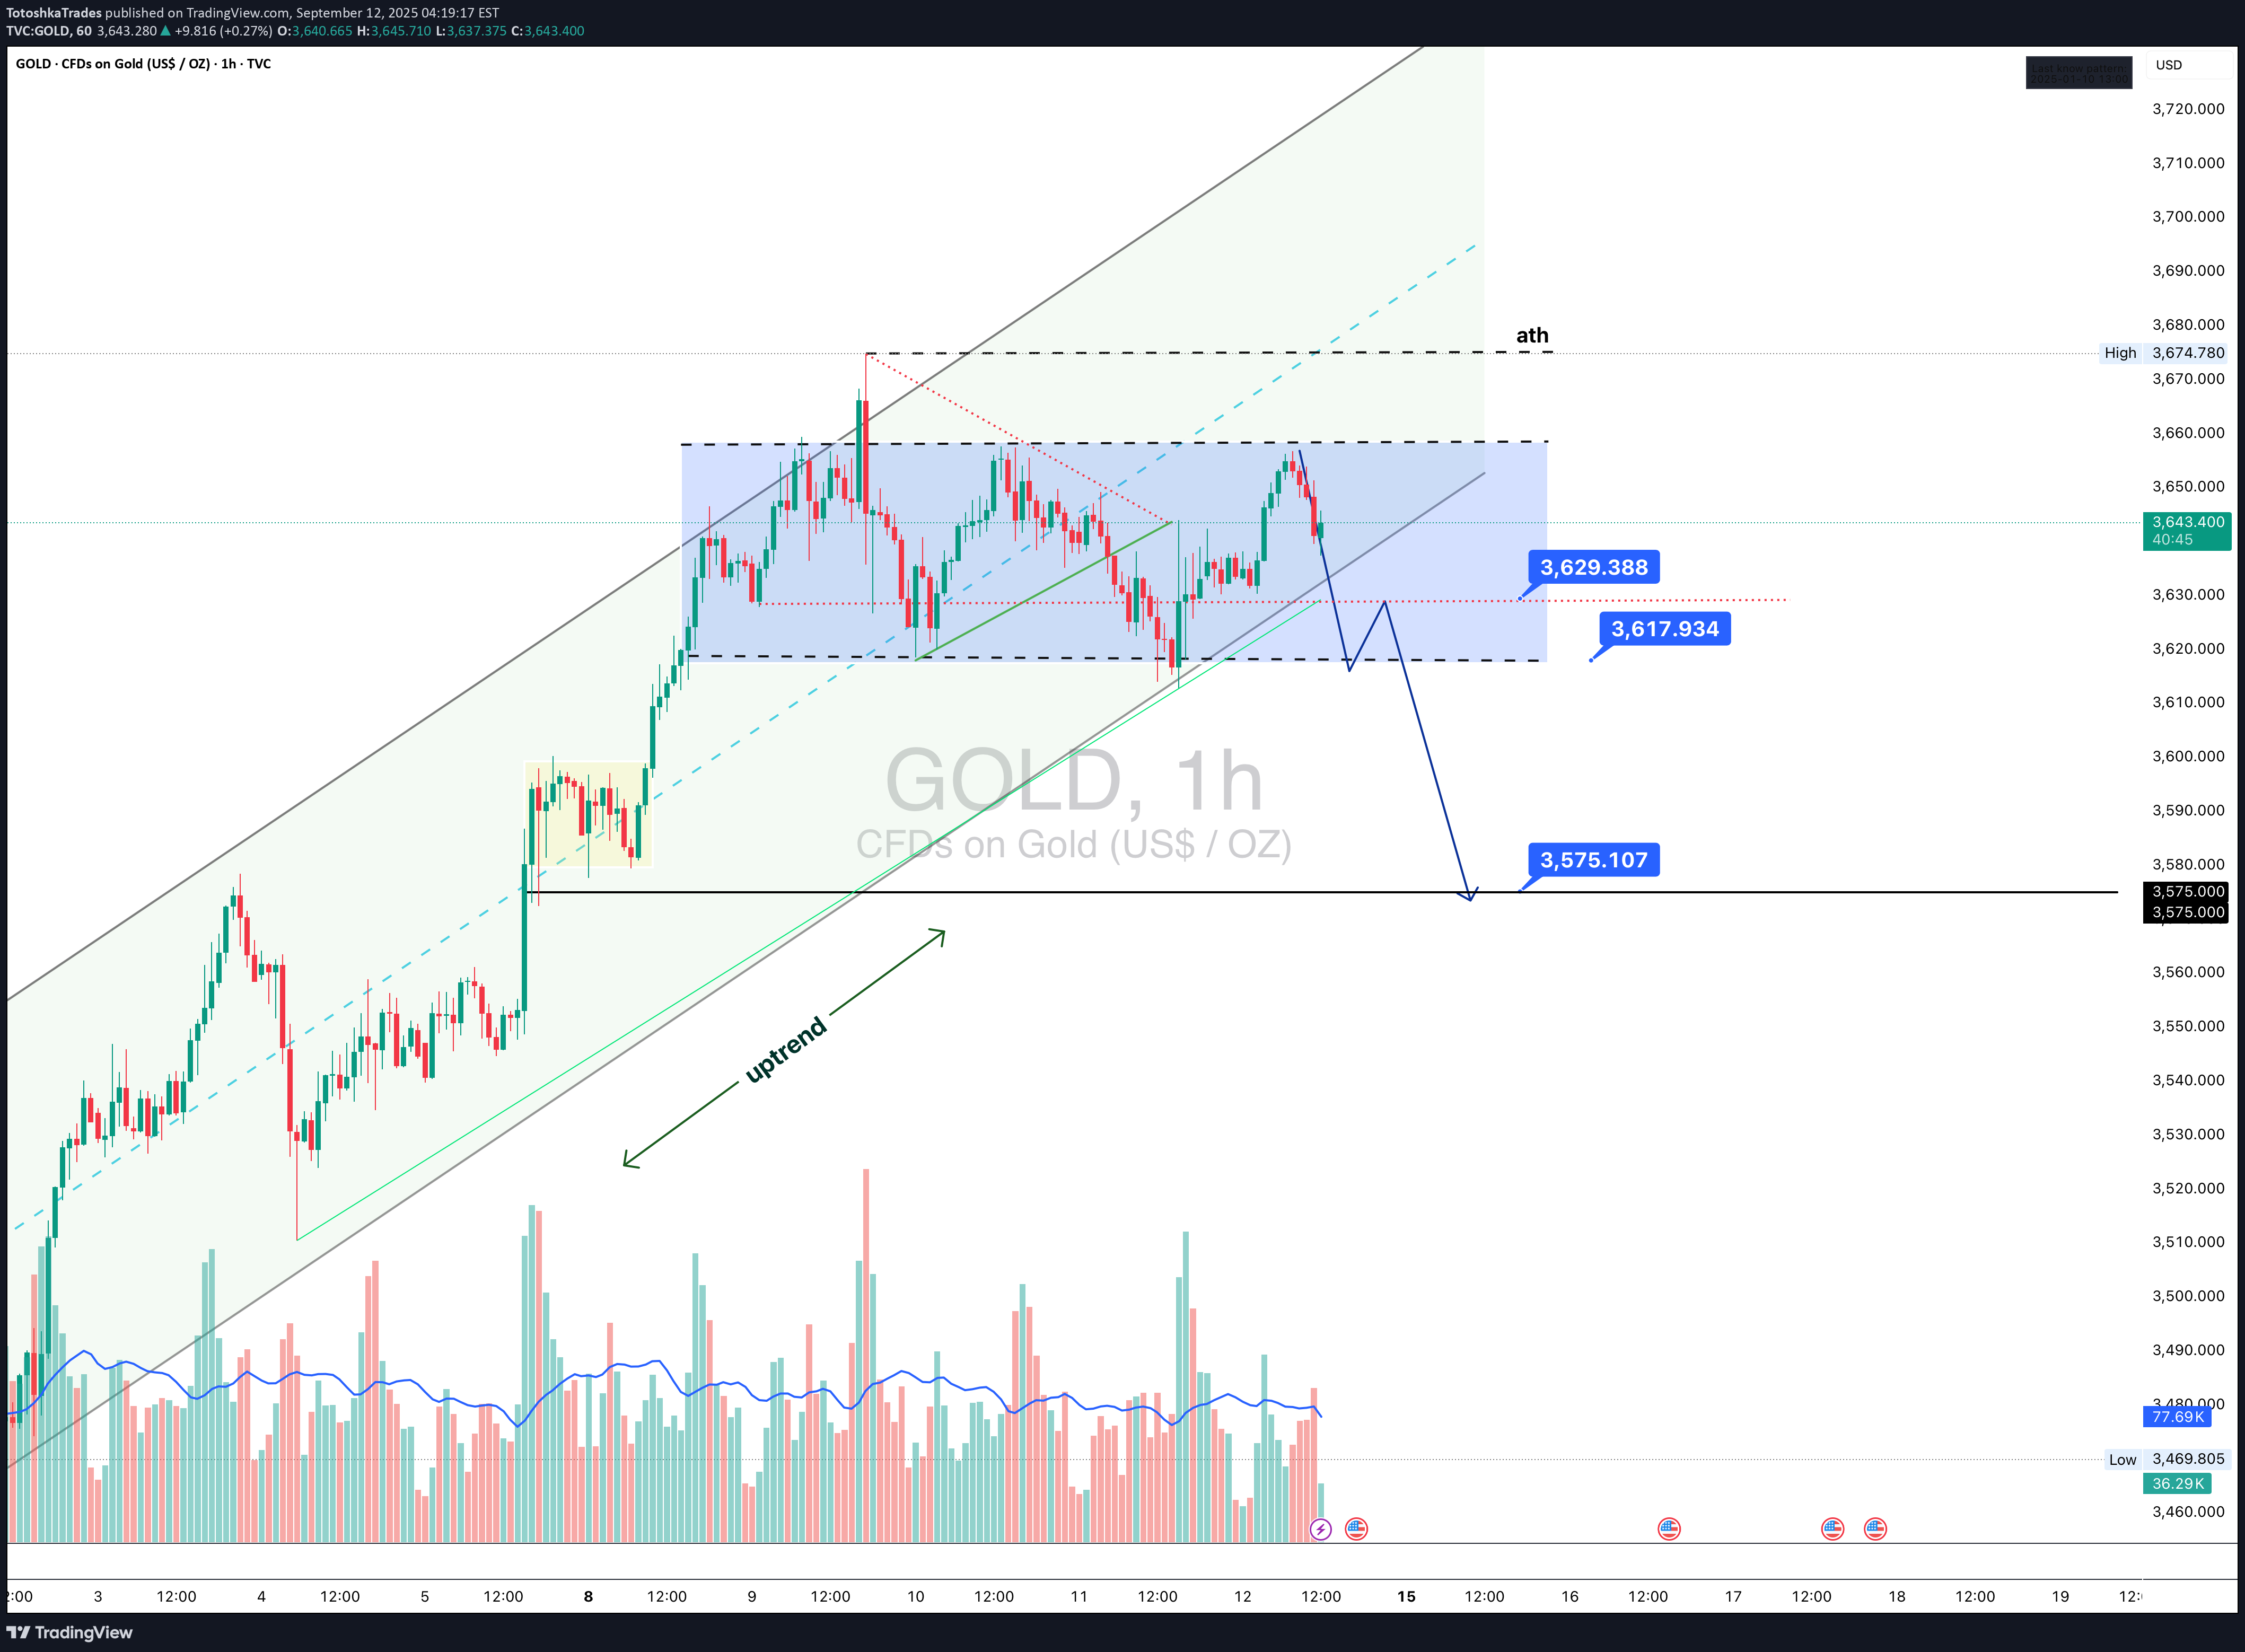
The current rise in gold to the 3640–3650 range resembles a protracted consolidation rather than a confident trend. The price remains within the upward channel, but there is a risk of correction accumulating near the current values. Key levels to watch are 3629 and 3618: a break and consolidation below will open the way to 3575, where important support lies. Within the range, the market is behaving nervously – false breaks are becoming commonplace, which increases uncertainty for those who are rushing into positions. Fundamentally, pressure on gold is being driven by expectations ahead of the Fed meeting and weak dollar statistics: investors remain in “wait-and-see mode.” While the dollar is correcting in a downtrend, gold is receiving support, but without new catalysts, an upward breakout is unlikely. Rather, the market is looking for a balance of forces to determine who will lead - buyers or sellers. The tactical plan boils down to not playing guessing games. In the event of a decline below 3618, confirmation of the bearish scenario with a target of 3575 will appear. If buyers keep the price above 3640, another attempt to storm the highs is likely. At such moments, it is important not to try to outsmart the market, but to wait until it shows the direction itself. Sometimes the best trade is simply not to rush.3629
TotoshkaTrades
DOGE ready to bark again
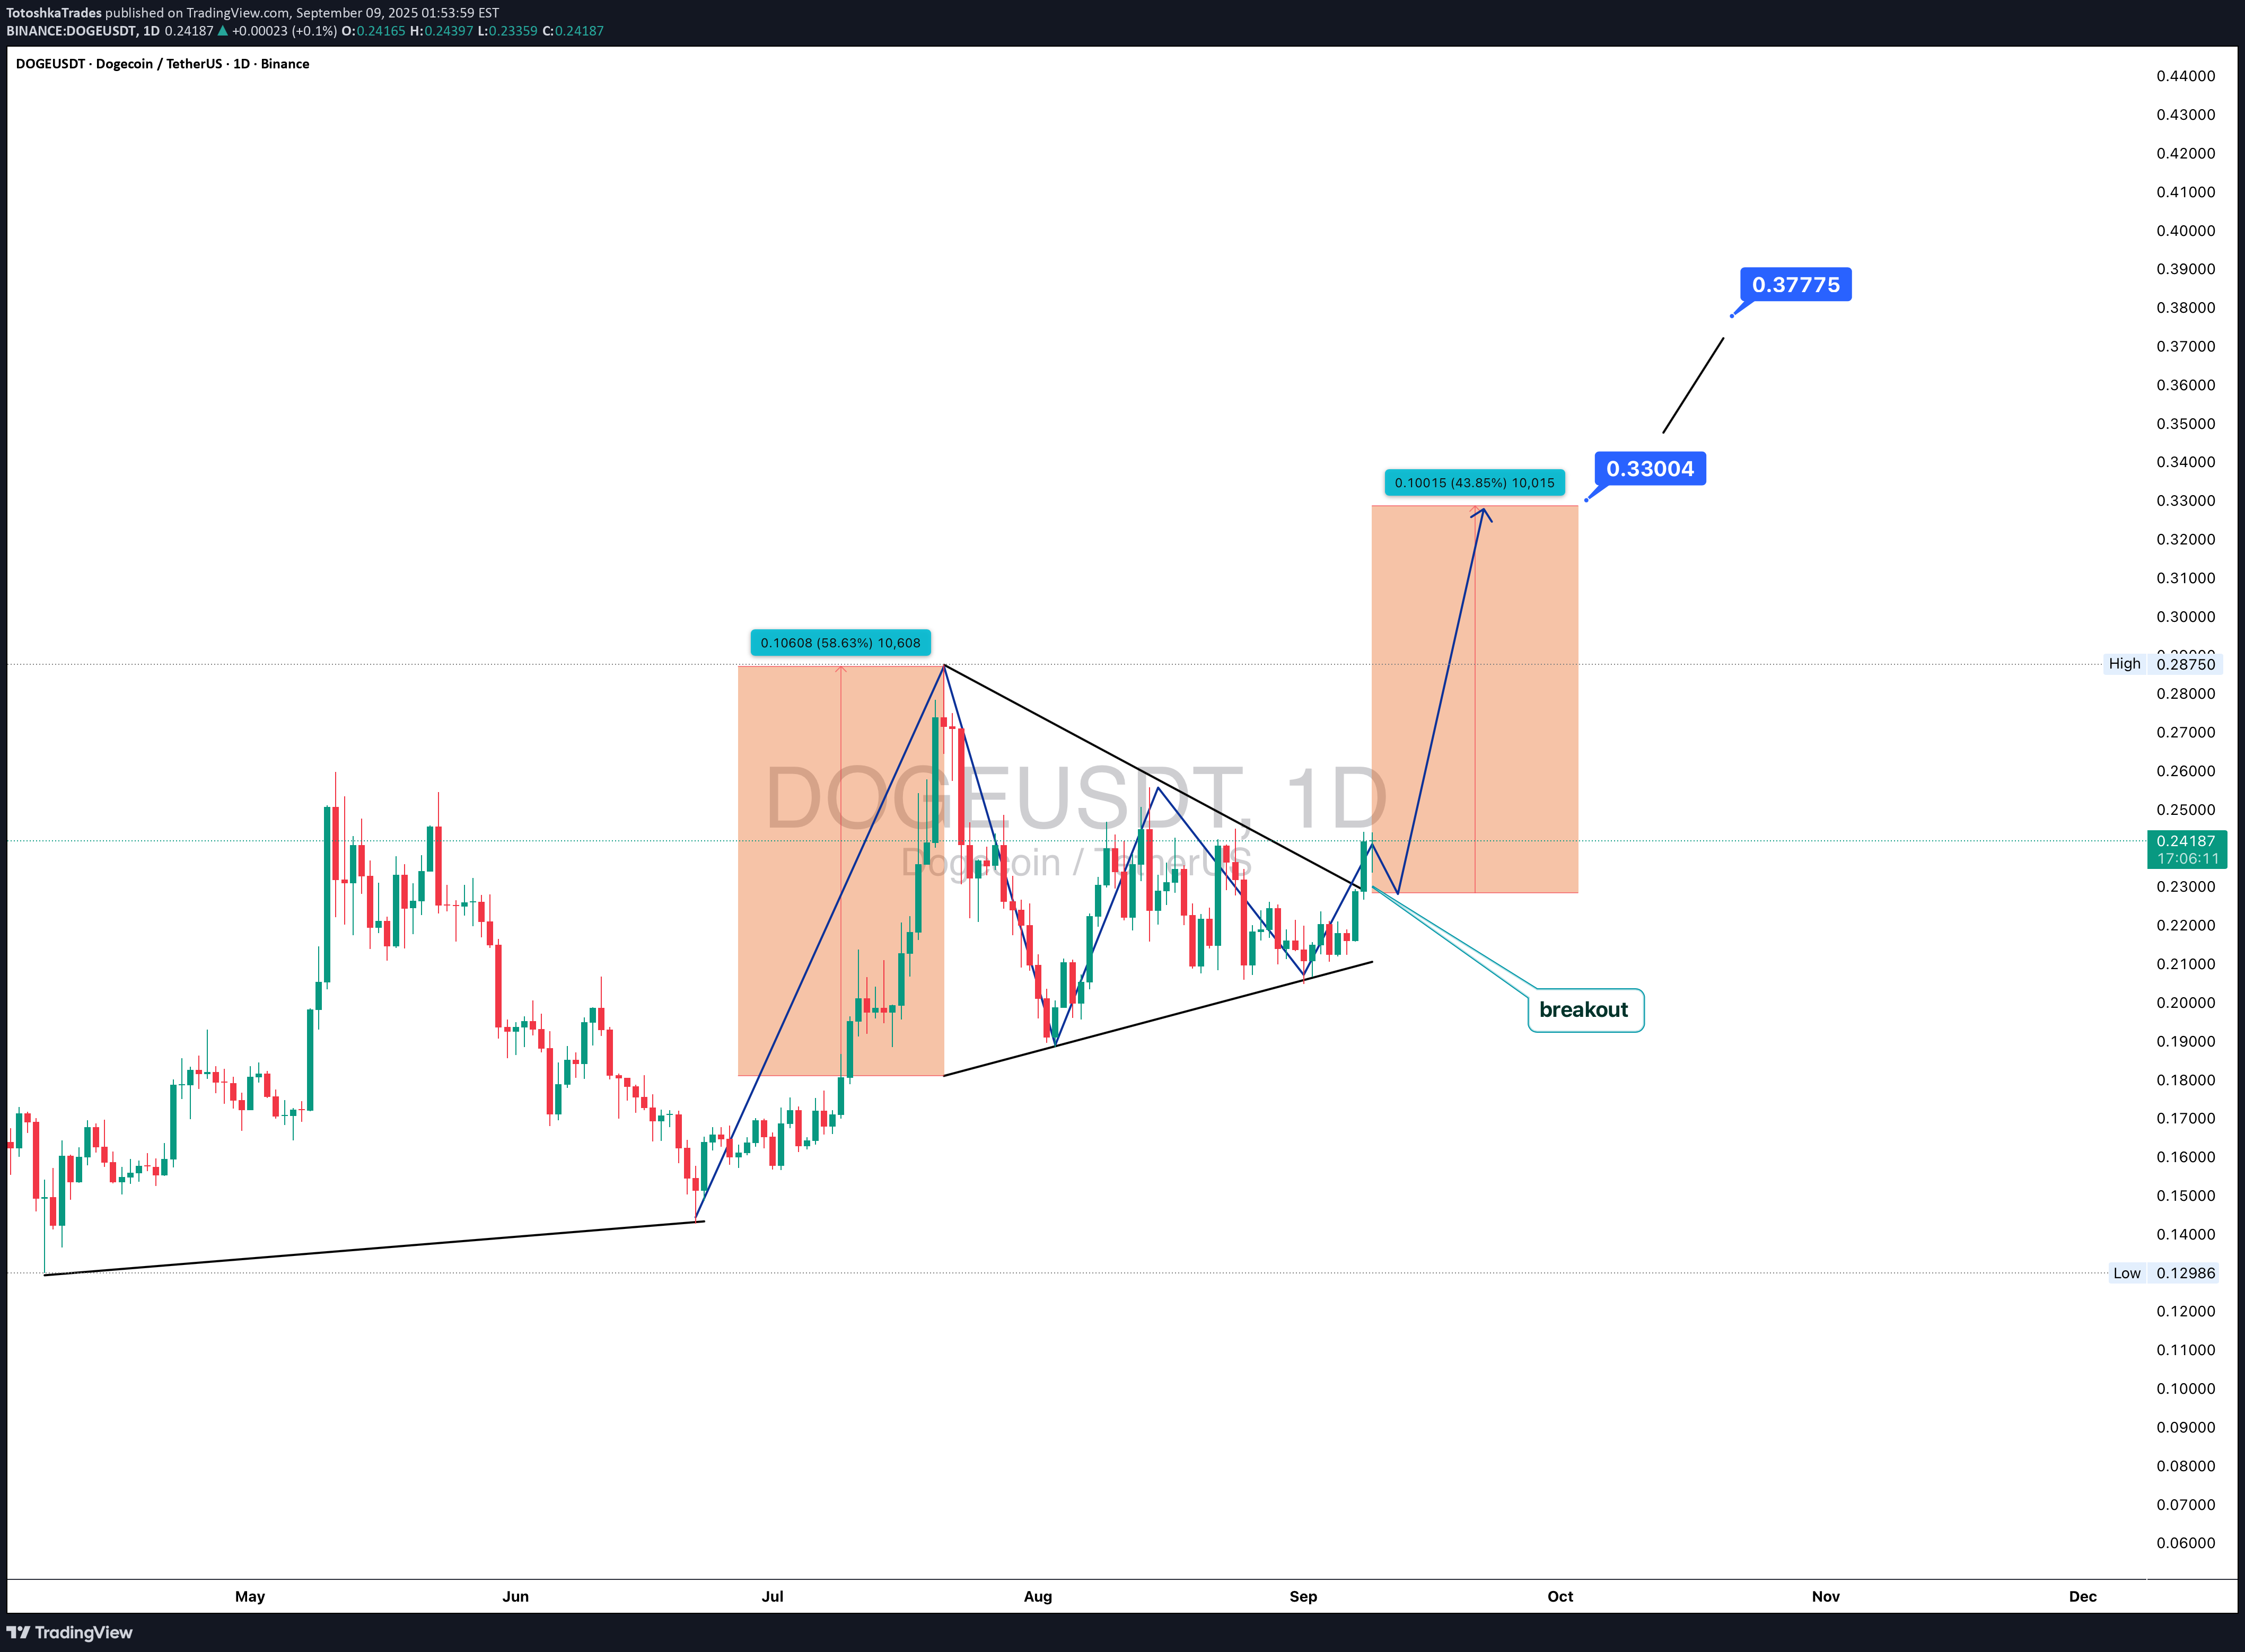
Technically , DOGEUSDT on the daily chart is breaking out of an ascending triangle. After a period of compression, the breakout on volume suggests a potential bullish continuation. The immediate target is $0.3300, and if momentum persists, the move could extend to $0.3777. Key support remains near $0.19–0.20, reinforced by the 200-day moving average. On the fundamental side, DOGE gains attention from speculation about integration into the X (Twitter) ecosystem, with Elon Musk keeping the narrative alive. The broader recovery in the crypto market and renewed interest in altcoins also serve as supportive factors. Tactically, a sustained close above $0.25 would confirm the bullish setup. As long as volumes remain strong, the path toward $0.33 and beyond looks realistic. DOGE is still the classic hype-driven asset - and it seems ready to bark again.
TotoshkaTrades
GOLD: market at a crossroads after the impulse
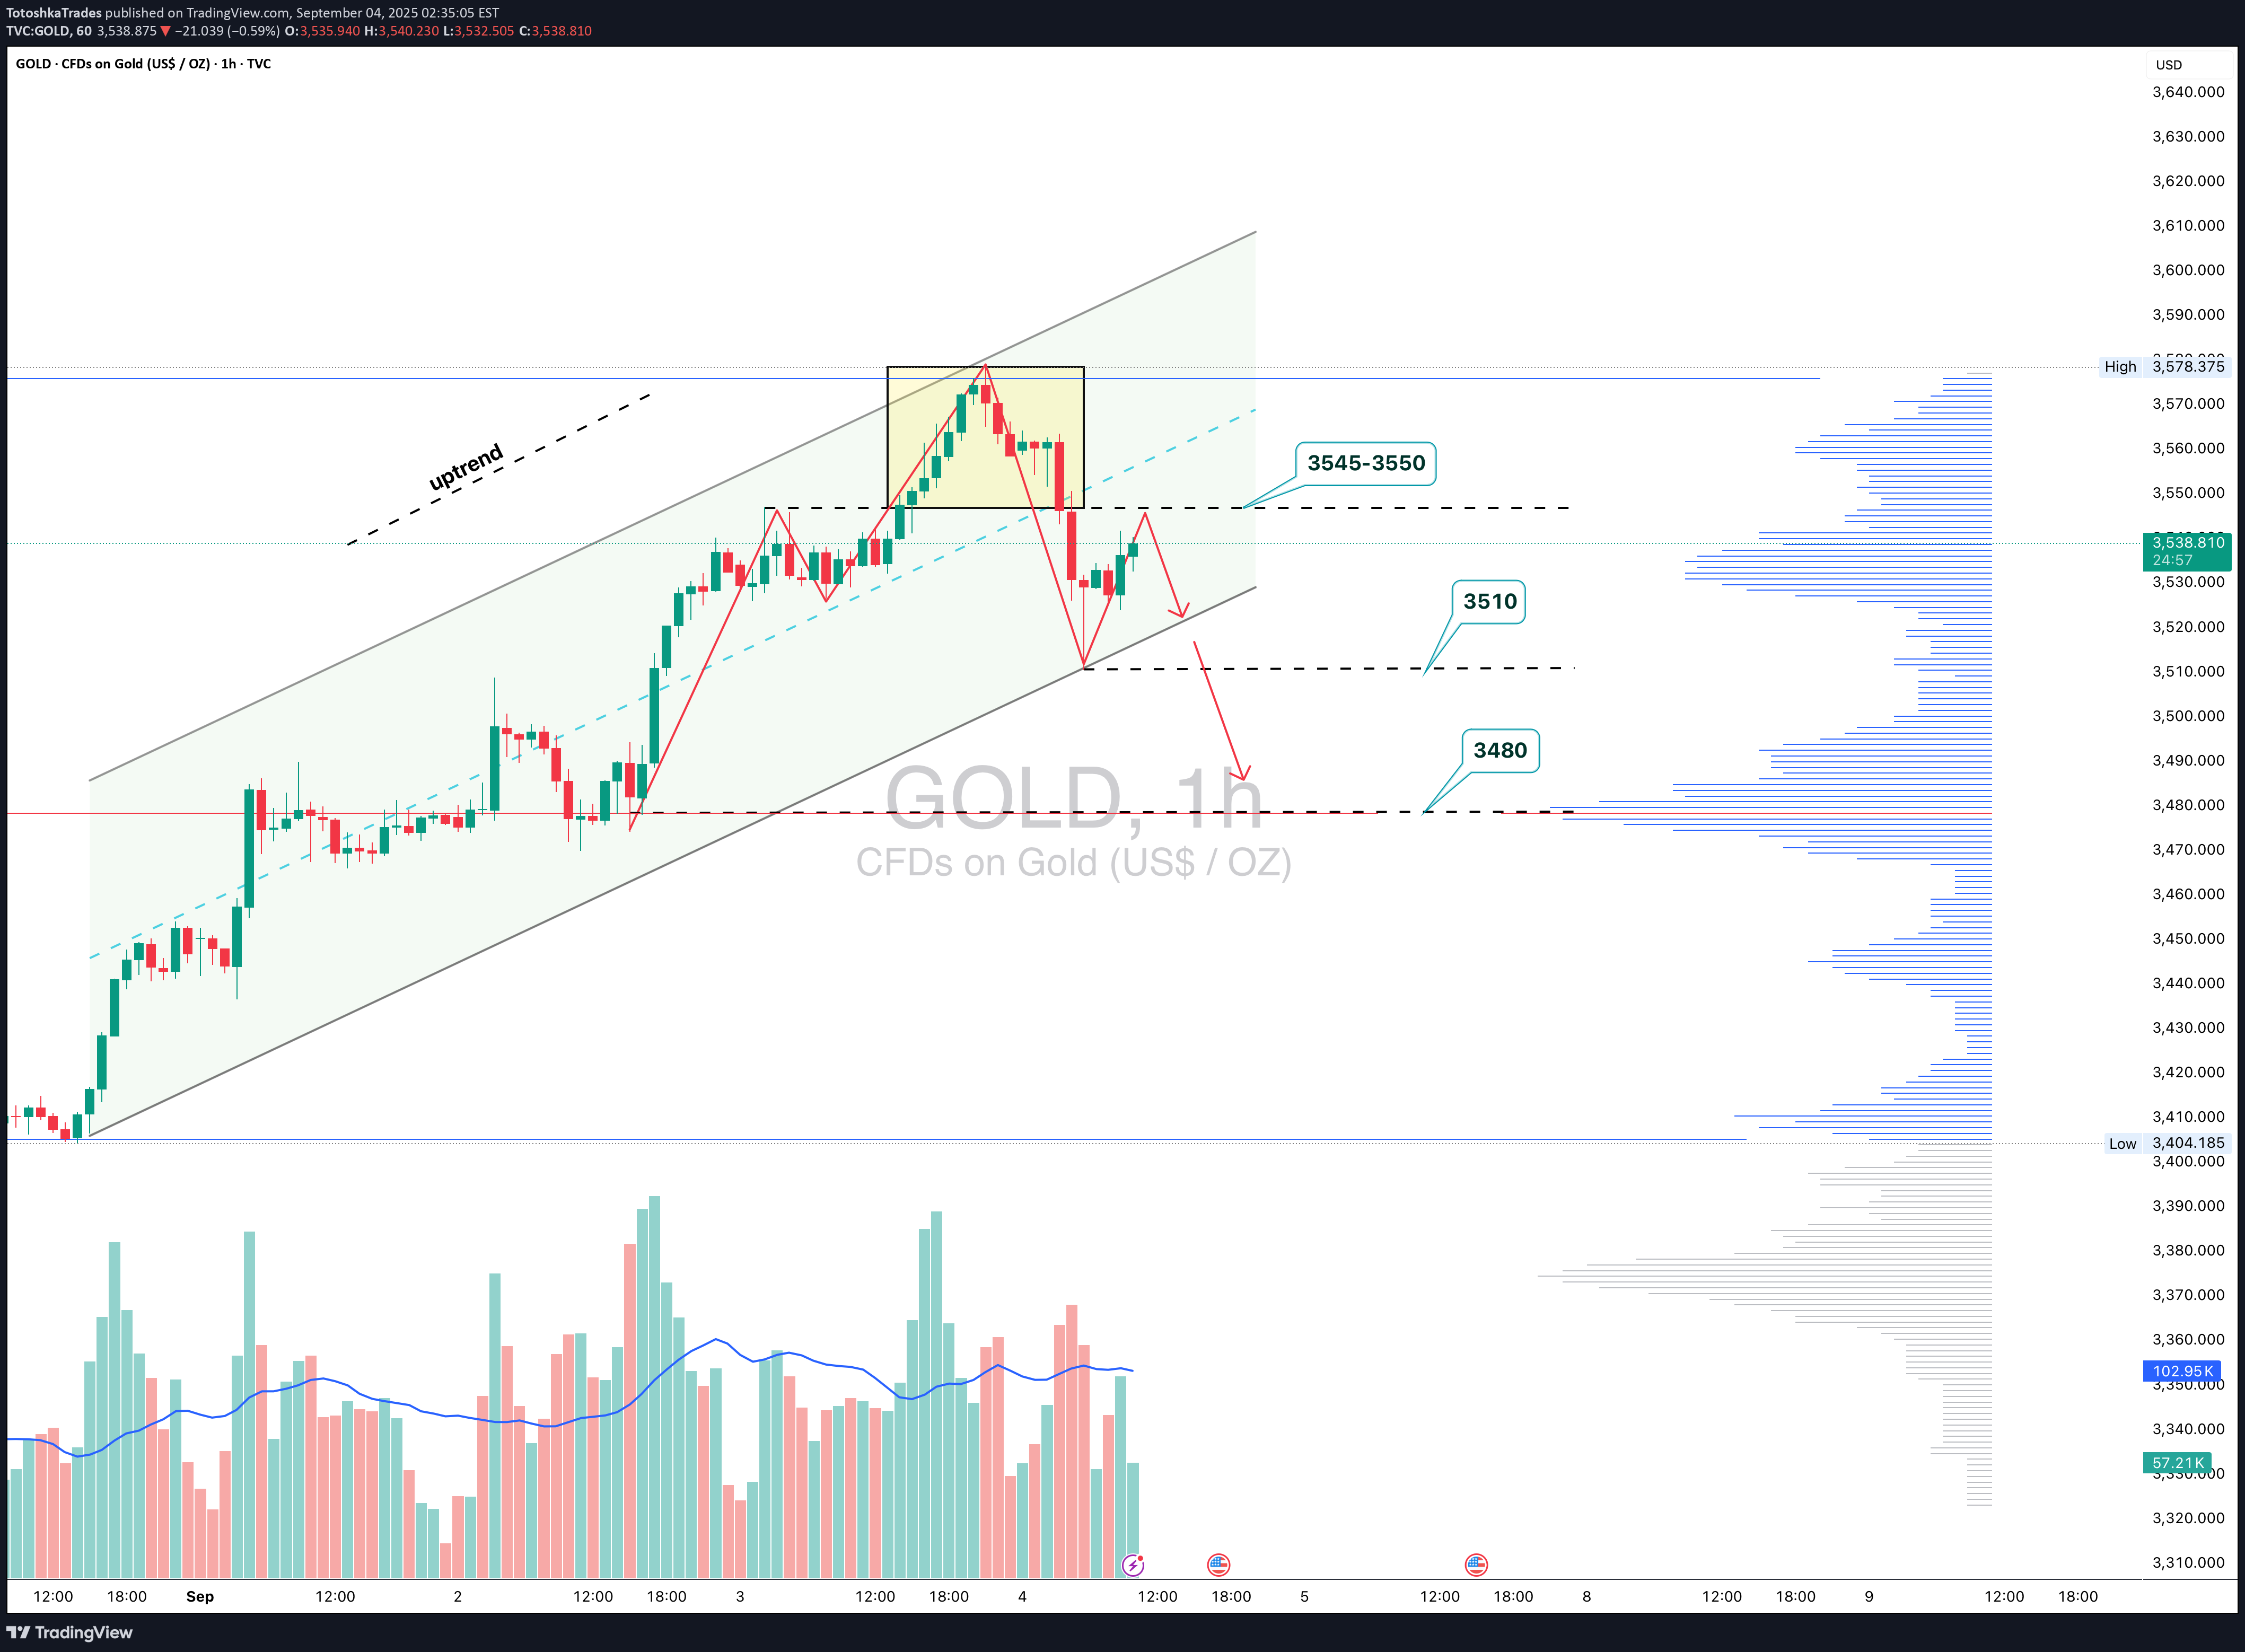
On the 1H chart, gold remains in an uptrend channel, but after testing the 3545–3550 zone, a corrective pullback is possible. The red lines represent a projected head-and-shoulders scenario, but the pattern is not yet confirmed - it remains only a forecast. Key levels to watch: 3510 as initial support and 3480 as a deeper target if price breaks the channel to the downside. As long as price holds above, the broader trend remains bullish. From a fundamental perspective , weak ADP employment data provided short-term support, yet the market reaction was muted since dovish Fed expectations are already priced in. Stronger dollar data or rising Treasury yields could put renewed pressure on gold. Fed commentary in the coming days will be crucial for market direction. Tactical plan: monitor the 3545–3550 zone where sellers may step in. A confirmed break below 3510 opens the way to 3480, but without a completed head-and-shoulders, the move remains speculative. Gold is notorious for punishing premature shorts, so caution is warranted.
TotoshkaTrades
GOLD 4H - all eyes on 3350, death cross at work
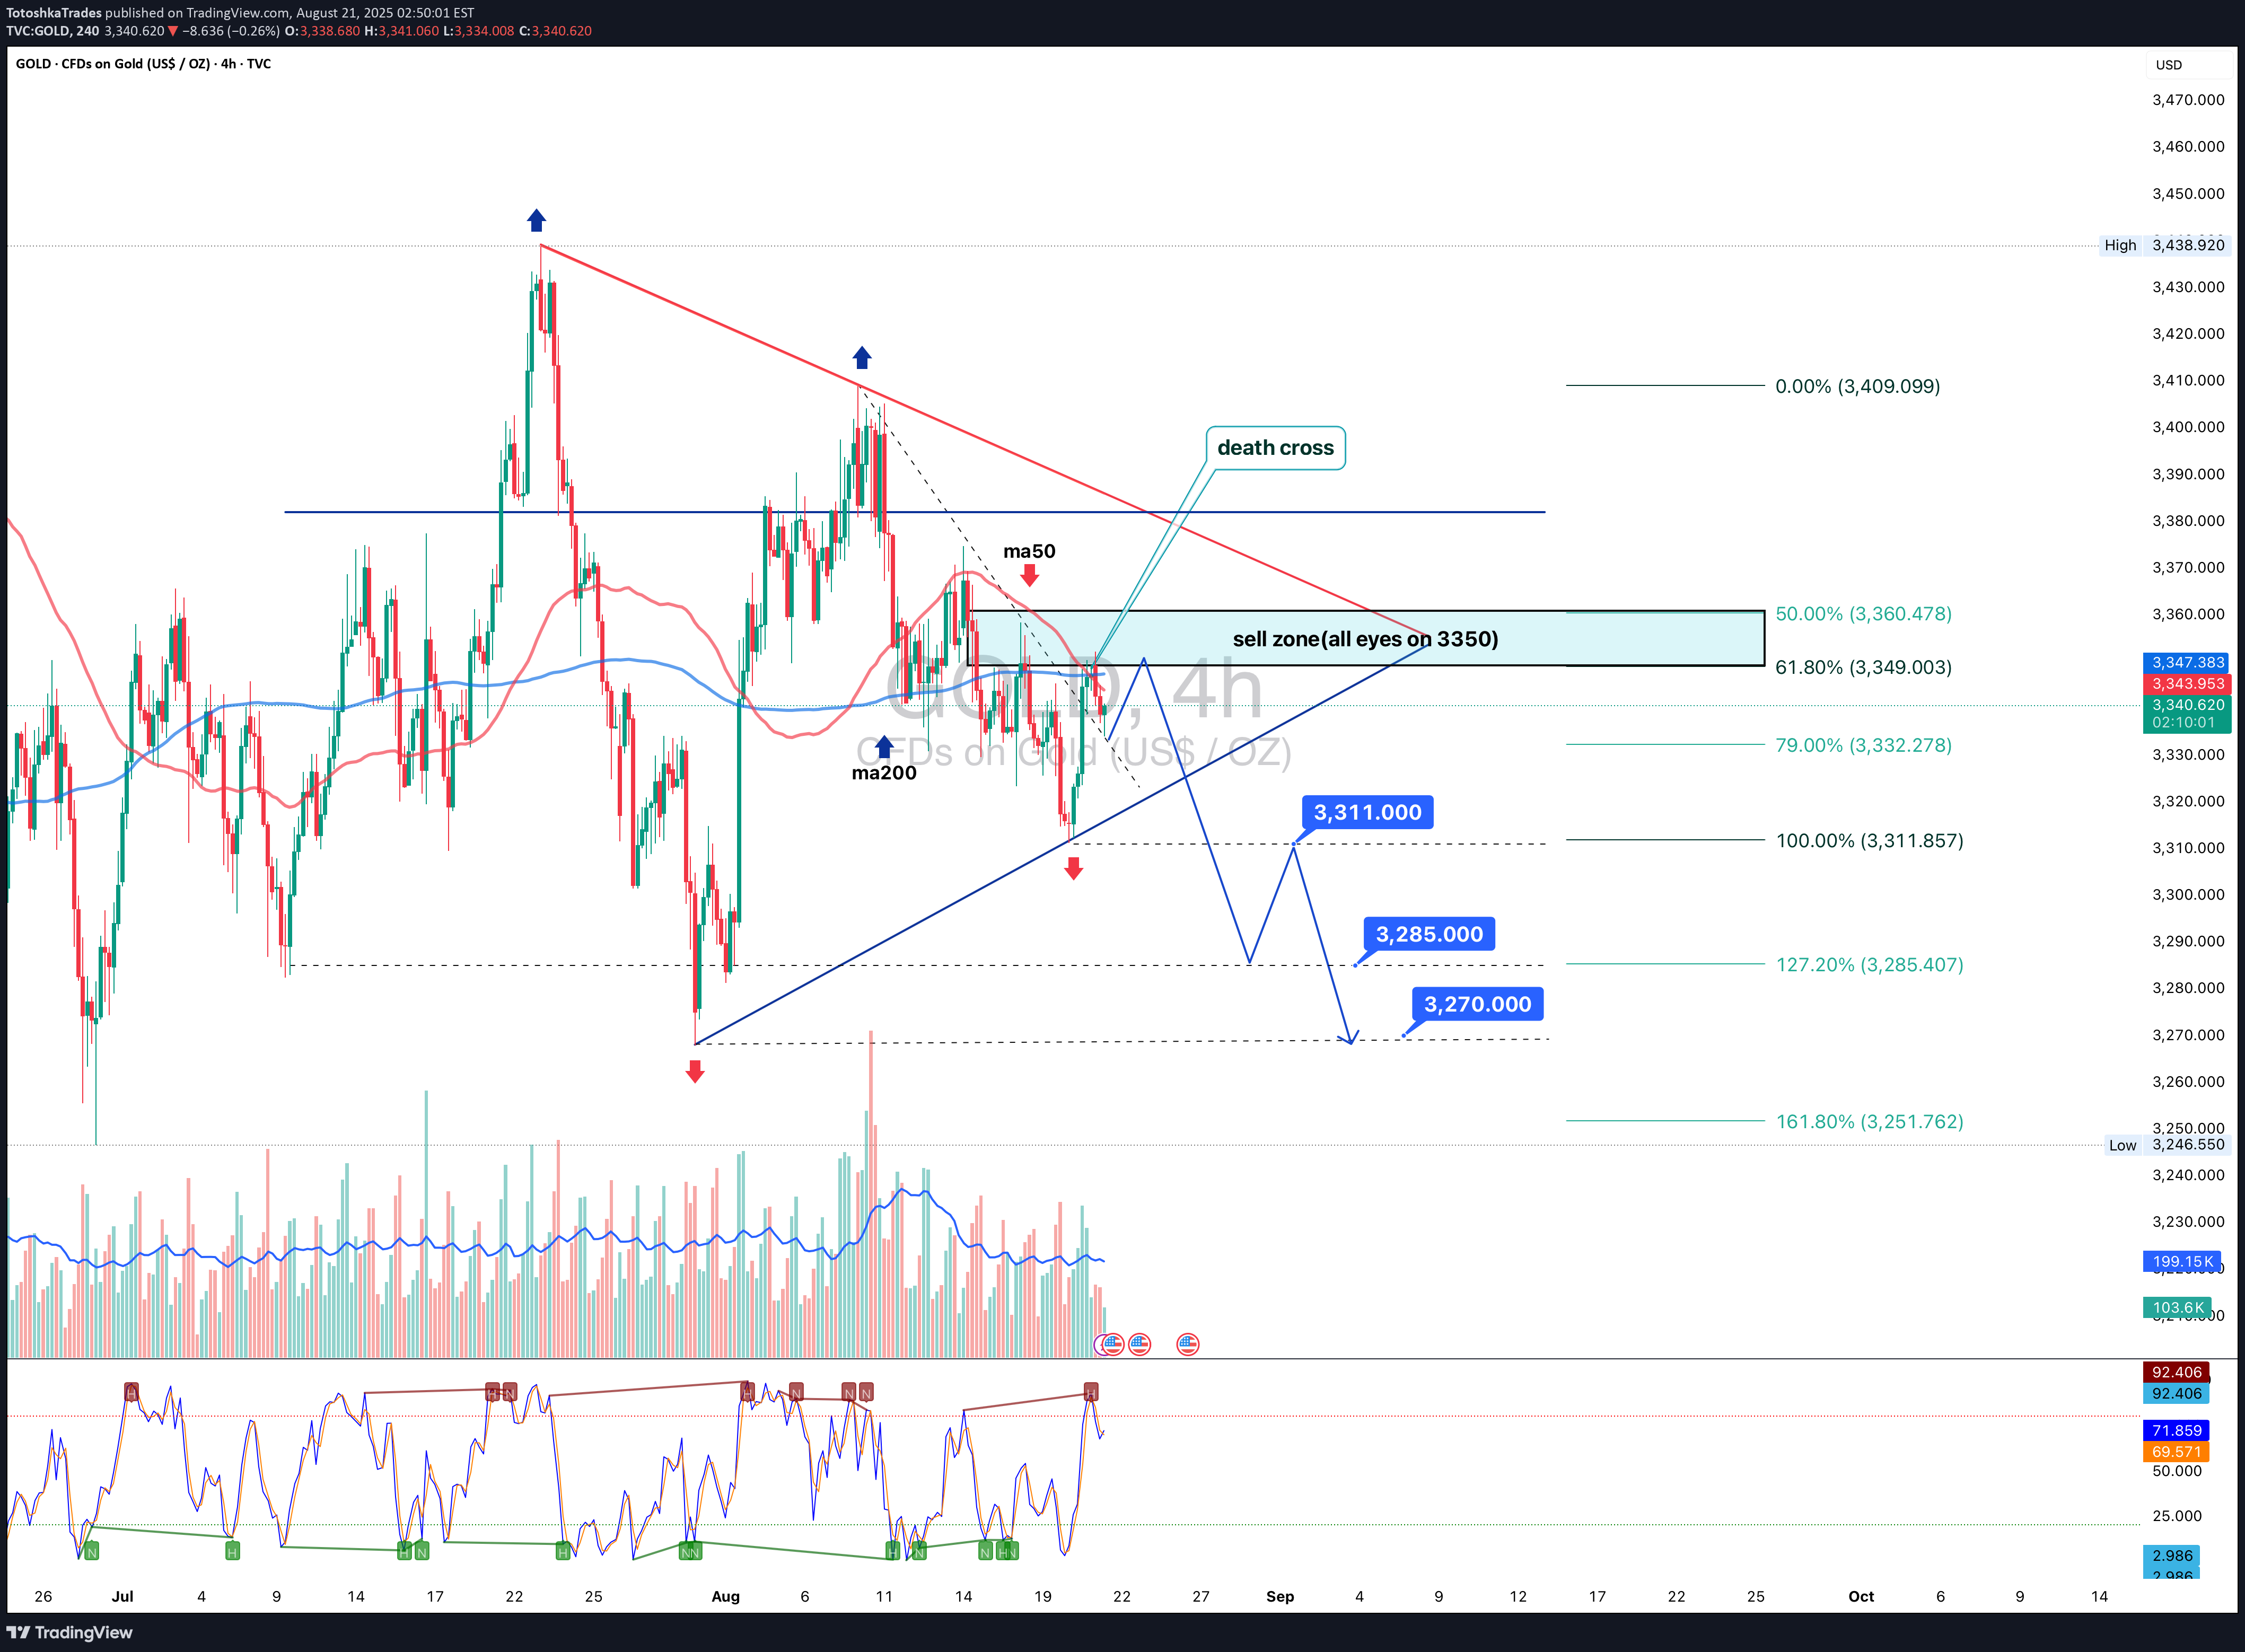
The technical picture on gold strengthens the bearish case: on the 4H chart, a death cross (MA50 crossing MA200 downward) has formed, signaling short-term pressure from sellers. The key sell zone is 3350, where the 0.618 Fibonacci, descending trendline, and volume cluster converge. From here, a downward move is expected with first targets at 3311, then 3285, and extended potential towards 3270 (127.2–161.8 Fibo). Volume confirms declining buyer interest near local highs, while RSI shows reversal divergence, adding weight to the bearish scenario. Fundamentally , gold is under pressure as the market factors in the possibility of more aggressive Fed actions if inflation risks persist. At the same time, safe-haven demand is weakening due to DXY stabilization. Geopolitics is not providing immediate triggers for gold hedging, which also cools investor interest. Tactical plan: if 3350 acts as resistance, it opens an attractive short opportunity toward the mentioned targets. However, if price breaks and consolidates above 3350, the scenario must be reassessed as stop-hunting will begin. Ironically, gold - the eternal store of value - acts like a teenager again: offended at 3350 and ready for a tantrum downwards.
Disclaimer
Any content and materials included in Sahmeto's website and official communication channels are a compilation of personal opinions and analyses and are not binding. They do not constitute any recommendation for buying, selling, entering or exiting the stock market and cryptocurrency market. Also, all news and analyses included in the website and channels are merely republished information from official and unofficial domestic and foreign sources, and it is obvious that users of the said content are responsible for following up and ensuring the authenticity and accuracy of the materials. Therefore, while disclaiming responsibility, it is declared that the responsibility for any decision-making, action, and potential profit and loss in the capital market and cryptocurrency market lies with the trader.