
TopGBanks
@t_TopGBanks

What symbols does the trader recommend buying?
Purchase History
پیام های تریدر
Filter
TopGBanks
TopGBanks

Chainlink remains a key infrastructure project in crypto, powering oracle solutions across DeFi and institutional blockchain integrations. Growing adoption in tokenized assets and cross-chain applications keeps LINK in strong demand. After a strong breakout above the $20 zone, price is consolidating near $22. A healthy pullback could set up the next leg higher toward $26. Previous resistance at $20 now acts as strong support for the bullish continuation.
TopGBanks

Price is trading within an ascending channel, currently around $182. A breakout continuation could target $195 first, followed by $205. Support remains at the lower channel line, keeping the short-term bullish momentum intact. Solana remains one of the fastest-growing L1 ecosystems with strong DeFi, NFT, and gaming adoption. Network activity and developer growth remain high, reinforcing investor confidence ahead of potential ecosystem upgrades.
TopGBanks

Price rejected from $9.60 and is now pulling back toward the $9.05 support zone. Holding above this level could trigger a bullish reversal targeting $10.00 first, then $11.00. Structure remains intact as long as $9.05 holds. $TRUMP continues to benefit from strong social media traction and growing political narrative hype.
TopGBanks

Price rallied sharply to $1.52 before retracing, showing early signs of local profit-taking. Current consolidation above $1.35 keeps the short-term bullish structure intact. Watching for a potential retest of $1.25–$1.28 as support before the next leg higher. $PROVE is gaining traction as a newly listed token with increasing on-chain activity and early investor interest. Liquidity remains healthy post-launch, and positive sentiment is building as more exchanges consider listing it.
TopGBanks
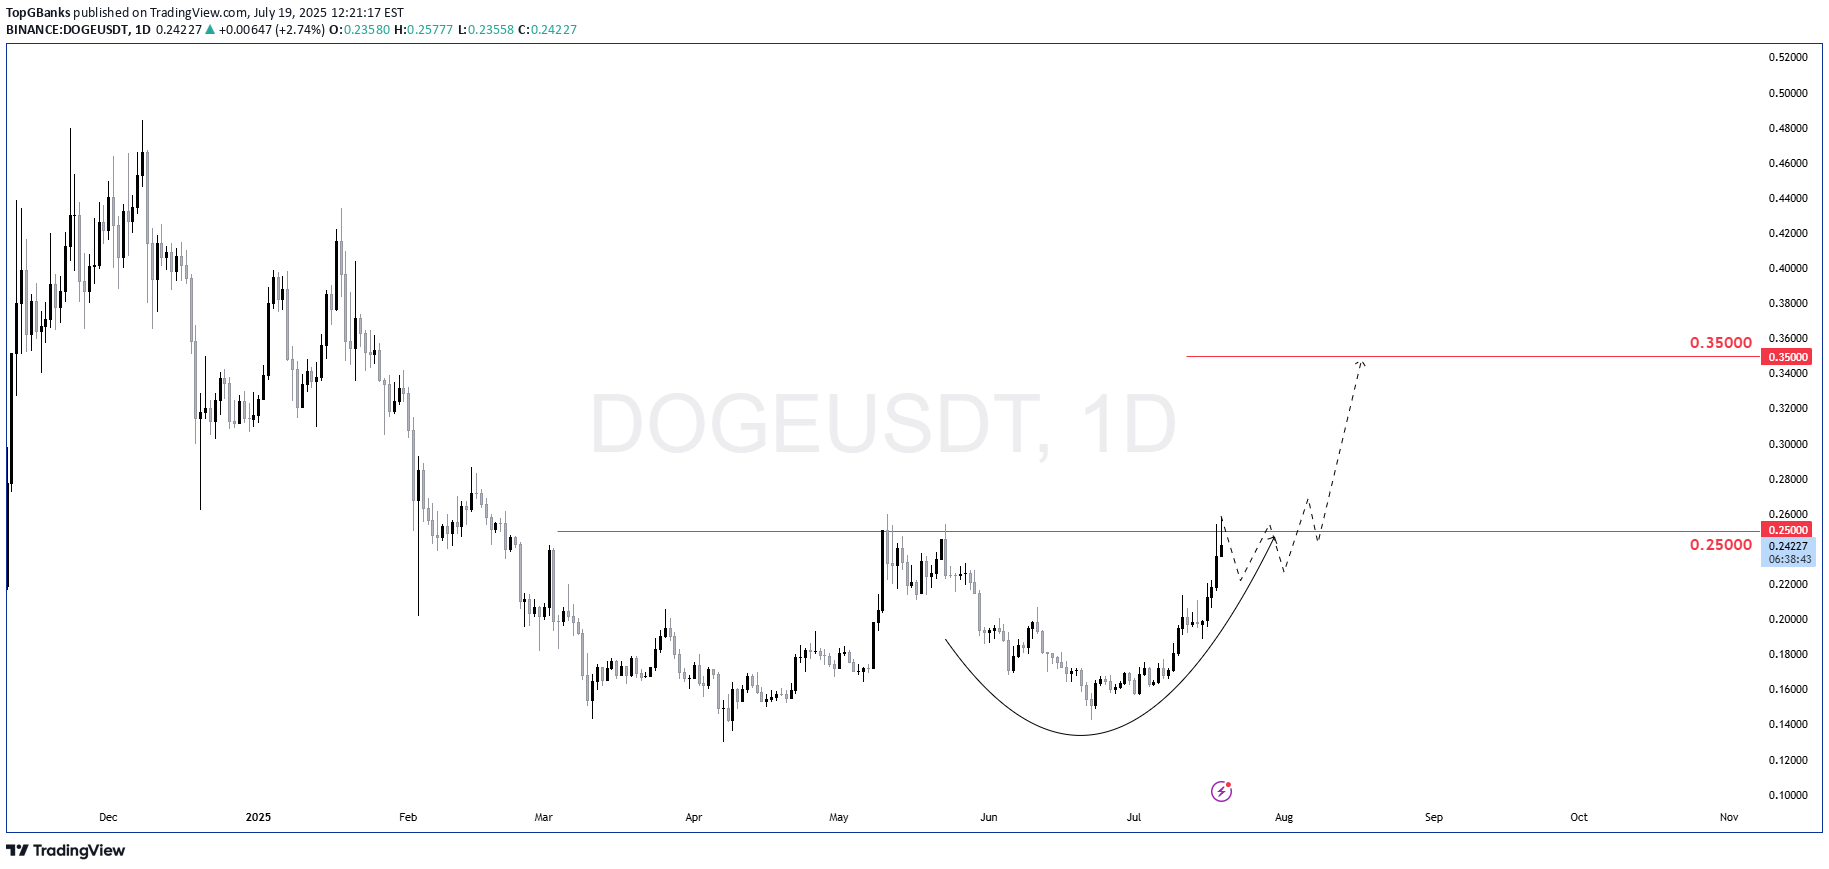
DOGE just broke above the 0.25 key resistance. The daily chart shows a clean cup-and-handle formation with a potential continuation setup. Price might consolidate just above 0.25, creating a bullish base. Then we expect a continuation move toward 0.35 as next target.
TopGBanks
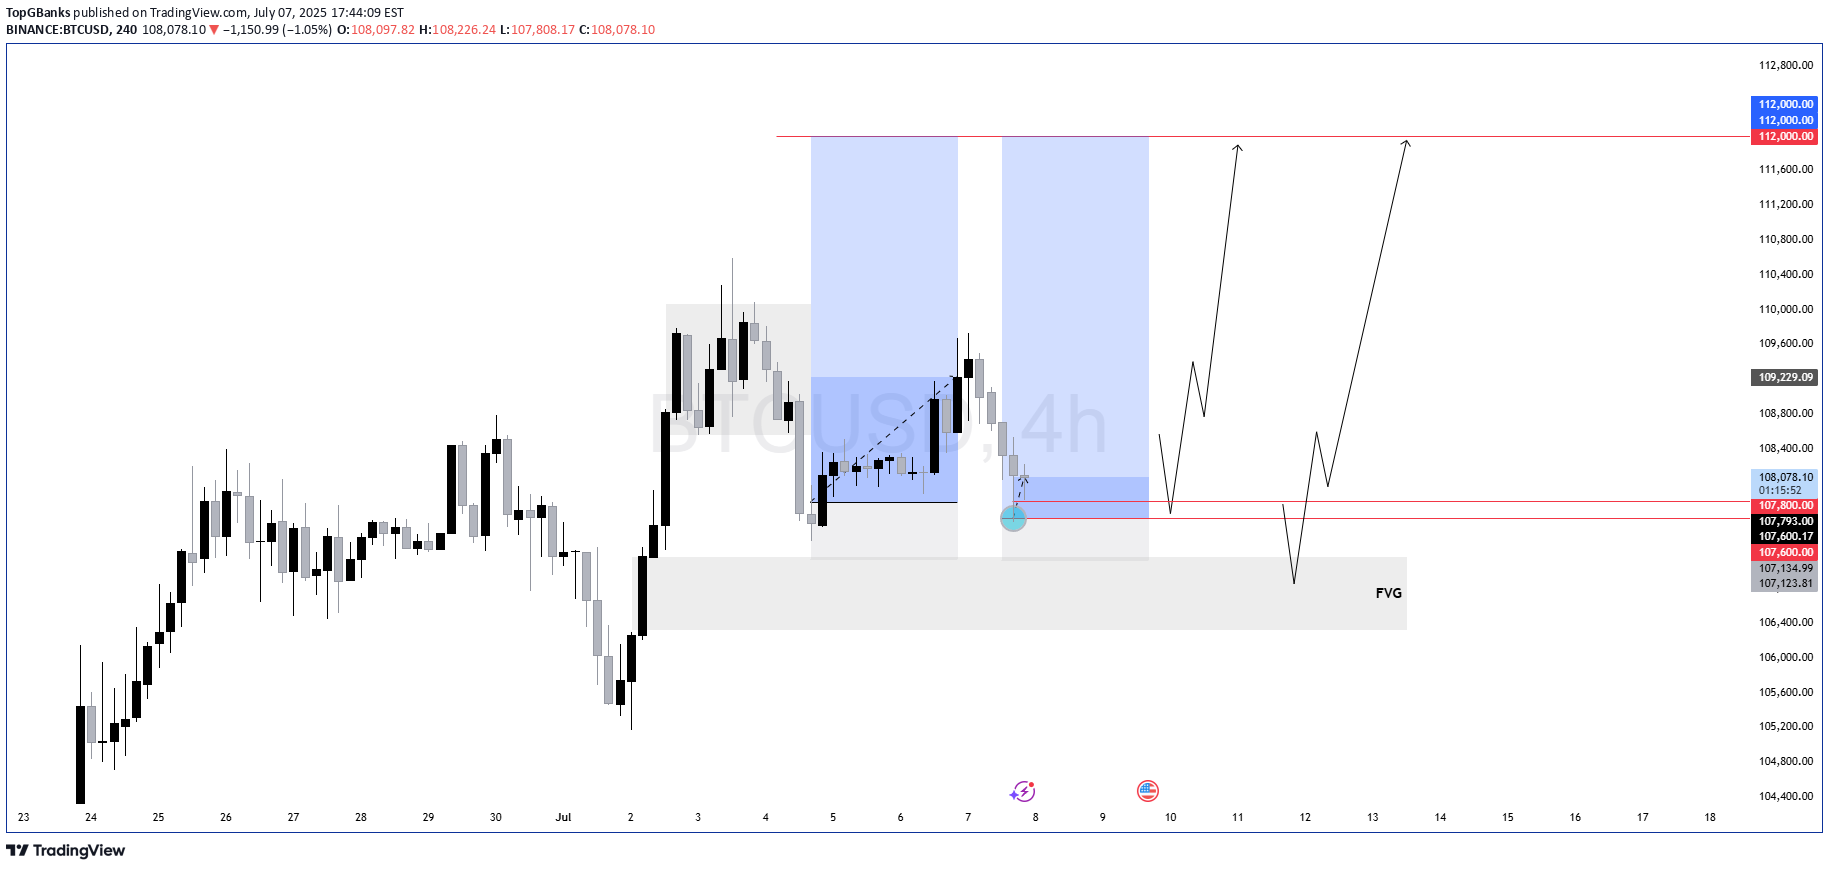
Price previously rallied strongly from a Fair Value Gap (FVG) at the bottom of the chart, forming a bullish market structure. After a bullish displacement, BTC consolidated in a tight range (reaccumulation) and swept internal liquidity before breaking down.Now, price has returned to a critical discount zone around 107800–107600First Target: 109,229 — internal range high.Main Objective: 112,000 — resting external liquidity above a clean high.As long as BTC holds above 107600, we remain bullish. The current area is perfect for accumulation before a potential expansion phase toward external liquidity.
TopGBanks
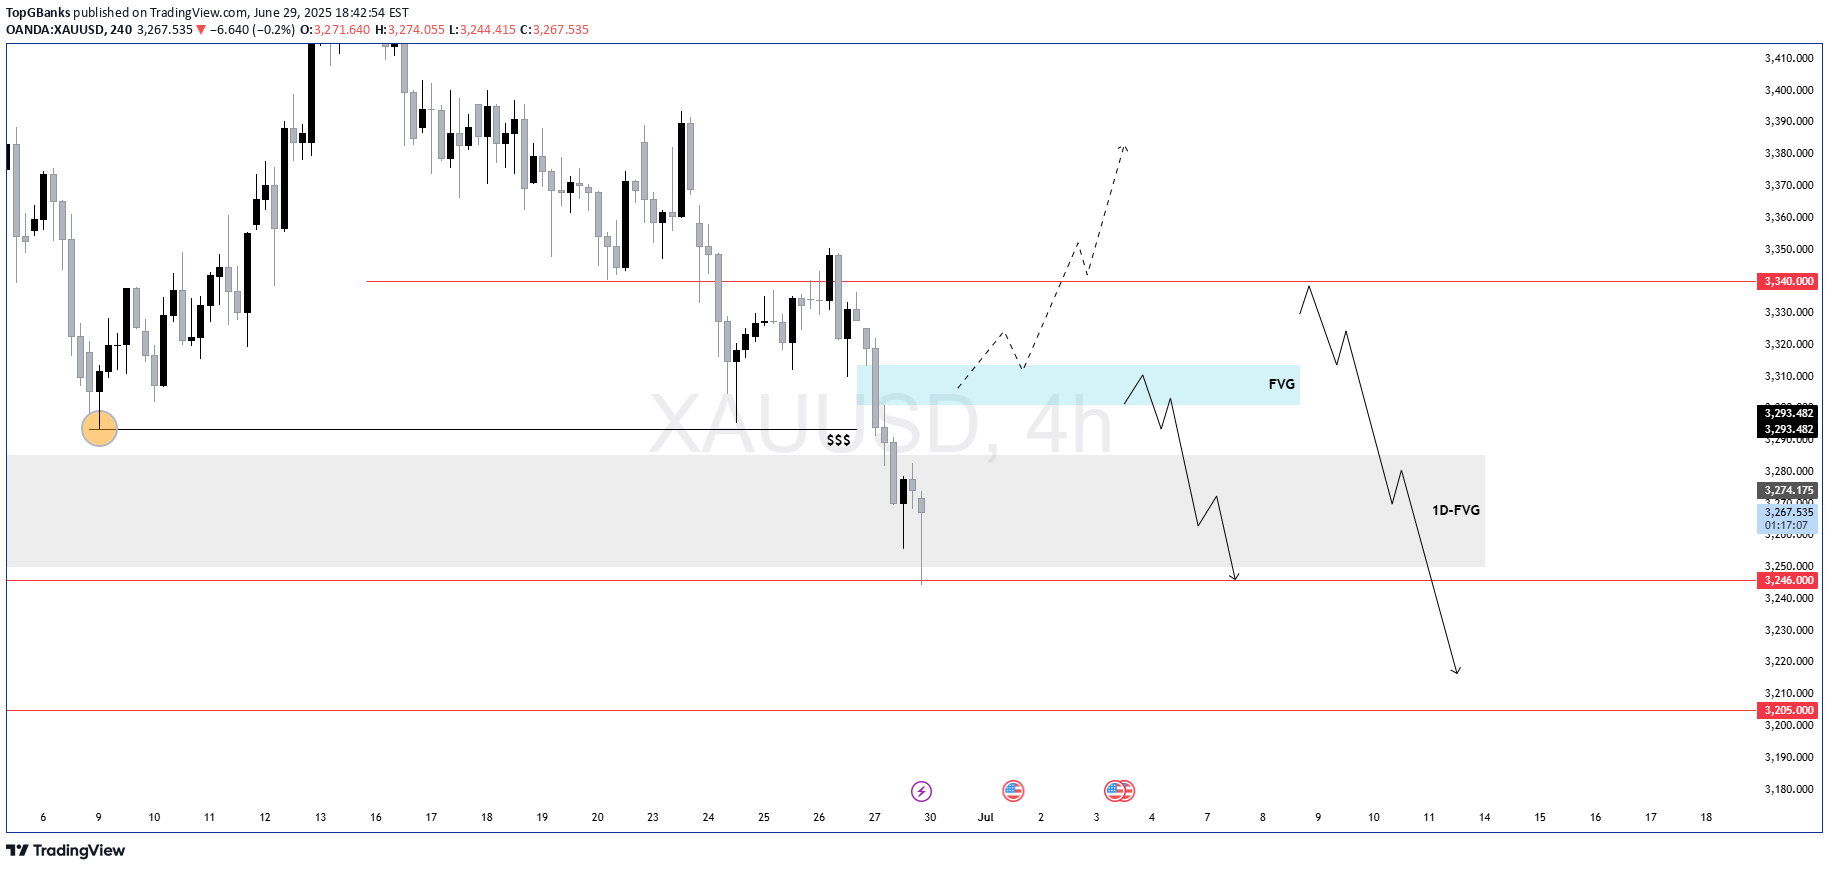
Gold swept short-term sell-side liquidity and tapped into a daily FVG, where price is currently consolidating.The 4H chart shows two potential paths:Retrace Scenario: Price may rally short-term into the 4H FVG zone for a premium-based entry — ideal area for shorting continuation aligned with the bearish daily and weekly narrative.Immediate Breakdown: If price rejects at current levels, a continuation toward the 3246 and 3205 daily draw-on-liquidity zones is likely.
TopGBanks

Price rallied strongly into a bearish FVG (Fair Value Gap) around 3,335 after reclaiming demand...However, this rally lacked conviction and broke structure to the downside, forming a lower high and a weak low retest.Ideal short setup: Price returns into the FVG, rejects around 3,333–3,335, then shows signs of displacement downward.First target: Break below 3,325.Invalidation: Clean break and close above 3,336.Bias: Short from FVG zone.Target: 3,294 area of liquidity.This is a classic liquidity sweep + FVG rejection setup.Reclaim of the trendline after sweep.Price to revisit the FVG zone around 3,335.Final rejection and breakdown toward 3,294.
TopGBanks

As we can see gold is struggling to pass the 2632.00$ key level which is now playing as a strong resistance in the 1h tf and i think we will see gold going down more into the bleu highlighted zone (FVG).Key levels to watch : 2632.00 // 2603.00Also the fundamentals suggest that gold is bearish
Disclaimer
Any content and materials included in Sahmeto's website and official communication channels are a compilation of personal opinions and analyses and are not binding. They do not constitute any recommendation for buying, selling, entering or exiting the stock market and cryptocurrency market. Also, all news and analyses included in the website and channels are merely republished information from official and unofficial domestic and foreign sources, and it is obvious that users of the said content are responsible for following up and ensuring the authenticity and accuracy of the materials. Therefore, while disclaiming responsibility, it is declared that the responsibility for any decision-making, action, and potential profit and loss in the capital market and cryptocurrency market lies with the trader.