
The_Best_Trades
@t_The_Best_Trades

What symbols does the trader recommend buying?
Purchase History
پیام های تریدر
Filter
Signal Type

📊 GOLD (XAUUSD) – 15m SMC Professional Analysis 🔹 Gold has created a Break of Structure (BOS) after testing the Equal High (EQH) near 3,499 – 3,500. This confirms that liquidity was engineered at the top, and the market is now retracing to collect orders. 🔹 Price is approaching a strong support/demand zone 🟩. This level is critical, as it aligns with Smart Money Concept (SMC) rules — institutions often accumulate orders here before driving price higher. 🔹 Scenario 1 – Bullish 📈 If demand holds, we can expect a strong bounce toward the 3,499 – 3,500 zone 🎯, targeting the weak high. This aligns with liquidity hunt theory where smart money aims to clear resting buy-side liquidity. 🔹 Scenario 2 – Bearish 📉 If the support fails and price closes below the swing low ❌, the structure will flip bearish, opening room for deeper downside. ✨ Professional Mindset for Traders 🧠 Be patient, the best trades form with confirmation ✅ Manage risk wisely — one good setup is better than chasing moves 🛡️ Always align with the bigger trend and liquidity flow 🔑 ⚡ Key Levels to Watch: Support/Demand Zone: 3,478 – 3,480 Upside Target: 3,499 – 3,500 Downside Invalidation: Break below swing low

📊 GOLD (XAUUSD) – 15m Professional SMC Outlook 🔹 The market has recently shown a Break of Structure (BOS) after forming an Equal High (EQH) around 3,499 – 3,500. This indicates that liquidity has been engineered above that level, and price may attempt to revisit that area. 🔹 Currently, gold is trading near 3,478, pulling back into a well-marked support/demand zone 🟩. This zone will be crucial — if buyers step in with confirmation, we may see a bullish continuation. 🔹 A potential Smart Money Concept (SMC) play is visible: 🏦 Liquidity has been taken out from the lows. 📉 Price shifted structure downward (CHoCH). 📈 Market is expected to retest demand and then push higher. 🔹 Bullish Target 🎯: If the support zone holds, the market can rally back to 3,499+, aiming to sweep the weak high liquidity. 🔹 Bearish Risk ⚠️: A clean break below the support zone and swing low would invalidate the bullish idea, opening the way for further downside. ✨ Mindset for Traders: Stay patient 🧘♂️, wait for confirmation inside the demand zone, and let smart money show direction. Discipline, proper risk management, and alignment with structure are the keys 🔑 to capturing the move.

BTC/USD – Technical Outlook (Bullish Bias) Current Price: $108,891 Market Structure BTC/USD has recently tested the $106,900 – $107,200 demand zone twice, confirming it as a strong support level. The repeated higher bounces from this area signal buyer absorption and weakening bearish momentum. Multiple Change of Character (CHoCH) and Break of Structure (BOS) events suggest a potential trend reversal to the upside. Key Levels Support Zone (Demand): $106,900 – $107,200 Immediate Resistance (Supply): $112,000 – $113,500 Major Resistance: $115,500 – $116,000 Bullish Scenario As long as BTC holds above $106,900, the short-term bias remains bullish. A sustained move above $112,000 would likely trigger continuation towards $115,500 – $116,000, where stronger supply is expected. Breakout above $116K could open the way for a larger bullish leg. Volume & Momentum The recent support bounce was backed by rising volume, confirming strong buying interest. Momentum indicators (implied from structure) support a potential upside continuation after short-term consolidation. --- 📊 Outlook: BTC/USD remains constructively bullish in the short term. Holding above $106,900 support will keep the upside structure intact, with targets at $112K and $116K. ---
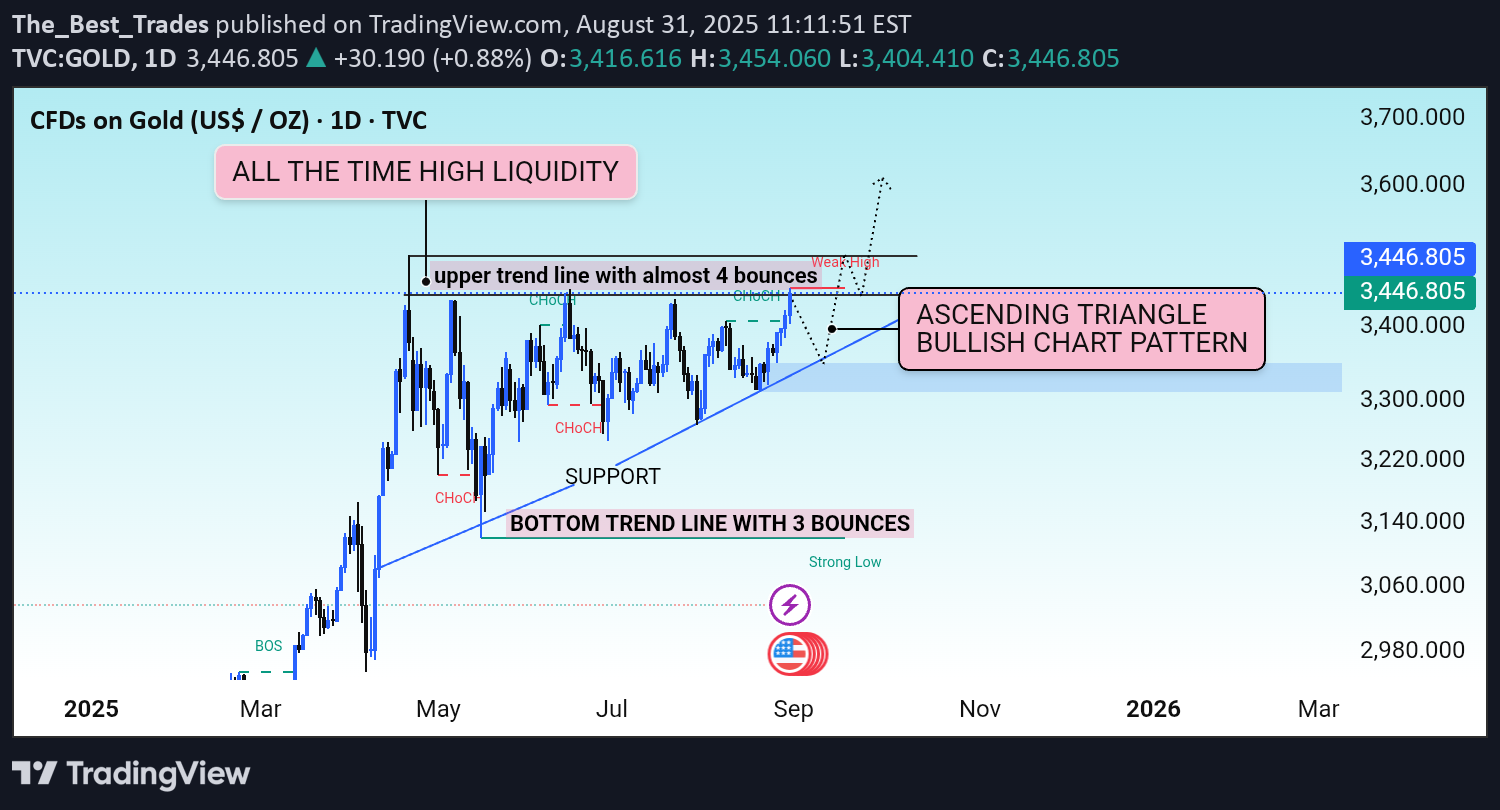
🔹 Ascending Triangle Formation The chart shows gold forming an ascending triangle pattern, with a bottom trendline (3 bounces = strong support) and an upper resistance trendline (tested 4 times). This is a classic bullish continuation pattern, suggesting a potential upside breakout. 🔹 Key Levels Current price is around 3,446. All-time high liquidity zone lies above, which is the next major target area. Strong support zone around 3,200 – 3,250. 🔹 Price Action Signals Price continues to bounce from support, confirming strong buying pressure. The upper resistance (weak high) has been tested multiple times, which increases the likelihood of a breakout. A successful breakout above resistance could lead to new all-time highs. 📈 Professional Outlook (Bullish Bias) As long as 3,200 support holds, gold remains in a bullish structure. A confirmed breakout from the ascending triangle could push gold towards 3,600 initially, followed by 3,750 – 3,800 levels. 👉 Overall, the chart supports a long-term bullish trend and favors a buy-on-dips strategy.

🔎 Smart Money Concept (SMC) Analysis: 1. Market Structure Price is creating higher lows (uptrend with ascending trendline). Multiple CHoCH (Change of Character) signals → structure shifts confirm buyers are in control. 2. Liquidity The chart shows a Weak High around 3446+, meaning stop losses are sitting above. Smart money usually hunts that liquidity → price may sweep above this level. 3. Supply & Demand Zones Demand zone: 3320 – 3280 (strong support). Supply zone: 3440 – 3450 (currently weak, likely to break soon). --- 📊 Technical Analysis: 1. Trendline Support Clear bullish trendline → as long as it holds, the market remains bullish. 2. Resistance Zone 3440 – 3450 is a major resistance. If rejected → retracement back to 3320 demand zone is possible. If broken → bullish continuation towards 3550 – 3600. --- 📌 Trading Plan (Confirmation + Entry + Risk Management): ✅ Buy Setup: Wait for confirmation: Candle close above 3446 (break + retest). Entry: 3448 – 3455 (after retest). Stop Loss: Below 3420. Target 1: 3520 Target 2: 3580 – 3600 ❌ Sell Setup: If strong rejection appears at 3440 – 3450 with bearish engulfing / CHoCH: Entry: Below 3435 – 3440 (bearish candle close). Stop Loss: Above 3458. Target 1: 3360 Target 2: 3320 (demand zone) --- ⚠️ Risk Management: Risk only 1–2% of account per trade. Keep minimum 1:2 Risk-to-Reward (RRR). If no confirmation → stay out (no trade is also a trade). --- 👉 My suggestion: Right now price is at resistance (3440–3450) → don’t enter blindly. Wait either for: A breakout + retest = Buy Or a strong rejection = Sell

📖 Smart Money Concept Description (Bullish Perspective) 1. Market Structure The market is currently bullish because it has been making higher highs (HH) and higher lows (HL). Multiple BOS (Break of Structure) to the upside confirm buyers are in control. 2. Liquidity There is a Weak High around 3,450. In SMC terms, weak highs are often liquidity pools that institutions target before pushing price further. Above that, there are stop losses from sellers → a liquidity grab is likely. 3. Demand Zones / Order Blocks Below current price, we see Demand Zones (OBs) around 3,370 – 3,310. These zones are strong because they align with structure and previous accumulation. Price could retrace into these demand zones before continuing higher. 4. Trendline Support A bullish trendline is supporting price from below, adding confluence to the bullish bias. 5. Smart Money Behavior Institutions (smart money) often push price above weak highs to grab liquidity, then either: Continue the bullish rally (if strong momentum exists). Or retrace into demand zones to accumulate more orders before the next leg up. --- 🧠 SMC Summary (Bullish View) The overall bias is bullish because of continuous BOS and strong trendline support. Weak high at 3,450 = liquidity target. After liquidity sweep, two scenarios: 1. Immediate continuation upward if buyers dominate. 2. Retracement to demand zone (3,370 – 3,310) for re-accumulation before pushing higher.
Disclaimer
Any content and materials included in Sahmeto's website and official communication channels are a compilation of personal opinions and analyses and are not binding. They do not constitute any recommendation for buying, selling, entering or exiting the stock market and cryptocurrency market. Also, all news and analyses included in the website and channels are merely republished information from official and unofficial domestic and foreign sources, and it is obvious that users of the said content are responsible for following up and ensuring the authenticity and accuracy of the materials. Therefore, while disclaiming responsibility, it is declared that the responsibility for any decision-making, action, and potential profit and loss in the capital market and cryptocurrency market lies with the trader.