Technical analysis by The_Best_Trades about Symbol PAXG: Buy recommendation (8/31/2025)

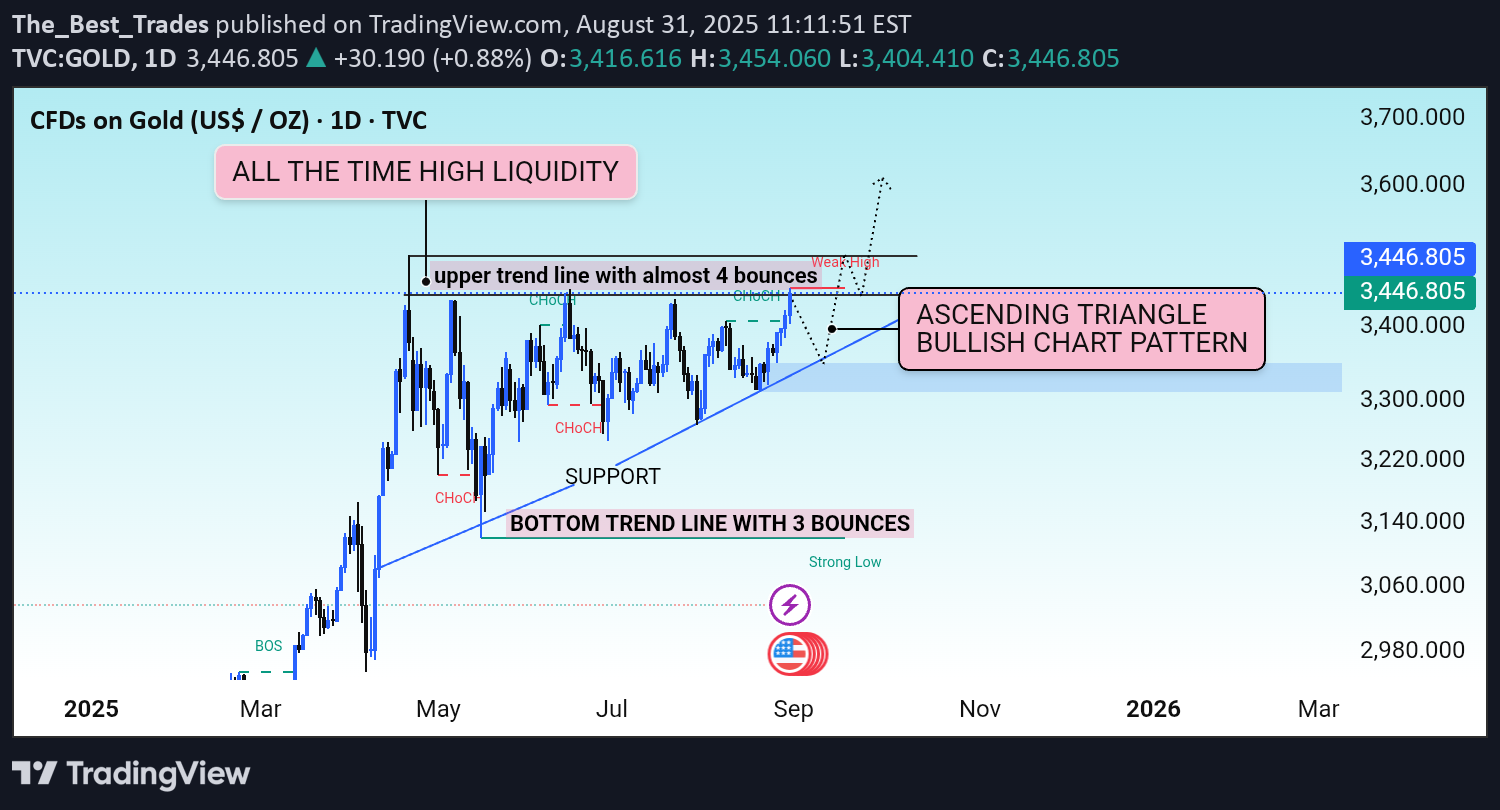
🔹 Ascending Triangle Formation The chart shows gold forming an ascending triangle pattern, with a bottom trendline (3 bounces = strong support) and an upper resistance trendline (tested 4 times). This is a classic bullish continuation pattern, suggesting a potential upside breakout. 🔹 Key Levels Current price is around 3,446. All-time high liquidity zone lies above, which is the next major target area. Strong support zone around 3,200 – 3,250. 🔹 Price Action Signals Price continues to bounce from support, confirming strong buying pressure. The upper resistance (weak high) has been tested multiple times, which increases the likelihood of a breakout. A successful breakout above resistance could lead to new all-time highs. 📈 Professional Outlook (Bullish Bias) As long as 3,200 support holds, gold remains in a bullish structure. A confirmed breakout from the ascending triangle could push gold towards 3,600 initially, followed by 3,750 – 3,800 levels. 👉 Overall, the chart supports a long-term bullish trend and favors a buy-on-dips strategy.
