
TheTradingDoct0r
@t_TheTradingDoct0r

What symbols does the trader recommend buying?
Purchase History
پیام های تریدر
Filter
Signal Type
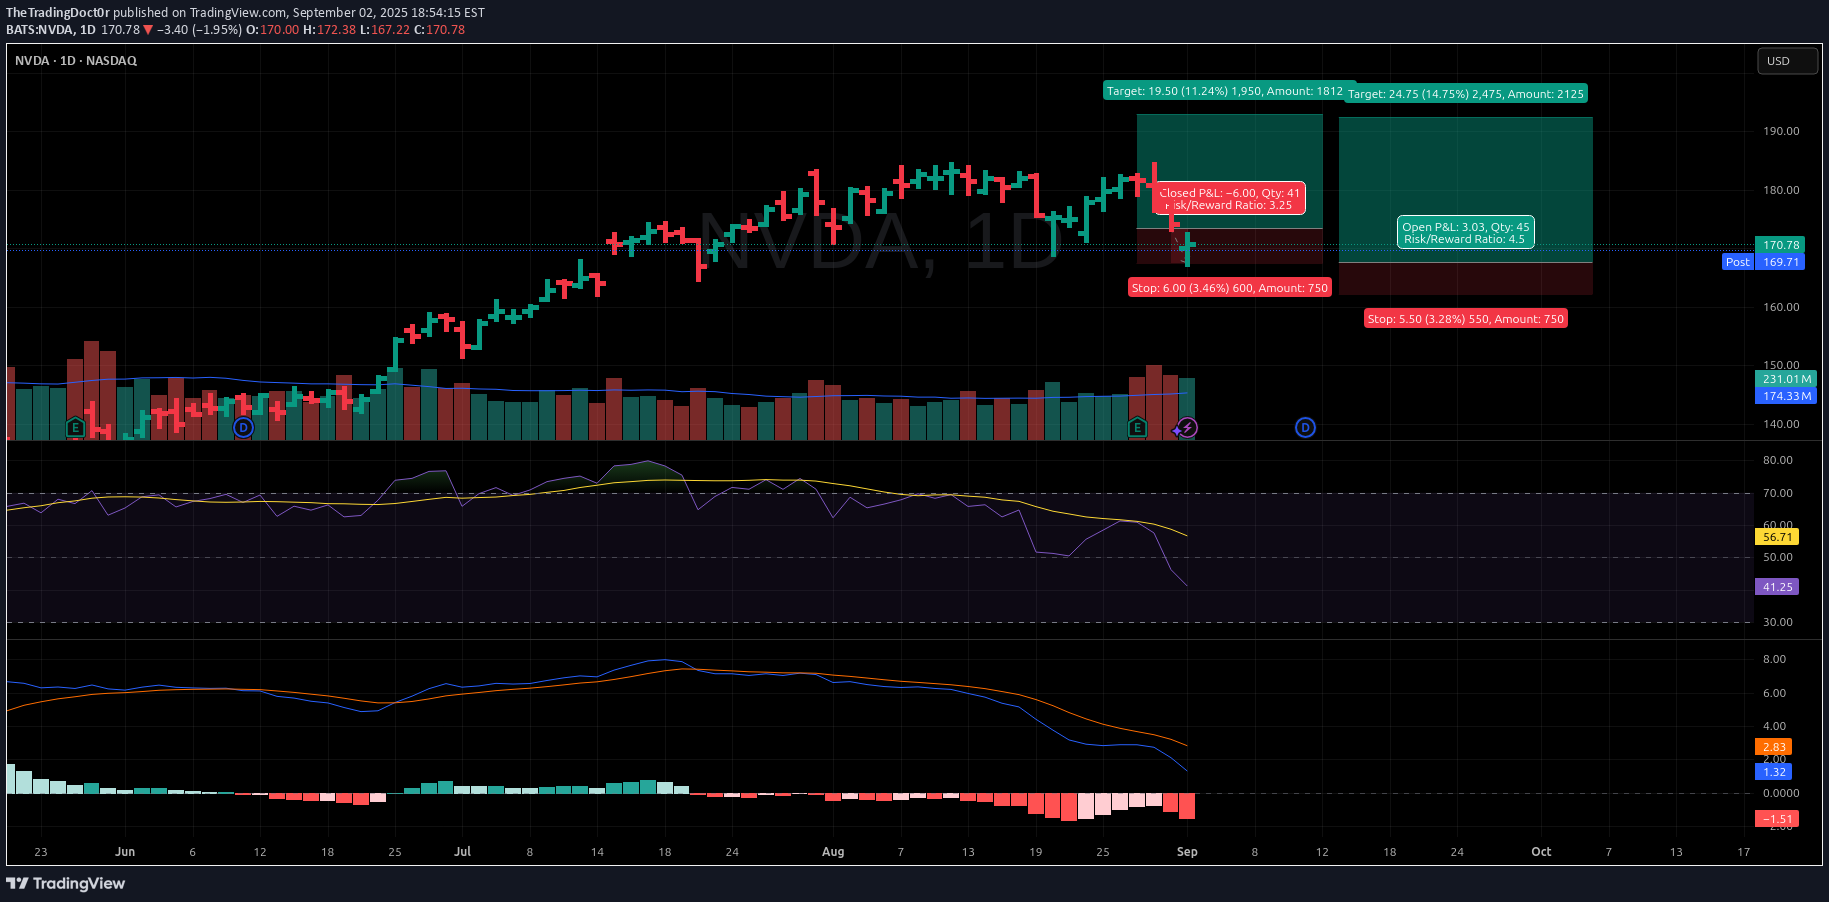
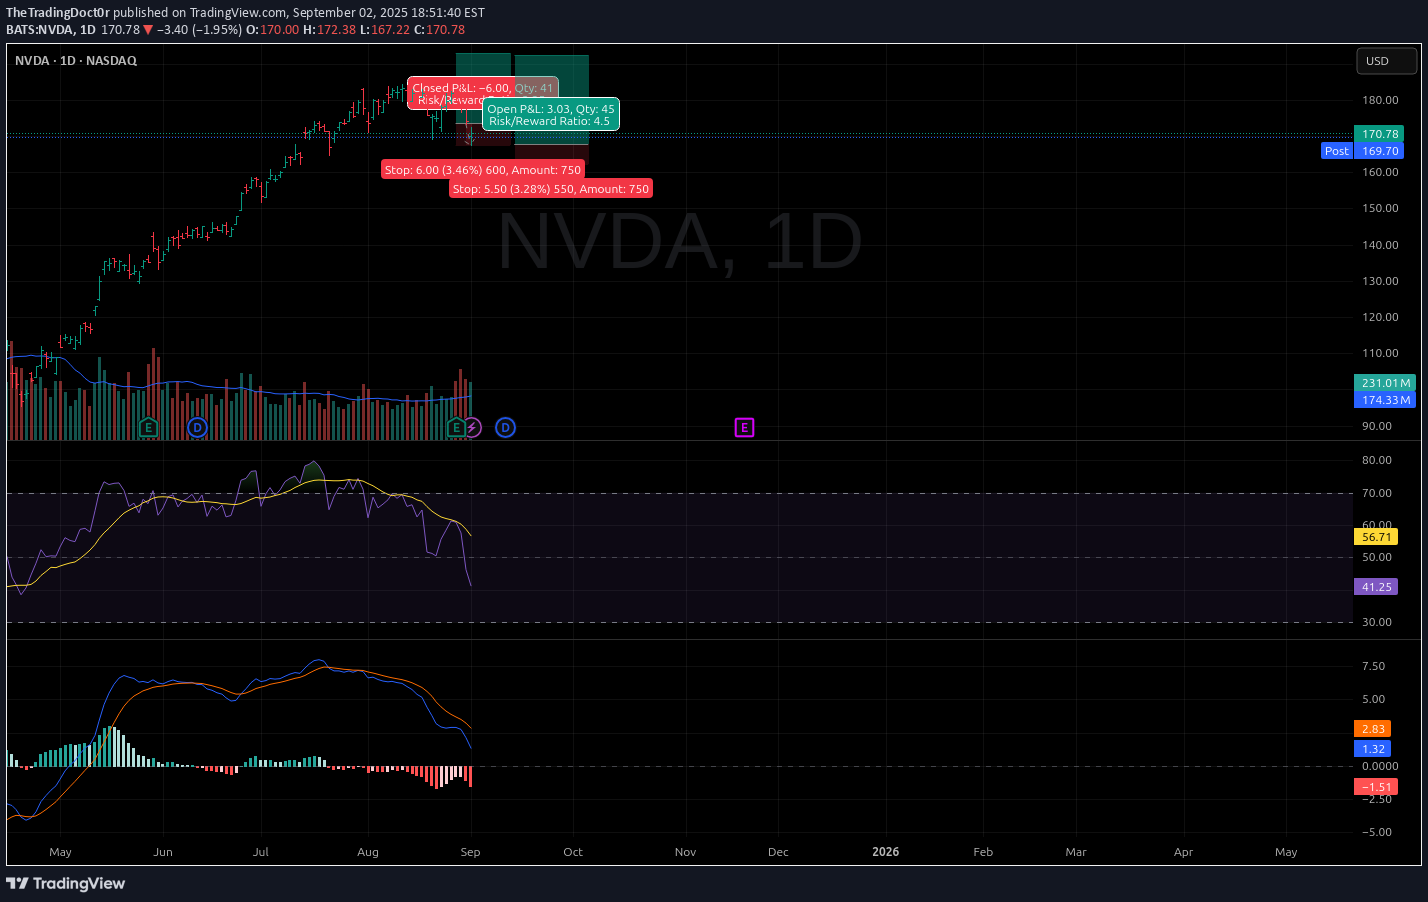
As we just discussed, a loss is not a failure; it's information. This trade on NVDA is a perfect, real-time application of that Stoic and Douglas-inspired philosophy. The first attempt was stopped out for a small "paper cut" loss. The Stoics teach us to focus only on what we can control. We couldn't control the price hitting our first stop, but we can absolutely control our reaction. Our reaction is not one of frustration, but of calm acceptance. We take the information the market gave us, remain balanced, and execute the next step of our plan. The New Trade Plan This second attempt is an action taken with more wisdom and an even better potential reward. [] Style: Long / Re-Entry [] Entry: Limit Order at $167.75 [] Stop Loss: A tight, strategically placed stop at $162.25 (3.28% risk) [] Target: $192.50 Risk/Reward Ratio: Approximately 1 : 4.5 The #limitlessTrader's Mindset The first trade was simply an exhale. This second trade is the next breath, taken with more clarity and from a place of balance. This is the process. Just shine. Disclaimer: This is not financial advice. It is for educational and informational purposes only. Please conduct your own research and manage your risk accordingly.
Hello, fellow seekers. Today, let's set aside the charts for a moment and talk about the single most important tool in our arsenal: our mind. A winning strategy is useless if the mind operating it is in a state of chaos. The key to consistency is not a secret indicator, but a balanced internal state. Two of the most powerful frameworks for achieving this balance are the modern wisdom of trader Mark Douglas and the ancient philosophy of Stoicism. They are two different paths leading to the same truth. Mark Douglas's 5 Fundamental Truths of Trading []Anything can happen. []You don't need to know what is going to happen next to make money. []There is a random distribution between wins and losses for any given set of variables that define an edge. []An edge is nothing more than an indication of a higher probability of one thing happening over another. Every moment in the market is unique. The Echo of Stoicism These truths echo the teachings of Stoic philosophers like Marcus Aurelius. They teach us to accept what is outside our control (market movements) and focus only on what is within our control (our process, our risk, our mindset). This is the path to emotional flow, not suppression. It is watching the river of fear and greed flow by without being swept away by the current. From Theory to Practice This isn't just theory; it's the practical foundation for how we navigate the markets. In my next posts on NVDA and OPEN , you'll see exactly how these principles are applied in real-time to manage both a losing trade and a winning one. Just shine. Disclaimer: This is not financial advice. It is for educational and informational purposes only. Please conduct your own research and manage your risk accordingly.
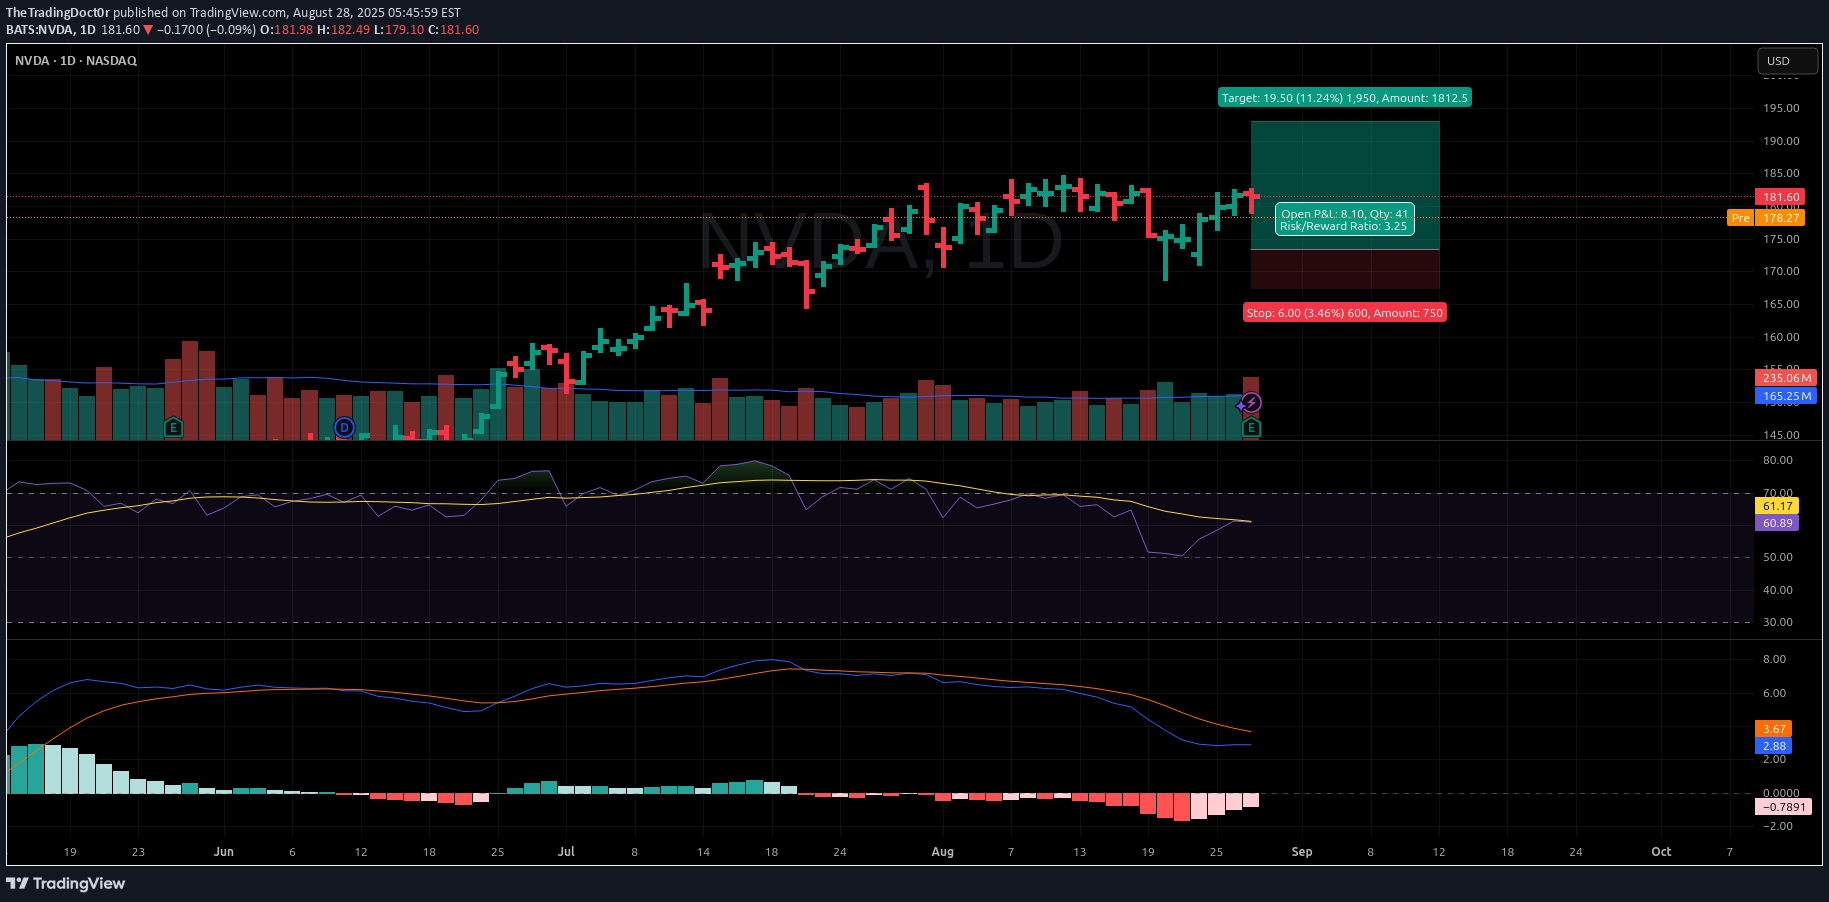
Traders, when the General pauses, we look to the Vanguard for clues. NVDA has been a quintessential market leader, a rocket ship charting a course through clear skies. Its current price action is a critical piece of the puzzle [/-i] for where the entire market may be headed next. The Technical Landscape The strength in this chart is undeniable. It is the definition of a stock in a powerful uptrend. [] Relative Strength: NVDA has consistently outperformed the broader market, making it a key barometer of risk appetite. [] Current Pattern: The rocket ship is refueling. Price is consolidating in an exceptionally tight and orderly pattern right below the $182 resistance level. Critically, volume has been declining during this coil—a classic sign that sellers are scarce and the next move is likely to be upward. Key Support: The launchpad for this consolidation is the support level around $170 . This area must hold for the immediate bullish structure to remain intact. The Philosophy Strength begets strength. In the market, this is a fundamental truth. To bet against an asset displaying such clear and persistent power is a low-probability endeavor. The current coil is not a topping pattern; it's a continuation pattern in waiting. It's the moment of calm before the engines reignite. While the broader market takes a breath, leaders like NVDA often complete their rest cycle first. How this pattern resolves will provide a powerful clue about the market's true intentions. We do not predict; we observe and align ourselves with demonstrated power. An Illustrative Setup The trade thesis is born from this powerful consolidation: [] The Bullish Trigger: A confirmed breakout above $182 on increased volume is the signal that the refueling is complete and the next leg of the ascent has begun. [] The Warning Signal: A failure to hold the $170 support would indicate a temporary mechanical issue, suggesting a deeper pullback is required before the journey can continue. Watch the leader. It will often show the way. Remember to just shine! Disclaimer: This is not financial advice. It is for educational and informational purposes only. Please conduct your own research and manage your risk accordingly.Hello everyone. Following up on our plan for NVDA, the moment of patience we were waiting for has arrived. The market has graciously offered the pullback to our key support level, and now is the time for disciplined execution. Thesis Confirmation & Execution As anticipated, the price has retraced to our target entry zone around $173.50, and I am now executing the long side of the trade. This "buy the dip" opportunity is exactly what the plan called for. The technicals have reset, as we hoped they would. The RSI has cooled off from overbought levels, and the MACD has completed its pullback cycle—a necessary 'exhale' before the next potential move higher. We are not catching a falling knife; we are meeting a strong trend at a logical point of support. The Trade Plan: Risk First While the upside potential is significant, our first and most important job is to manage our risk. [] Style: Long / Buy the Dip [] Entry: Around $173.50 [] Stop Loss: A tight stop is set around $167.50. [] Target: The initial target is near $193.00. Risk/Reward Ratio: Approximately 1 : 3.25 This setup respects our "lose fast" principle. If the support fails to hold, we are out with a small, manageable "paper cut" loss. We are paying a small price to see if our thesis is correct. The #limitlessTrader's Perspective The plan was set days ago. The analysis was done from a place of balance. Today's execution is merely the logical next step in a patient process. The goal now is to remain detached from the outcome, manage the trade according to the plan, and let the market do the rest. Disclaimer: This is not financial advice. It is for educational and informational purposes only. Please conduct your own research and manage your risk accordingly.This trade was stopped out for a planned, manageable loss. This is a perfect example of a "paper cut." The tight stop loss did its job: it protected our capital when the price dipped below the immediate support level. For me, a small loss like this is not a failure; it is simply data. My assessment is that the initial stop was too tight for the current volatility, but the bullish defense we saw today actually strengthens my underlying thesis. Therefore, I am re-engaging with an adjusted plan. See the new trade idea linked below for the full details.
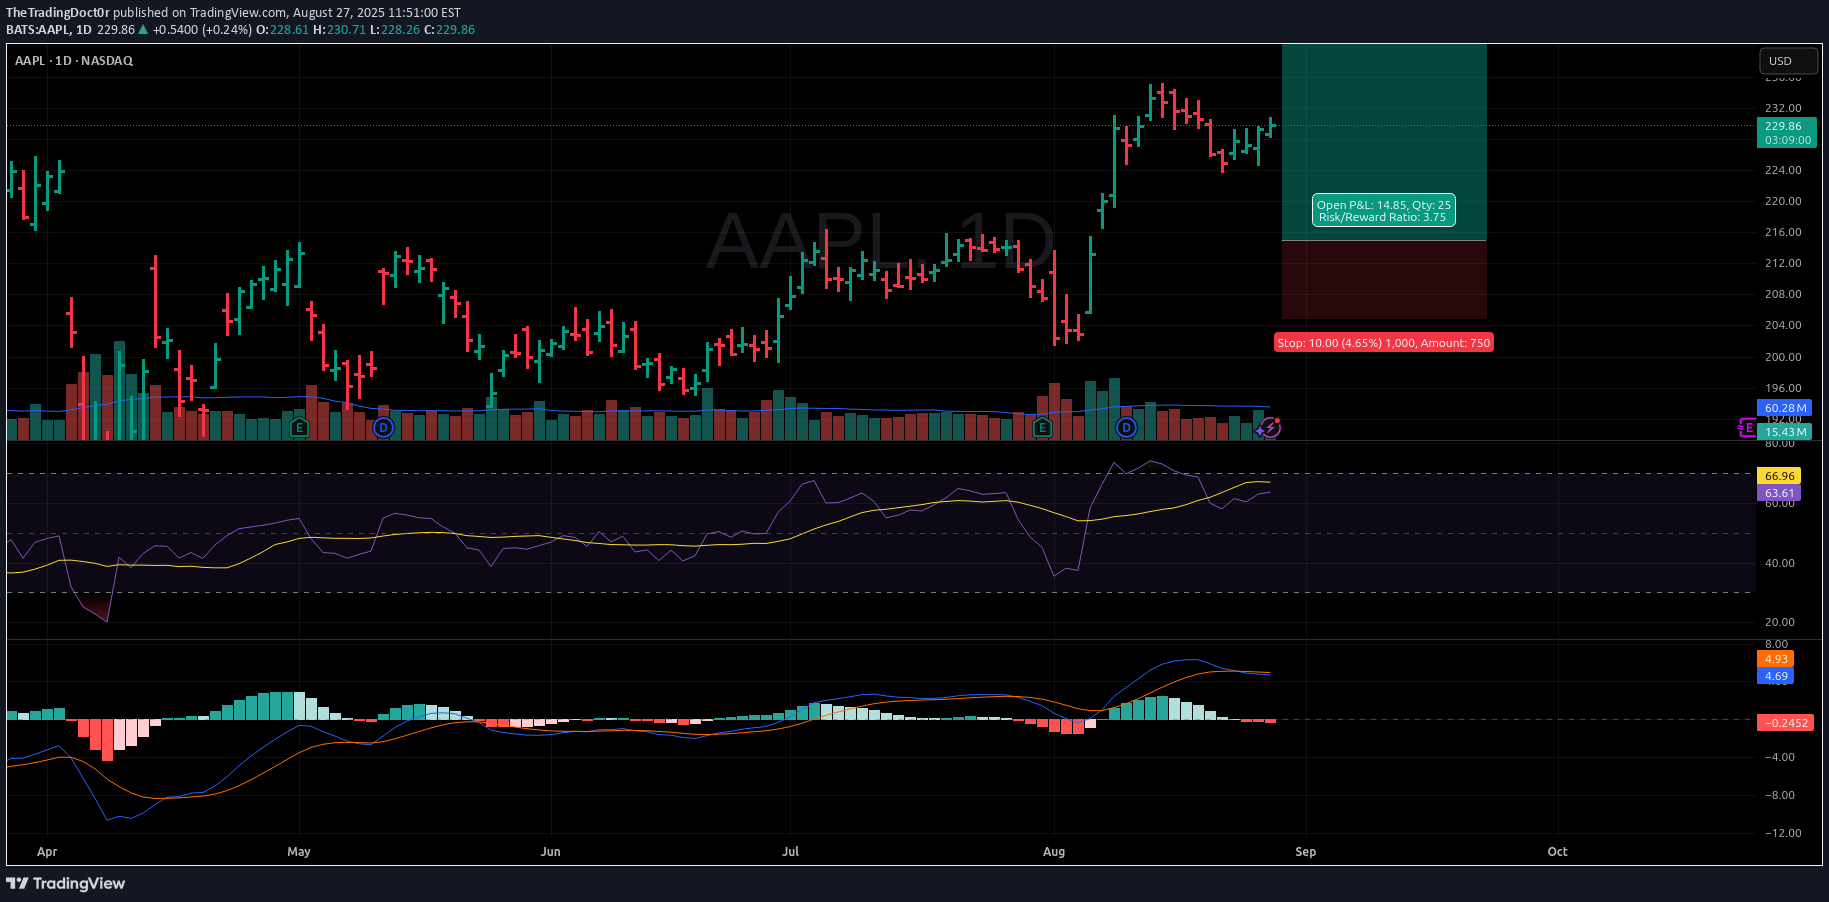
Hello, fellow traders. While the broader market is showing some signs of weakness, it's in these moments that the strongest opportunities can arise. Fear in the market can be a gift, offering a chance to enter a fundamentally sound company at a technically sound price. Today, we're looking at Apple ( AAPL ). The Fundamental Bedrock Before we look at the chart, let's remember the 'why'. Apple remains a titan of industry with a fortress-like balance sheet. With the anticipation building for their next generation of products and the relentless, high-margin growth of their Services division (iCloud, App Store, Apple Music), the long-term fundamental picture remains incredibly strong. We are not just buying a ticker; we are looking to partner with a powerhouse. The Technical Landscape: A Confluence of Signals The daily chart for AAPL is painting a clear picture for a potential long entry on this pullback. [] The Trend is Your Friend: The overall structure is firmly in a "Bull Regime." Our primary goal in such a trend is to find logical places to join it, not fight it. [] The August 6th Breakout: Price action decisively broke the previous market structure to the upside on August 6th, signaling a new leg of bullish intent. [] The Gap Magnet: This breakout left a small, unfilled price gap in the $215-$216 area. Gaps like this often act as magnets, drawing the price back to fill them before continuing the trend. [] Resistance Becomes Support: This same ~$215 level was a prior resistance zone. A pullback to this level would be a classic test of this "polarity" principle, confirming the old ceiling as the new floor. An Illustrative Trade Plan Based on this confluence, here is a potential setup that offers a very favorable risk-to-reward ratio. [] Style: Long / Buy on Pullback [] Entry: Around $215.00 [] Stop Loss: Around $205.00 [] Target: Around $252.50, near the prior all-time highs. Risk/Reward Ratio: Approximately 1 : 3.75 The #limitlessTrader's Perspective This trade is the essence of patience. The FOMO-driven trader may have bought the top of the August 6th breakout. The disciplined trader waits for the inevitable exhale, allowing the price to come to them at a level where the risk is defined and the potential reward is significant. It is a perfect balance of a strong fundamental story with a patient, logical technical entry. Disclaimer: This is not financial advice. It is for educational and informational purposes only. Please conduct your own research and manage your risk accordingly.
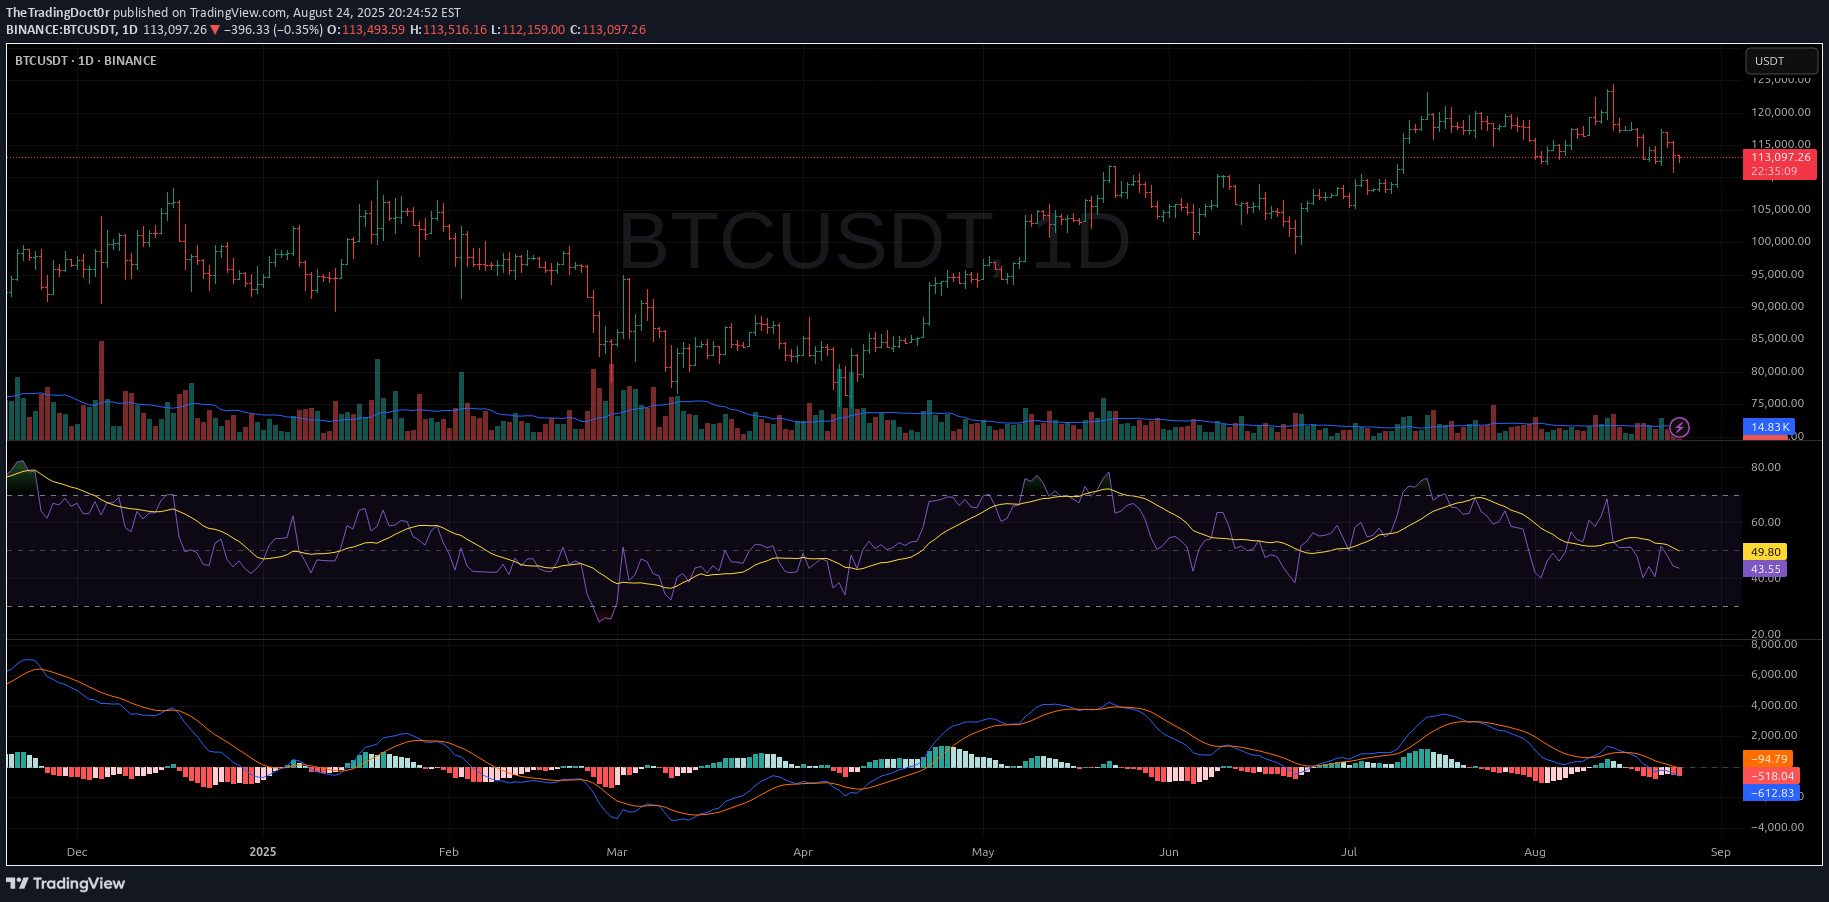
Pine Script® Hello, fellow seekers. The purpose of this post is not to predict the future with certainty, but to share a perspective—one piece of an infinitely complex and beautiful puzzle. My only goal here is to shine a light on what I see in the charts, hoping it may help illuminate the path for others. What resonates is for you; what doesn't, you may leave behind. This idea will find the eyes it is meant for. The Technical Landscape: A Daily Chart Perspective on BTCUSDT After a significant upward movement, the energy on the daily timeframe for Bitcoin appears to be shifting. I do not believe this is a call for a prolonged bear market, but rather an observation of a healthy and necessary exhale before the next inhale. As I see it, the bulls are simply sharpening their horns and cleaning their hoofs for the next phase. Here's what the chart suggests to me: Slowing Momentum: My indicators, which are designed to be aware of higher timeframe context, are showing signs of waning bullish momentum. As you can see in the lower panels, both the MACD and RSI suggest that the initial burst of buying pressure is subsiding for now. Price Action & Profit Taking: The recent price action shows some indecision, which is expected. This is a natural part of any market cycle. After a strong run, early participants will look to secure gains, creating temporary overhead supply and allowing the market to find a new, more stable equilibrium. Potential Targets: Based on momentum and market structure, I see a potential retracement to two key areas: The Psychological $100,000 Level: A natural magnet for price and a common area for a retest before a potential continuation. The Bu-OB Demand Zone ($80k - $90k): The green box on my chart highlights a previous area of consolidation and order flow. This would be a high-probability area for buyers to step back in with conviction. A Potential Short Setup For those whose personal trading plan aligns with this perspective, a favorable short setup appears to be forming with a quality risk-to-reward ratio. Bias: Short-Term Bearish / Corrective Entry: Around current levels (~$113,000 - $114,000) Stop Loss: A defined stop above the recent swing high at ~$126,500 is crucial. Risk management is our anchor in the stormy seas of probability.Take Profit: Targeting the ~$89,000 - $100,000 area. As shown on the chart, this provides a favorable risk/reward ratio of nearly 1:2. The Philosophy Behind the Chart We are not here to force our will upon the market, but to flow with it. This potential downturn is not a negative event; it's the market breathing. By detaching from the outcome—from the ego's need to be "right"—we can focus on a clear process and execute our plan with tranquility. This analysis is my contribution. It is not an attempt to sell anything or gather followers, but to connect and share a part of my own journey. In doing so, we help each other see the whole picture, the Great Puzzle, more clearly. Just shine. Disclaimer: This is not financial advice. It is for educational and informational purposes only. Please conduct your own research and manage your risk accordingly. Expand 33 lineslol @ having wrapped this in pine accidentally
Disclaimer
Any content and materials included in Sahmeto's website and official communication channels are a compilation of personal opinions and analyses and are not binding. They do not constitute any recommendation for buying, selling, entering or exiting the stock market and cryptocurrency market. Also, all news and analyses included in the website and channels are merely republished information from official and unofficial domestic and foreign sources, and it is obvious that users of the said content are responsible for following up and ensuring the authenticity and accuracy of the materials. Therefore, while disclaiming responsibility, it is declared that the responsibility for any decision-making, action, and potential profit and loss in the capital market and cryptocurrency market lies with the trader.