Technical analysis by TheTradingDoct0r about Symbol BTC: Sell recommendation (8/25/2025)

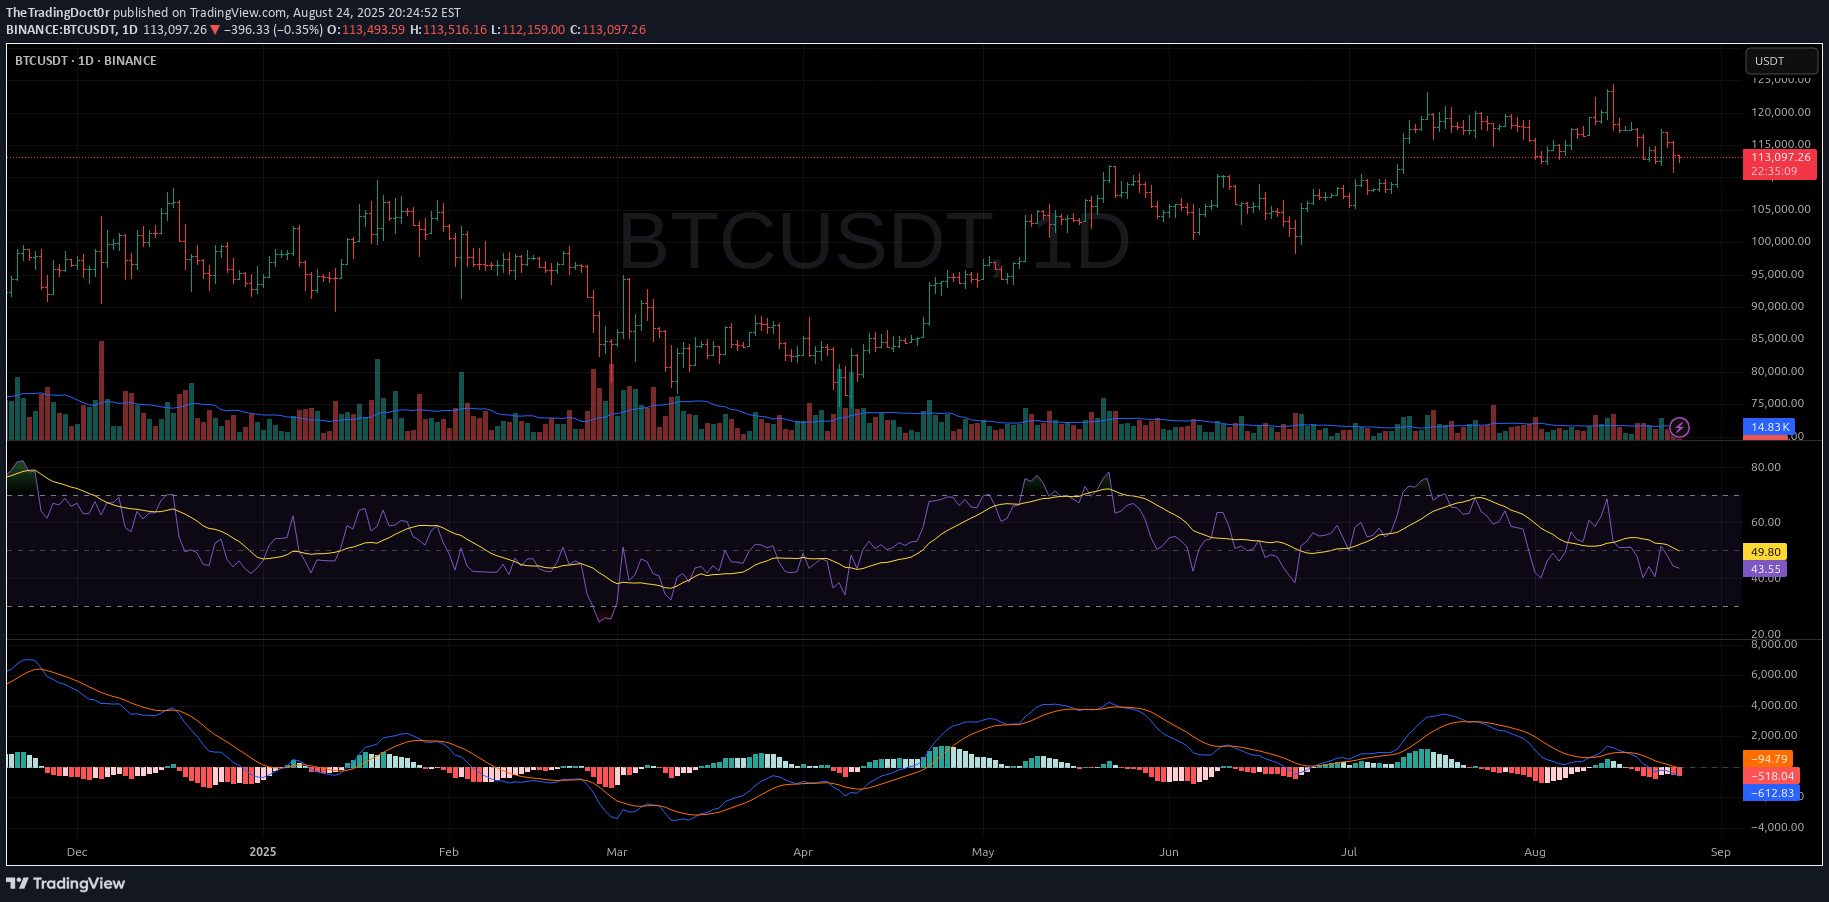
Pine Script® Hello, fellow seekers. The purpose of this post is not to predict the future with certainty, but to share a perspective—one piece of an infinitely complex and beautiful puzzle. My only goal here is to shine a light on what I see in the charts, hoping it may help illuminate the path for others. What resonates is for you; what doesn't, you may leave behind. This idea will find the eyes it is meant for. The Technical Landscape: A Daily Chart Perspective on BTCUSDT After a significant upward movement, the energy on the daily timeframe for Bitcoin appears to be shifting. I do not believe this is a call for a prolonged bear market, but rather an observation of a healthy and necessary exhale before the next inhale. As I see it, the bulls are simply sharpening their horns and cleaning their hoofs for the next phase. Here's what the chart suggests to me: Slowing Momentum: My indicators, which are designed to be aware of higher timeframe context, are showing signs of waning bullish momentum. As you can see in the lower panels, both the MACD and RSI suggest that the initial burst of buying pressure is subsiding for now. Price Action & Profit Taking: The recent price action shows some indecision, which is expected. This is a natural part of any market cycle. After a strong run, early participants will look to secure gains, creating temporary overhead supply and allowing the market to find a new, more stable equilibrium. Potential Targets: Based on momentum and market structure, I see a potential retracement to two key areas: The Psychological $100,000 Level: A natural magnet for price and a common area for a retest before a potential continuation. The Bu-OB Demand Zone ($80k - $90k): The green box on my chart highlights a previous area of consolidation and order flow. This would be a high-probability area for buyers to step back in with conviction. A Potential Short Setup For those whose personal trading plan aligns with this perspective, a favorable short setup appears to be forming with a quality risk-to-reward ratio. Bias: Short-Term Bearish / Corrective Entry: Around current levels (~$113,000 - $114,000) Stop Loss: A defined stop above the recent swing high at ~$126,500 is crucial. Risk management is our anchor in the stormy seas of probability.Take Profit: Targeting the ~$89,000 - $100,000 area. As shown on the chart, this provides a favorable risk/reward ratio of nearly 1:2. The Philosophy Behind the Chart We are not here to force our will upon the market, but to flow with it. This potential downturn is not a negative event; it's the market breathing. By detaching from the outcome—from the ego's need to be "right"—we can focus on a clear process and execute our plan with tranquility. This analysis is my contribution. It is not an attempt to sell anything or gather followers, but to connect and share a part of my own journey. In doing so, we help each other see the whole picture, the Great Puzzle, more clearly. Just shine. Disclaimer: This is not financial advice. It is for educational and informational purposes only. Please conduct your own research and manage your risk accordingly. Expand 33 lineslol @ having wrapped this in pine accidentally
