
ThePipMaster01
@t_ThePipMaster01

What symbols does the trader recommend buying?
Purchase History
پیام های تریدر
Filter
بیت کوین زیر فشار: آیا سقوط به ۹۱ هزار دلار در راه است؟ (تحلیل کلیدی سطوح)
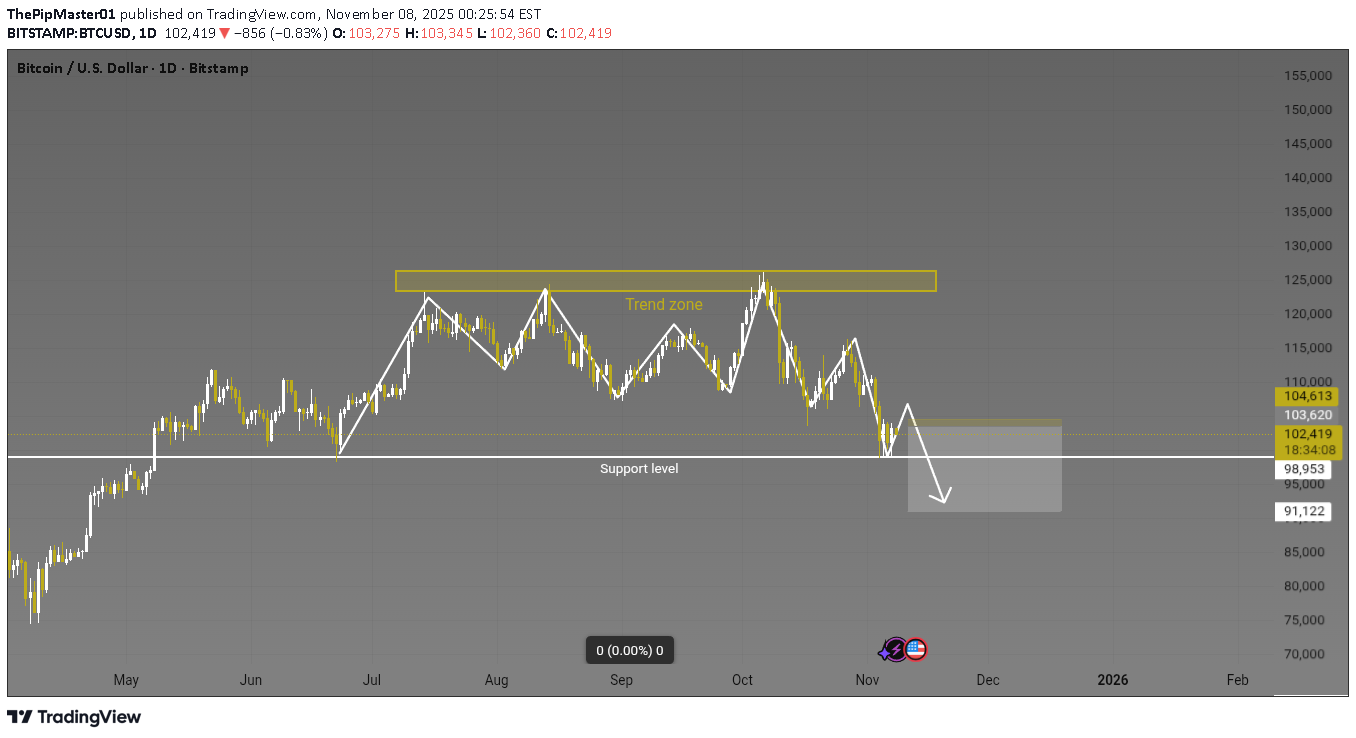
Timeframe: 1D (Daily) Exchange: Bitstamp --- 🟡 Market Structure Bitcoin has recently been trading within a defined trend zone between approximately $120,000 and $130,000, showing repeated rejections from the upper resistance area. The chart indicates a series of lower highs and lower lows, suggesting a potential short-term bearish bias. --- ⚪ Key Levels Trend Zone (Resistance): $120,000 – $130,000 Support Level: Around $99,000 – $100,000 Next Major Support Target: Around $91,000 --- ⚙️ Technical Outlook Price has recently bounced from the support level but appears to be testing the previous breakdown zone (around $103K–$104K). If sellers maintain control at this level, a rejection could lead to a continuation toward the $91K area. Conversely, a break and close above $105K could invalidate this structure and indicate renewed bullish momentum. --- 📉 Possible Scenario Bearish Case: Rejection near $104K–$105K → Move toward $91K support zone. Bullish Case: Break and close above $105K → Potential retest of $115K+ region. --- ⚠️ Disclaimer This idea is for educational and analytical purposes only. It does not constitute financial advice or a recommendation to buy or sell any asset. Always conduct your own analysis and manage risk appropriately before making any trading decisions.
طلا (XAU/USD): فرصت خرید با احتمال ادامه روند صعودی پس از شکست مقاومت!
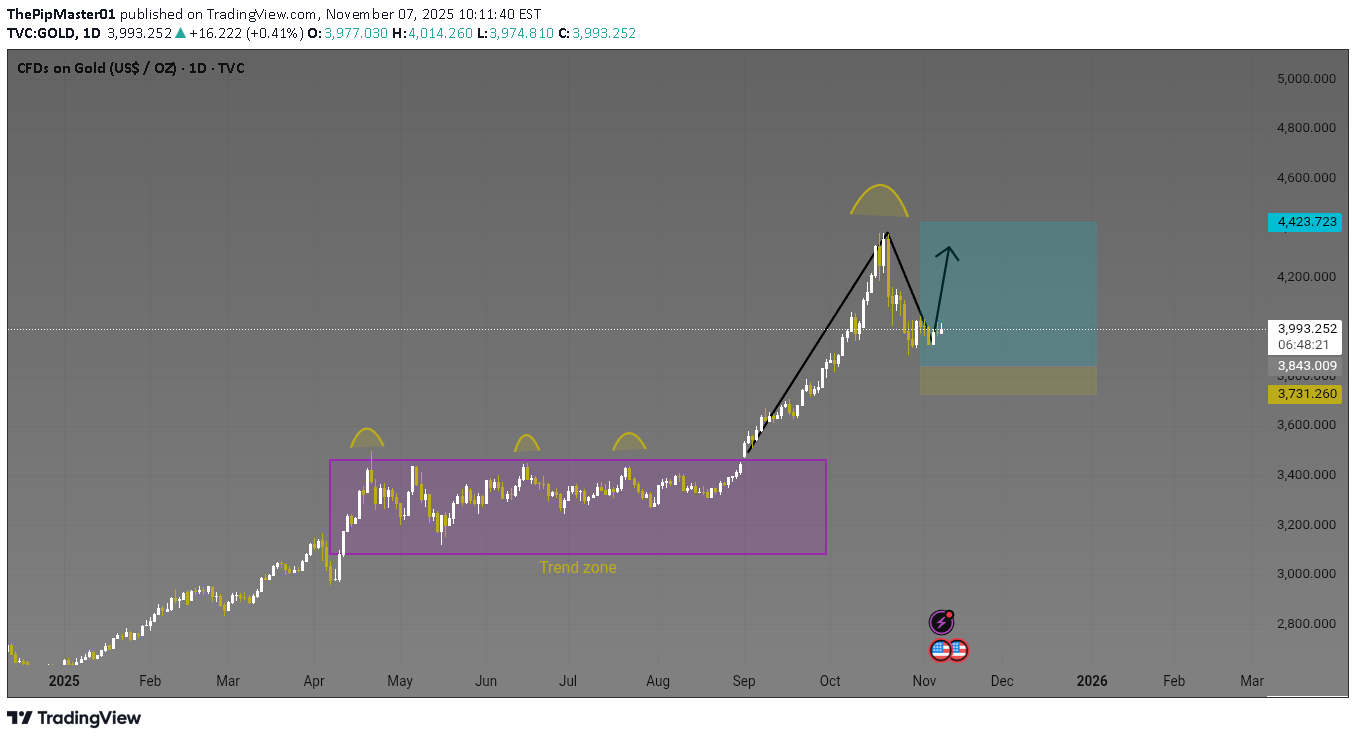
Gold has broken out of a long-term accumulation zone and is now retesting prior resistance as new support. The current pullback may offer a potential continuation opportunity if bullish momentum returns. --- 🧭 Technical View Accumulation Zone: 3,200 – 3,400 (sideways consolidation) Breakout: Strong impulsive move to ~4,200 Retest Area: 3,850 – 3,900 (support retest) Potential Target Zone: 4,430 – 4,600 Invalidation (Breakdown): Below 3,725 --- 🧩 Chart Structure 🟨 Trend Zone → Base accumulation (highlighted in purple box) ⚫ Correction Phase → Short-term pullback from new highs 🟩 Target Zone → Bullish continuation projection ⬆️ Bias: Bullish while above support --- 📚 Educational Note This setup illustrates a classic breakout–retest pattern often observed after strong trends. It’s shared for learning and analysis, not as financial advice.
Disclaimer
Any content and materials included in Sahmeto's website and official communication channels are a compilation of personal opinions and analyses and are not binding. They do not constitute any recommendation for buying, selling, entering or exiting the stock market and cryptocurrency market. Also, all news and analyses included in the website and channels are merely republished information from official and unofficial domestic and foreign sources, and it is obvious that users of the said content are responsible for following up and ensuring the authenticity and accuracy of the materials. Therefore, while disclaiming responsibility, it is declared that the responsibility for any decision-making, action, and potential profit and loss in the capital market and cryptocurrency market lies with the trader.