Technical analysis by ThePipMaster01 about Symbol BTC: Sell recommendation (11/8/2025)

بیت کوین زیر فشار: آیا سقوط به ۹۱ هزار دلار در راه است؟ (تحلیل کلیدی سطوح)
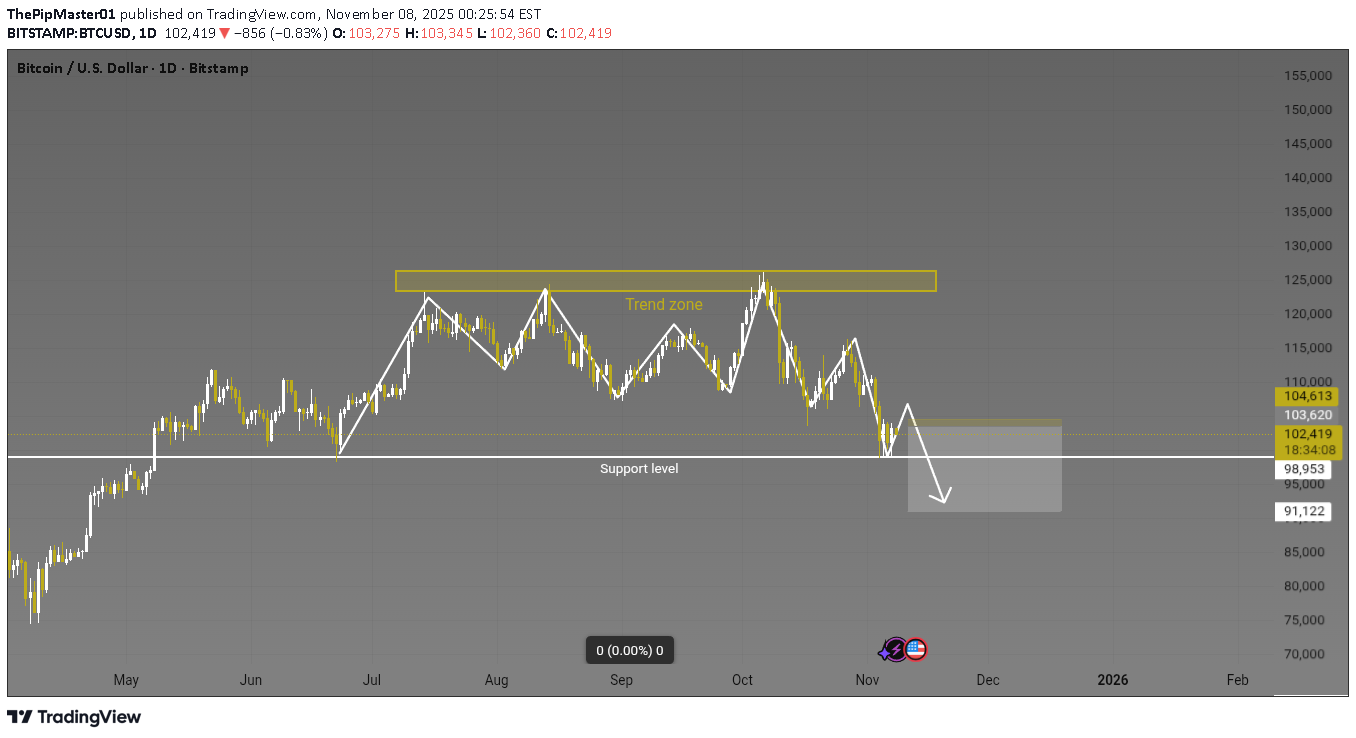
Timeframe: 1D (Daily) Exchange: Bitstamp --- 🟡 Market Structure Bitcoin has recently been trading within a defined trend zone between approximately $120,000 and $130,000, showing repeated rejections from the upper resistance area. The chart indicates a series of lower highs and lower lows, suggesting a potential short-term bearish bias. --- ⚪ Key Levels Trend Zone (Resistance): $120,000 – $130,000 Support Level: Around $99,000 – $100,000 Next Major Support Target: Around $91,000 --- ⚙️ Technical Outlook Price has recently bounced from the support level but appears to be testing the previous breakdown zone (around $103K–$104K). If sellers maintain control at this level, a rejection could lead to a continuation toward the $91K area. Conversely, a break and close above $105K could invalidate this structure and indicate renewed bullish momentum. --- 📉 Possible Scenario Bearish Case: Rejection near $104K–$105K → Move toward $91K support zone. Bullish Case: Break and close above $105K → Potential retest of $115K+ region. --- ⚠️ Disclaimer This idea is for educational and analytical purposes only. It does not constitute financial advice or a recommendation to buy or sell any asset. Always conduct your own analysis and manage risk appropriately before making any trading decisions.