
TheGemHunter
@t_TheGemHunter

What symbols does the trader recommend buying?
Purchase History
پیام های تریدر
Filter
TheGemHunter
MSTR Analysis: Potential Major Wave Bottom

MSTR has printed a significant spinning top candle at the 1.272 Fibonacci extension of Wave AB, marking a slightly lower low. This area could serve as an ideal spot for a major wave bottom, provided it holds. Market Structure Thesis; Regular Flat (3-3-5) Wave A: Corrective, overlapping 3-Wave structure Wave B: Overlapping 3-Wave structure retraces deeply, not exceeding the start of Wave-A Wave C: Strong, impulsive move down of 5 waves that exceeds the end of Wave-A A Closer Look On the 2-day chart, a valid 5-wave impulse down that precisely tagged the 1.618 of Wave-B with notable RSI bullish divergence. Also, MACD has crossed the signal line, suggesting bullish momentum.👇👇👇 What Often Follows A Regular Flat? Reaction bounce (often sharp) Common retracement to: 0.382-0.5 of Wave-C OR back toward Wave-B Validation: Price must stop making lower lows. Invalidation: A decisive break below the Wave-C low, not a wick, but a CLOSE. If Price: Makes a lower low after the supposed Wave-C completion, the flat is not finished. Either; C is extending toward the 1.618 fibonacci extension of AB OR this is not a flat Key Levels To Watch The current Wave-C low for validation and the 1.618 retracement of Wave-B for support. A confirmed stop in lower lows would signal that this regular flat may be complete, setting the stage for a significant reaction move. Crypto Traders: MSTR is historically known for being a leading indicator for Bitcoin. So, if MSTR bounces from here, perhaps BTC will follow. Good Luck! - Not Financial Advice-
TheGemHunter
Can AXS Recover?
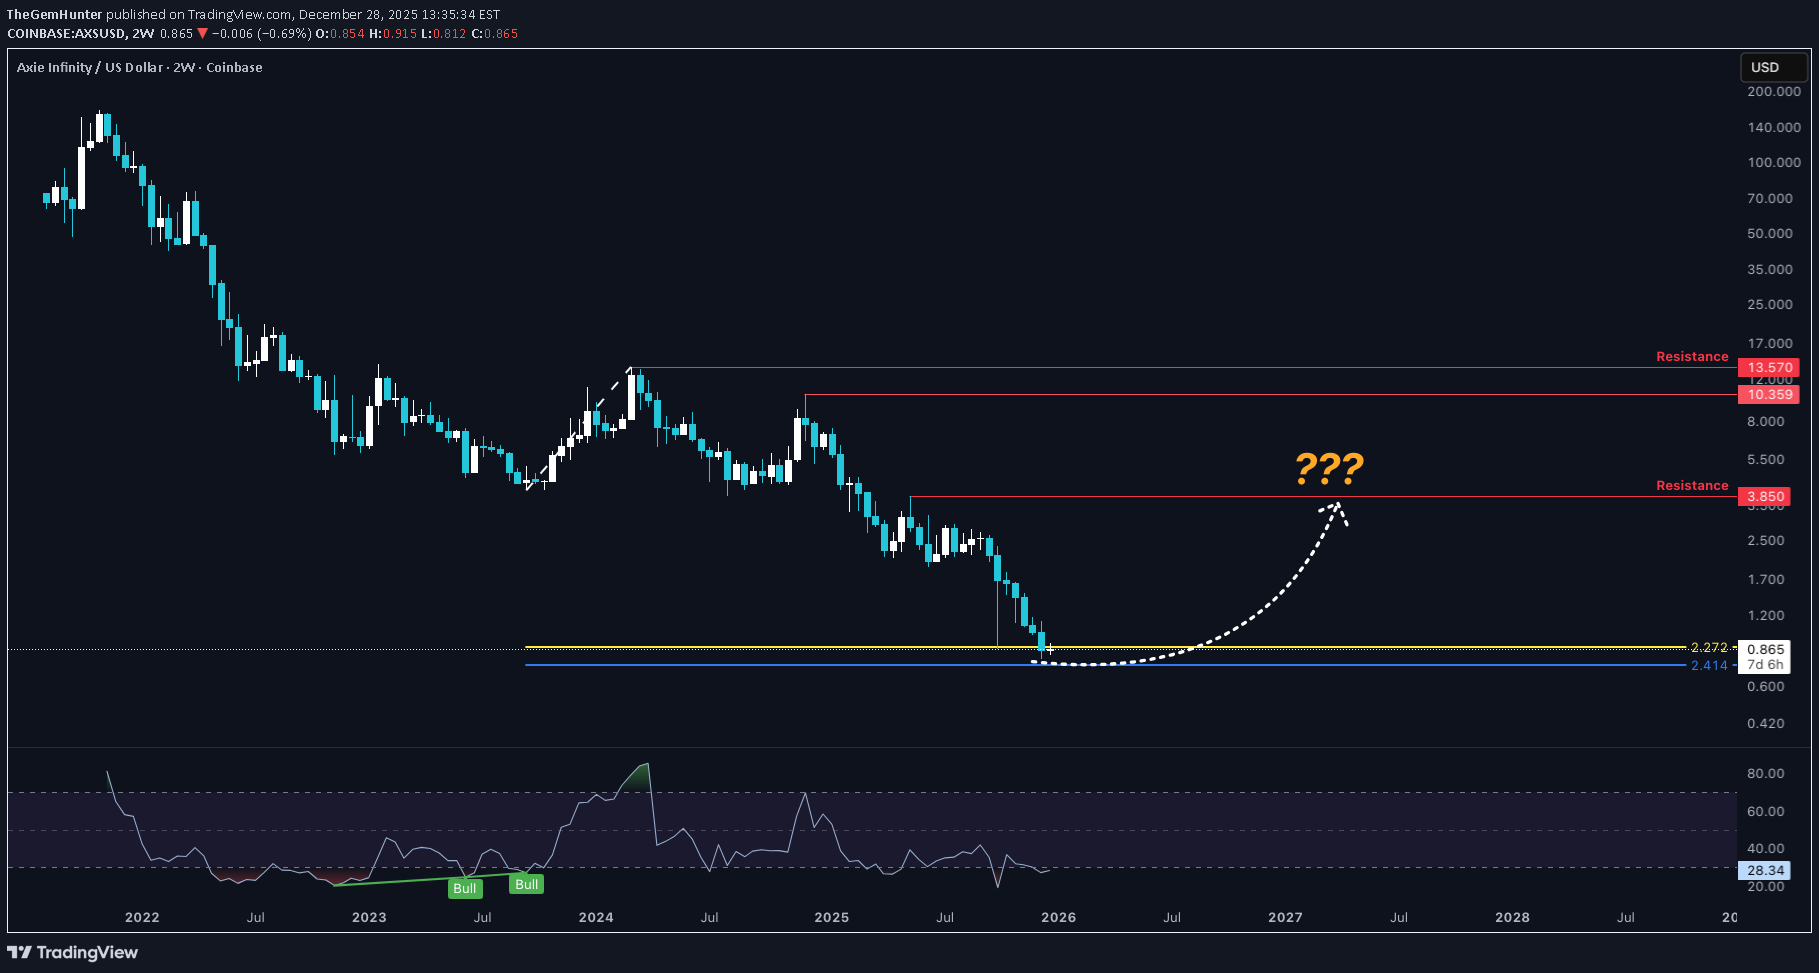
AXS has been on a downtrend for some years, but could this be the area of accumulation? Price currently in a 2.272 window, which price has tagged before in the past, making a quick liquidity sweep. RSI Bullish Divergence is printing. On a LTF price made a slightly lower low off of a minor wave 2.272; an ideal place for a Secondary Test where price "checks the floor". 👇👇👇 If this area does turn out to be the floor, signs of accumulation will show and Automatic Rallies to the upside will occur. -Not Financial Advice-
TheGemHunter
تحلیل بیت کوین: نقطه عطف حیاتی برای آینده بازار ارزهای دیجیتال (صعود یا اصلاح؟)
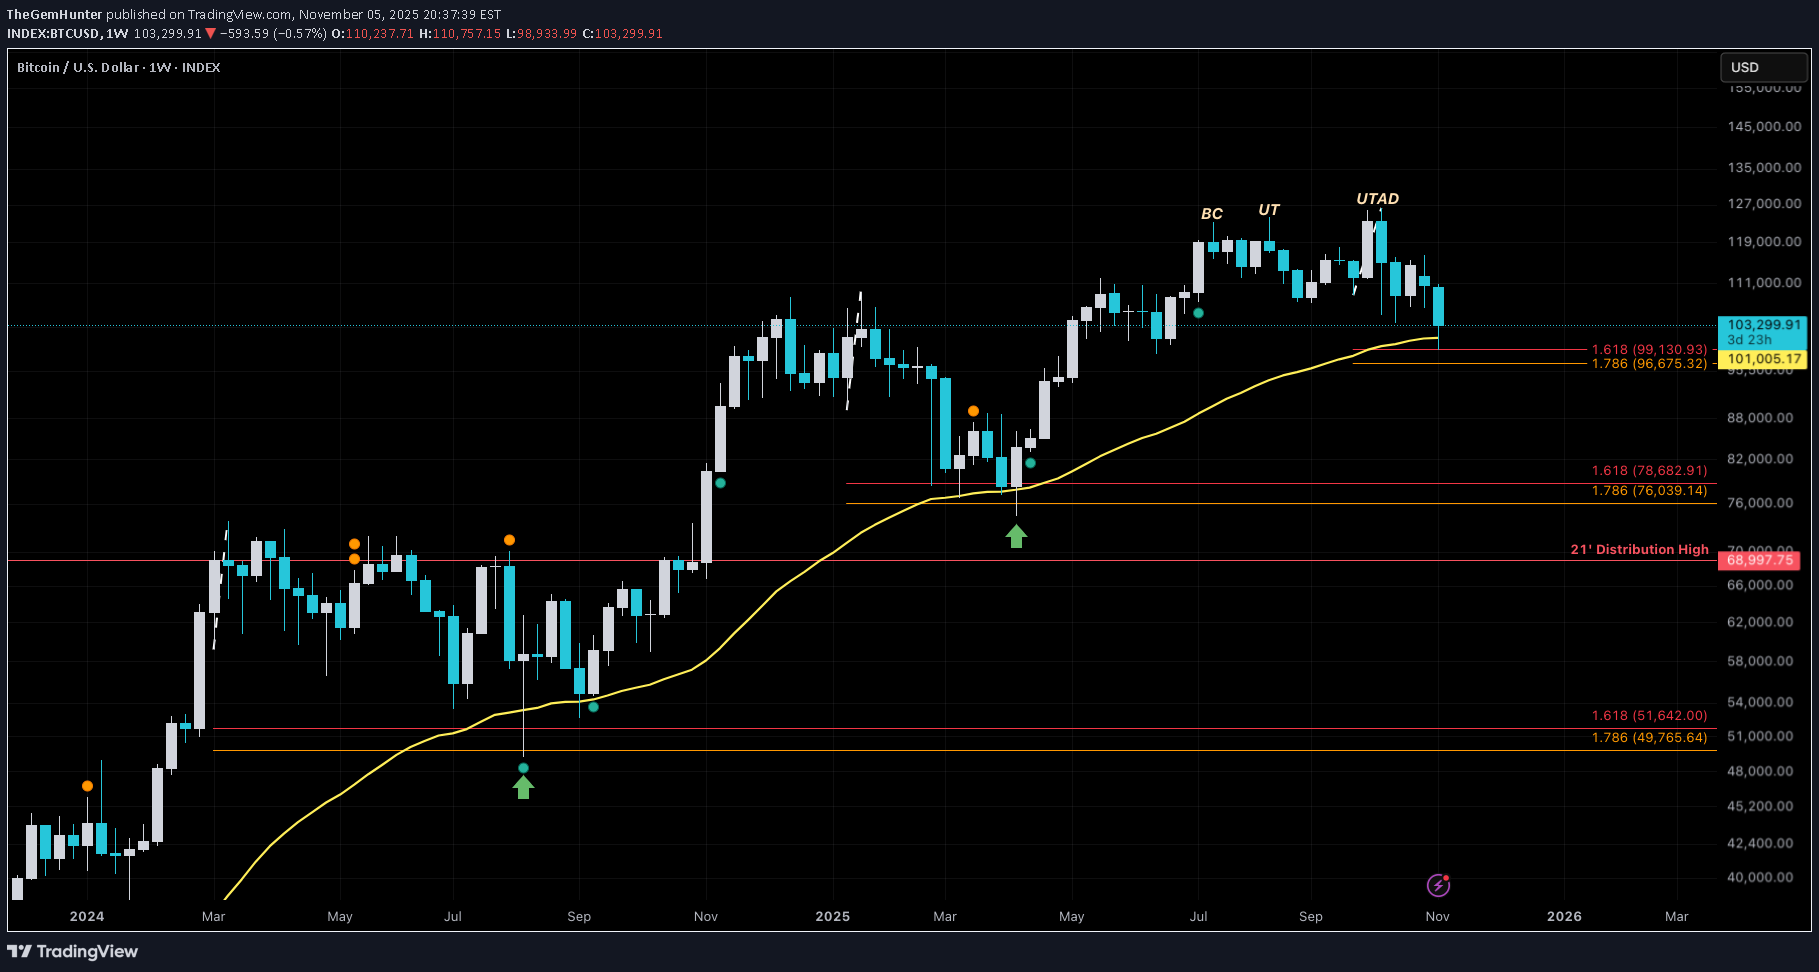
1-Week Chart: Historically, BTC has bounced from the 50 EMA, which includes the 1.618 GW, and what always follows is the high volatile whipsaw. This chart would be a major clue as to the future direction and momentum of the trend: Bearish Outlook: Candles close below the 50 EMA New Candles print underneath the 50 EMA Bullish Outlook: Price continues to find support on the 50 EMA Slightly lower lows that respect the 50 EMA with a spike in buying volume This area looks like the crossroads for BTC and the overall crypto market. It's possible that we will be moving sideways in this area for the next month. We could expect stop hunts and 1W engulfing candles from the bots. So, this next month will be the moment of truth that reveals; Continuation to the Upside OR Further Correction. - Not Financial Advice-
TheGemHunter
احتمال جهش بیت کوین: آیا کف کاذب شکل گرفته یا فقط نفس تازه کردن قبل از سقوط بزرگ؟
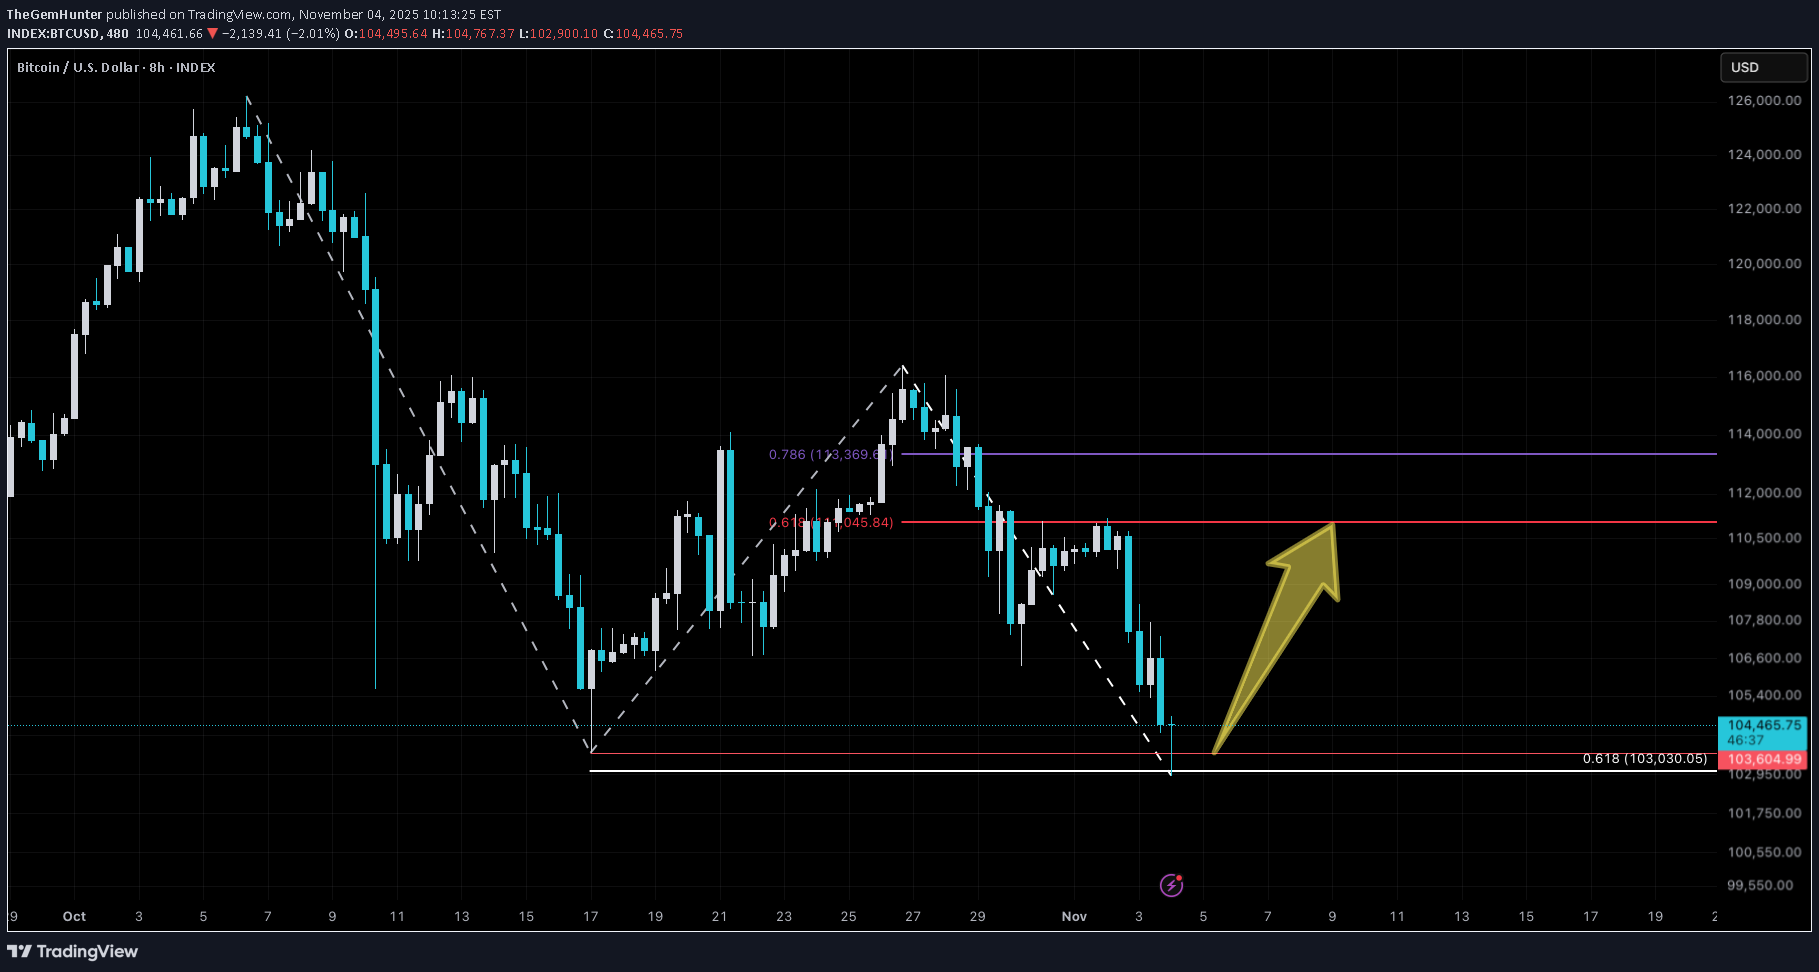
BTCUSD BTC just made a very obvious slightly lower low liquidity grab, plumb on the 1:0.618 GW. This suggests a bounce in the market. Strengthened by the bearish engulf candle on the BTC.D 4H chart that followed the tombstone doji. 👇👇👇 USDT.D also made a slightly higher high inside the 1:1 GW 👇👇👇 So there may be some relief for the bulls the next few days. But, beware of the volatility/whipsaw. BTC may be faking the funk (Dead Cat) before a huge smack down. There are a few H&S patterns that have not been finalized in stable coin charts and OTHERS. So tread cautiously. Good Luck Players! -Not Financial Advice-
TheGemHunter
AAVE is cooked
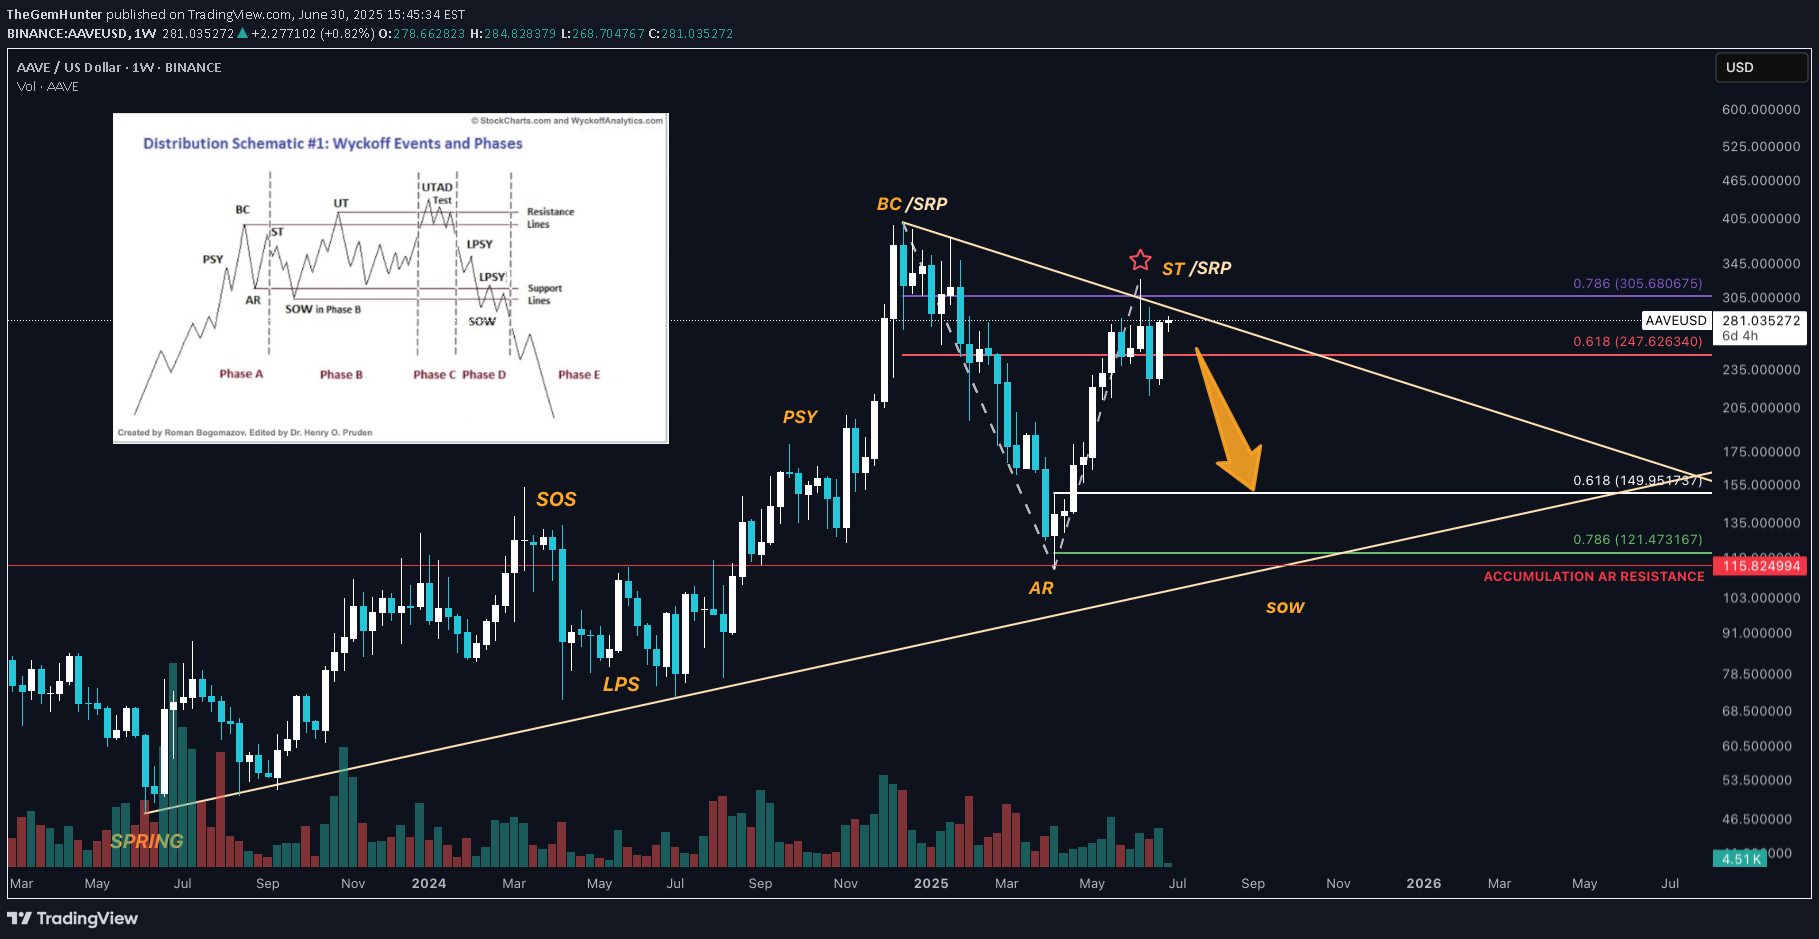
AAVEUSD AAVE is moving along nicely through its cycle and events. Rhyming very well with Wyckoff Distribution schematic. Since it's buying climax it has dipped to print an AR (Automatic Rally) and is now printing in a ST (Secondary Test) zone. A shooting star through the 0.786 printed earlier this month; a major clue that this area is exhausted and may be ready for a retracement to the down side. Currently there is a SRP (Shake-out Reversal Pattern) printing before making it's next HTF move. A "come-back" can be expected with this asset to later print a UT/UTAD (slightly higher high); considering its strength. The lower demand line may prove to be adequate support. Or, even perhaps the 1:0.618 window.
TheGemHunter
BTC High Time Frame Pivot???
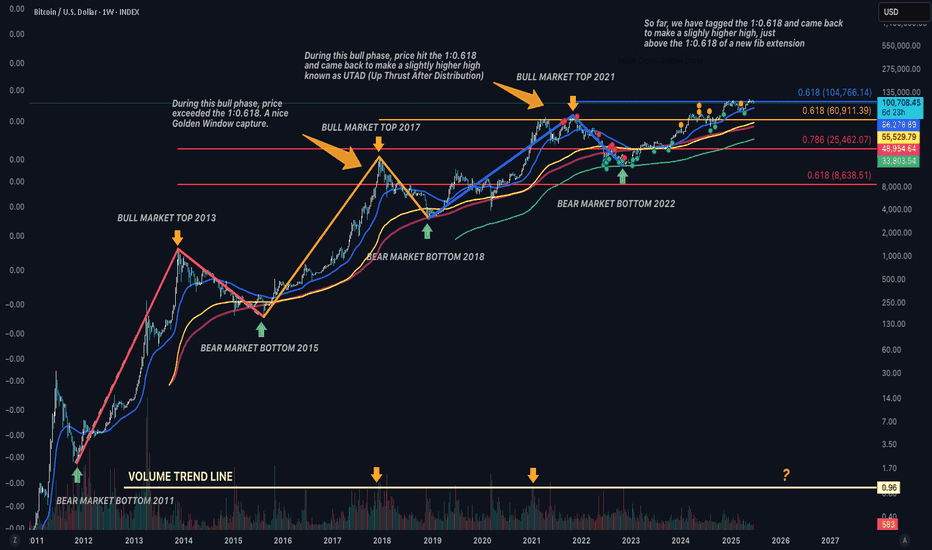
BTCUSD TOTAL In this publish I will be taking a deep dive into BTC and it's historical data that may give clues to its future whereabouts/performance. I will be using the Fibonacci extension and retracement tool with "logarithmic mode on" in the settings, as well as logarithmic mode enable on the chart. In the above chart; I have fibonacci extension levels plotted that are based from pivots of bear market bottom to bull market top, then back to next bear market bottom. This will capture the entire performance of each cycle to give the next projected top. Each fib level is color coordinated to the pivots it has been projected from. Taking a look at the bull market top of 2017: Price reached well above the 1:0.618 and inside the 1:0.786, this was a nice golden window (inside the 0.618 and 0.786 level) capture here. It was a single top with no confusion about it. Next, the bull market top of 2021: Price printed a shooting star through the 1:0.618 and came back to make a slightly higher high, which is a "Wyckoff Distribution Event" known as UTAD (Up Thrust After Distribution). Notice the bear market that followed; price found support on the 500 EMA (green ribbon) rather than the 200 SMA (maroon ribbon) as it did the previous bear market. This suggests a loss of momentum. Now, Looking at price action that has printed since the beginning of 2025, price hit the 1:0.618 back in January and came back to print a slightly higher high in May, marking a potential UTAD event. So, questions arise, is BTC topping in this area? And, could this cycle be coming to an end? I do believe we will see pull back, a possible "Mini Distribution" event. And I say mini distribution because during previous bull market tops, volume has peaked and tagged the volume trend line that I have plotted at the bottom of the chart. So far, since the last bear market, volume has been weak and hasn't come close to tagging that area, even despite the substantial increase in BTC.D. On another note: a possible "Black Swan" event. The last black swan event was the COVID-19 pandemic; Price went from $13,870 down to $3,880, approx. a 72% drop. That is close to the percentage loss of bear markets. 👇👇👇 During the crash, price tagged the 0:1.618 window of a reverse fib retracement, and what followed was a nice "V-shape" recovery (Bullish Engulf on a higher time frame). So, this shows that the market can recover strong after a global pandemic and rather quickly. Assuming that this a wave top that has printed recently, and assuming that this could evolve into a black swan event, we could predict that BTC could tag the higher time frame 0:1.618 again, based off of historical data. If this be the case, it would be approx. a 50% drop in value, bringing BTC close to mid 50K price range. 👇👇👇 If support were to break at that level, it could result in the start of a bear market, and possibly, that price could tango with the 500 EMA (Green Ribbon) yet again. So, this is a very dangerous area here, given the technicals. Perhaps the bears may have a ball here. Let's take a closer look through the smaller time frame 1D chart: Within March and April - price found support at the lower time frame 0:1.618, plotted with a reverse fib retracement. 👇👇👇 We have a similar topping pattern here since printing the slightly higher ATH. Given the bullish wick that printed yesterday (Green Arrow Markup), we could assume that a minor wave up could be baking. If it indeed cooks and rejection were to occur around the $104,766 level, this may be an indication that continuation to the downside will resume. The next key level of support is the LTF 0:1.618 window, roughly between 92-93K. If support breaks at that level, this increases the chance that the higher time frame 0:1.618 (mid 50K) will be the stomping grounds. KEY TAKEAWAY: If price were to make a bounce back up; look for rejection at the $104,766 level. If continuation to the downside resumes thereafter, look for support at 92-93K. If support were to break there, this increases the chance that price could retrace to the mid 50K range. If it collapses at 50K, say hello to bear market with price around the 500 EMA on the 1W chart. Good Luck Traders! -Not Financial Advice-
TheGemHunter
POTIENTIAL Dead Cat Bounce baking...
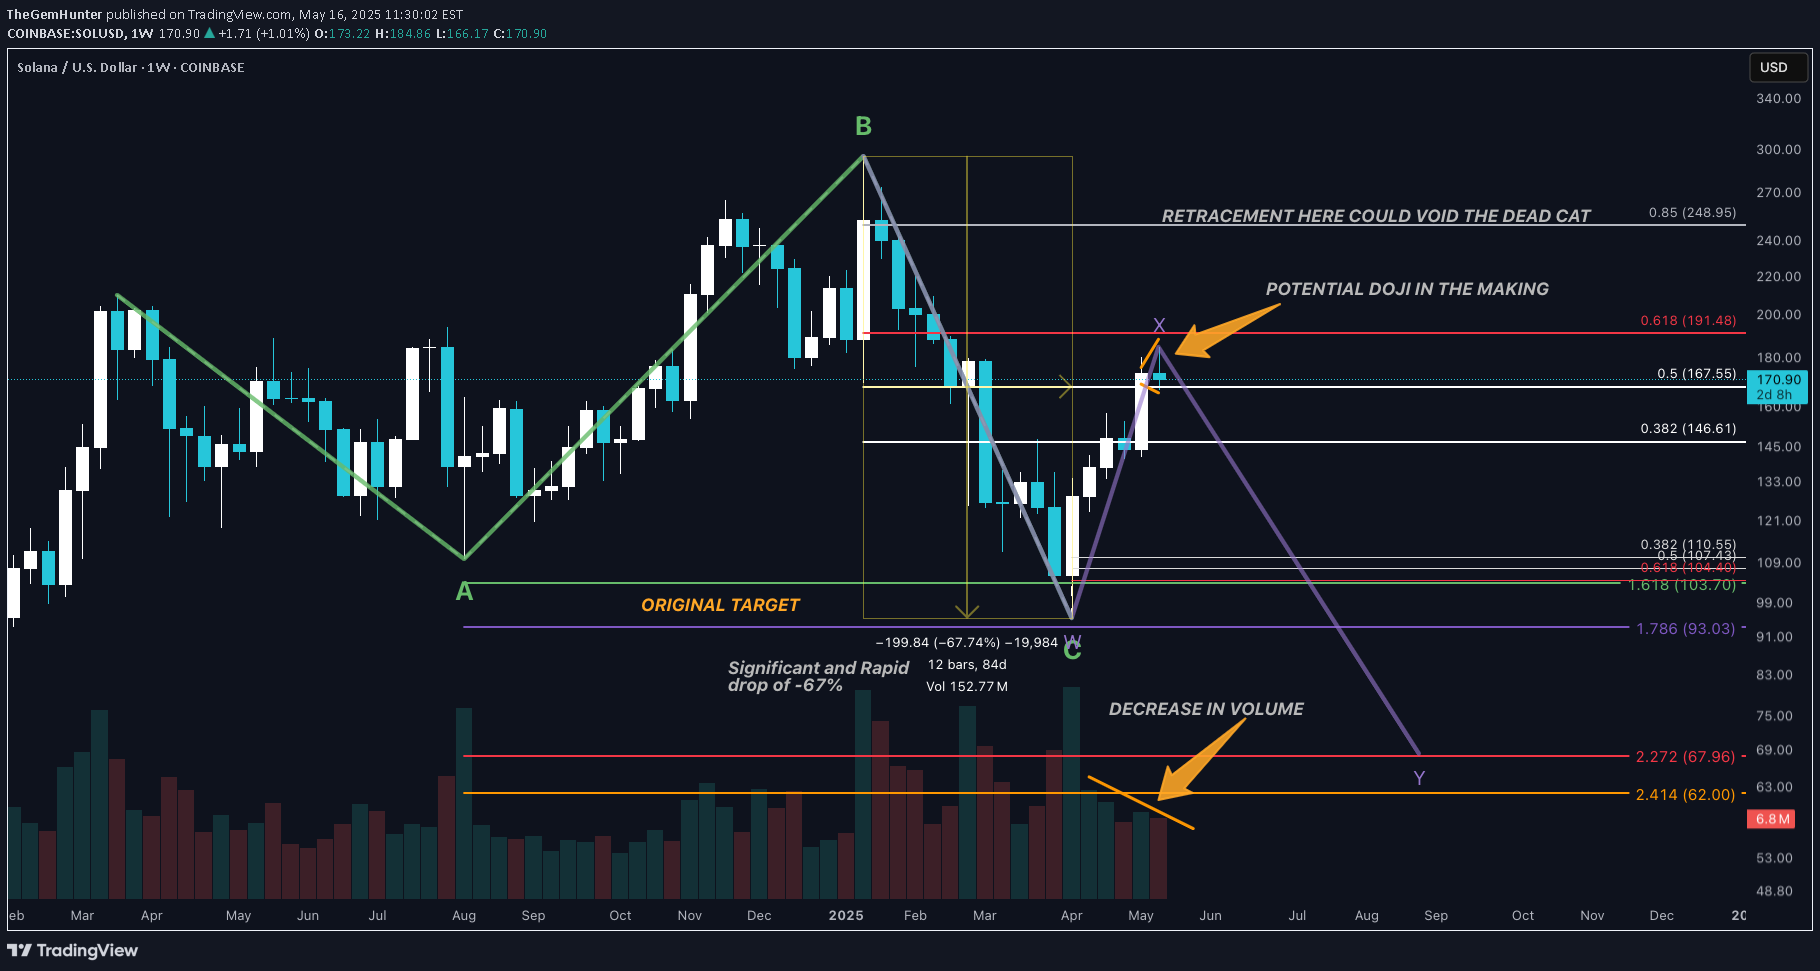
SOL has recovered nicely after it's 67% loss, and is one of the strongest large cap coins this run up. It's currently right below the 0:0.618 of the previous wave down and forming a broadening wedge on a smaller time frame. So, the question arises...is this a true recovery or is it a dead cat? It can be challenging to discern the difference, but there could be clues that strengthen the TA. 1) The broadening wedge (Which could morph into a diamond top) below the 0.618 is suspicious. On the 1day chart it is getting rejected by the 200 SMA and RSI bearish divergence is starting to show. 2) Volume has been decreasing since the beginning of the recovery. 3) There is a potential doji candle in the making on the 1W time frame, with 2days and 8 hours until closed. 4) USDT.D came short of a LTF 1:1 3 wave correction, so there is a chance that it could come back and try to reach that target. It is printing a potential doji on the 0:0.618 retracement with increased buying volume. To void the dead cat, we would have to see a higher or equal low of retracement to the downside if this is a wave top. Or at least a 0.85 retracement to the upside if price continues up. So, this could be wave X of a WXY correctional pattern. On a larger time frame it appears the ABC pattern is complete, but could form a deeper C wave bottom. If the dead cat does bounce, how far could price continue downwards? There is a strong ratio band of support, the 1:2.272 on higher TF (around 67.00). This TA is not meant to scare, nor is it recommended to take action in re-organizing your assets. It is intended for educational purposes only. Calling a dead cat is a gutsy move, so often, most of those calls don't always play out. But analyzing real time price action and historical data is all we can do to help determine those potential moves. I will try my best to keep this publish updated, and provide potential clues. So, when you do see other traders provide constant updates, please hit the BOOST button, as this requires a lot of dedication and time, and it shows that they care. Key Take Away: Look for higher local highs to the 0.85 to void the dead cat, or a higher/equal low.Thanks, and Good Luck! - Not Financial Advice -
TheGemHunter
Gold at it's Peak Now???

Gold has pushed right though the HTF 0:1.618. Now catching resistance at the 1:2.414 ratio band. If it pushes through this ratio, there is not much stopping it from hitting the upper 2.272 level. If a correction were to start here (and it's about that time) this may be a clue that a rally up for crypto will begin soon, as this was this case for the last Gold correction that started in November 2024. -Not Financial Advice-
TheGemHunter
SMART MONEY

ORCAUSD ORCA had a nice rally up from its previous LPS event showing its strength, bolting on a 10X plus. It looks to be sitting at the next LPS event (right at accumulation resistance); this is where smart money starts coming in. It could retrace deeper: I have the 1:1 extension window that signifies strong support with the 1:13 overshoot. And slightly under the overshoot is the POC. There is a chance that it does not hit that support structure, but never impossible. This is a DeFi token, and DeFi is a strong narrative this cycle. However: This token is built on the Solana blockchain rather than Ethereum, so the pump action is more likely to rhyme with Solana pumps than Ethereum. -Not Financial Advice-
TheGemHunter
SUKU in ST Territory

SUKUUSD SUKU has printed a ST in phase B of Wyckoff phases and events. However, because Phase B is still about building the cause, this asset may still experience more shakeouts or a deeper Spring before a true markup. I have a potential lower support structure (0:1.618 window) if that spring were to occur. With a Market Cap of 15.7M this volatile micro-cap could bring in multipliers. SUKU is a blockchain-based ecosystem designed to provide transparency, traceability, and decentralized finance (DeFi) solutions for supply chains, metaverse applications, and Web3 projects. -Not Financial Advice-
Disclaimer
Any content and materials included in Sahmeto's website and official communication channels are a compilation of personal opinions and analyses and are not binding. They do not constitute any recommendation for buying, selling, entering or exiting the stock market and cryptocurrency market. Also, all news and analyses included in the website and channels are merely republished information from official and unofficial domestic and foreign sources, and it is obvious that users of the said content are responsible for following up and ensuring the authenticity and accuracy of the materials. Therefore, while disclaiming responsibility, it is declared that the responsibility for any decision-making, action, and potential profit and loss in the capital market and cryptocurrency market lies with the trader.