
TheAlphaView
@t_TheAlphaView

What symbols does the trader recommend buying?
Purchase History
پیام های تریدر
Filter
Signal Type
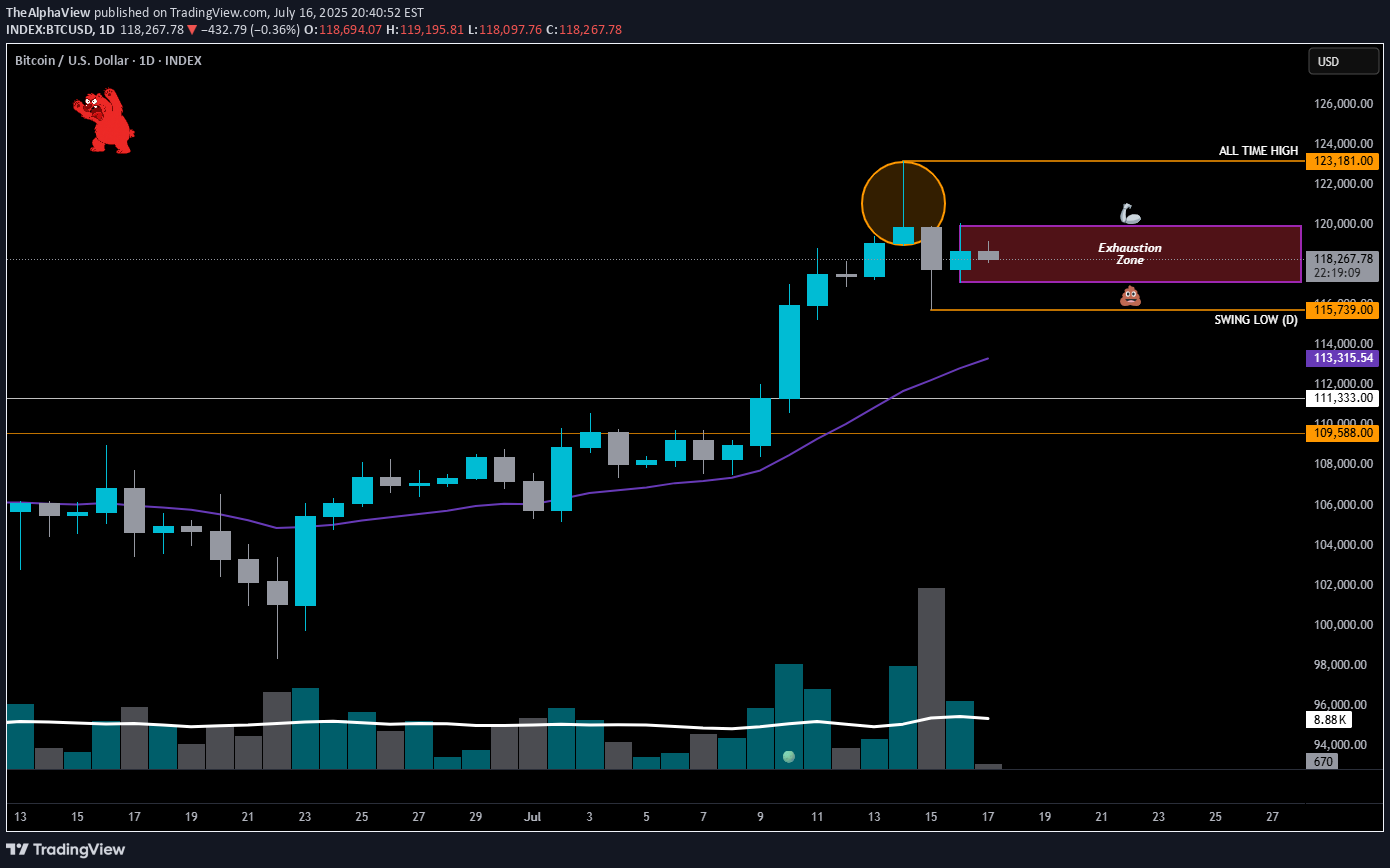
Upper Wick Rejection Candle 🔶 (Orange Circle) 🔍 Candle Breakdown | July 14, 2025 • Opened near the lows • Rallied intraday to $123K (ATH) • Closed well off the highs, just above $119K • Long upper wick = rejection of higher prices • Elevated volume = signal is valid, not noise 🧠 Translation: Bulls charged into resistance. Sellers didn’t flinch — absorbed the move and slammed price back down. The result? “Exhaustion Candle.” 📦 Exhaustion Zone (Purple Box) This is the real battlefield. If BTC fails to close above 119.5K by Friday, we likely get Manipulation over the weAkend: 🔄 Chop & Range Behavior • Consolidation between ~115K support and ~120K resistance • Classic pause before either expansion or collapse 🔻 Retrace Scenarios • 21 EMA at $113K • Breakout retest near $111K 💡 If we close the weAk closer to $111K than $125K… gravity’s working in favor of the HIGH powered short Zone again! MMM still sTRONg — but without a decisive breakout above $125K, I might just be dancing with the market makers for once. 🧘♂️ Breathe in. Kill the ego. sTAY sHARP. Execute. 100% not financial advice, for edutainment purposes only!🔻 BTC Exhaustion Zone Update 📉 Bias: Leaning Bearish — unless BTC reclaims $118.8K+ 🎯 Support: $117.2K 🚨 Break below = continuation to $115.5K → $113.7K 🤓 Unbiased Take • Macro trend = bullish, but short-term momentum is fading • BTC is compressing across timeframes — coiling for a volatile breakout •🐂 MUST defend $117K or the bears get the steering wheel ✅ Bullish Case • Wait for a strong close w/ volume reclaiming $118.8K • Targets: $119.5K, then $120.5K • Above that, we retest ATH ✅ Bearish Case • Look to short failed bounces under $118.3K • Breakdown confirmed w/ close below $117.1K • Targeting the flush: $115.5K → $113.7K 🕰 Today’s Close: $118,014 😅Closer to $125K than $111K, sure — but momentum is leaking. ⚠️ If we drop back below the exhaustion zone, next stop is $115K. And if that cracks? The High Power Short Zone stays alive... and the gravitational pull gets heavier. 📉 Better to take the air-conditioned elevator down late than jump out the window with the bears. Stay Sharp! Compression breeds chaos. Stay Safe! The 🐋R hUNTING! 100% not financial advice, for edutainment purposes only!
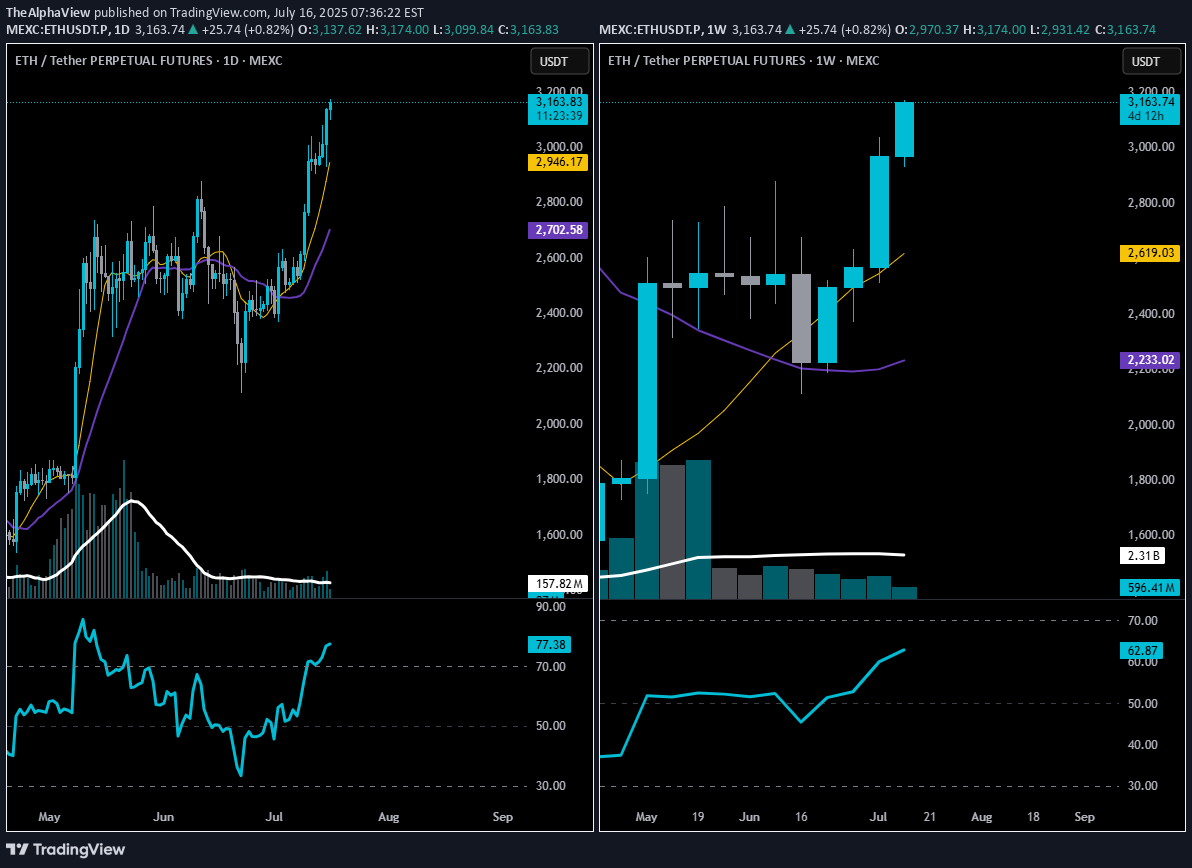
🕐 Daily Chart Analysis Trend: Clear uptrend. Price is trading well above both the 9 EMA (gold) and 20 EMA (purple), with strong angle and separation. Price Action: ETH is pressing into multi-month highs with no major resistance between here and the $3,350–$3,500 range. Volume: Healthy increase in volume on bullish candles; recent bullish expansion looks organic, not low-volume driven. RSI: At 77.15 — yes, overbought, but in a trending market, this is confirmation, not a sell signal. You want RSI to stay elevated during impulsive legs. 📅 Weekly Chart Analysis Breakout Structure: This is the second full bullish candle after breaking out of a multi-month base ($2,800 range), following an accumulation period. 9 EMA Just Crossed Over 20 EMA: First time since early 2024 — bullish trend confirmation. Volume: Large expansion bar from May shows institutional interest; current bar remains strong and building. RSI: Pushing up to 62.75 — well below overbought, meaning there’s room to run. 🧭 Strategic Trade Plan (Swing Long) ✅ Bias: Long Targeting $3,300–$3,500 with trailing logic to extend if momentum continues. THIS IS NOT FINANCIAL ADVICE. Drinkin Smöökëē Whizkee. Edumacational Purpiz Only!ETH is in the green, but signs of cooling are showing after a strong breakout leg. Now’s the time to tighten the plan: 🔒 Protect gains 💰 Take profits strategically 📉 Consider scale-in — but only if the setup justifies it. Stay Sharp. No chasing.Take Profit Level 1 HITSecond TP 🎯 not reached — Took Profit anyway, letting the rest ride. Eyeing 🩳-term- 🩳 🧠 Tactical Value of That Take-Profit: If price breaks out 🚀 — you're still in the game. If it breaks down 🩻 — you sold strength, not weakness. Stay cool-headed during the chop. 🧊 This is pro rhythm: ⚖️ Scale in on trend acceleration. 🔻 Scale out on exhaustion. 🔄 Leave room for the next move. Stay Sharp. Execute the Plan.Potential consolidation incoming. Closed. Nice Run!
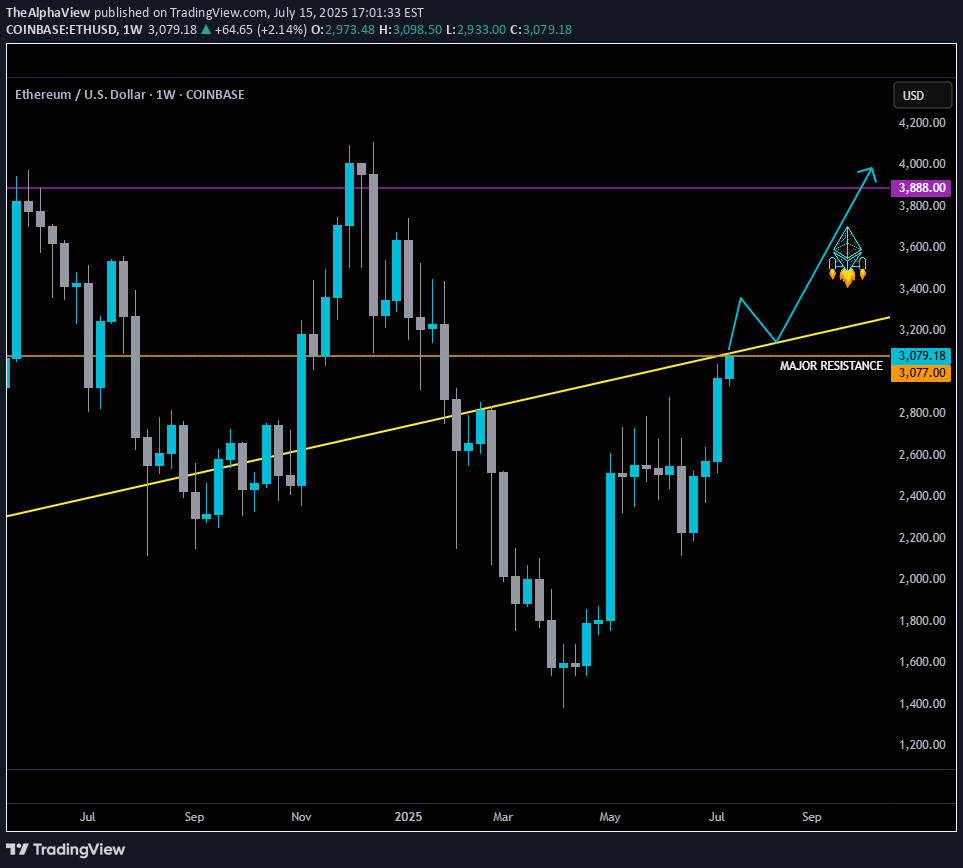
Something BIG is brewing with #Ethereum... 👀 And it’s being quietly triggered by a law almost no one was talking about, till today. A new rally could be closer than you think. Here's the full story 🧵👇 Last month, the U.S. Senate passed the Genius Act — the first serious law aimed at regulating stablecoins. Sounds boring? It's not. Because this act could light a fire under ETH... and hardly anyone sees it coming. Stablecoins like USDC will soon have clear rules to follow. That opens the doors for banks, funds, and institutions to use them legally — and massively. And who benefits most from that? You guessed it: Ethereum. Ethereum hosts nearly 50% of ALL stablecoin supply. It's the core infrastructure of the stablecoin economy. That means: More stablecoin adoption → More activity on ETH → More gas fees → More ETH burned. And it doesn’t stop there. Right now, Ethereum handles about 60% of all stablecoin transactions. Tron is in second place… with just 15%. This is ETH's game to lose. Here’s where it gets juicy: ETH gas fees = ETH getting burned. Rising stablecoin usage doesn’t just mean more revenue for the network… It means less ETH in circulation. And you know what that does to price. Oh — and the smart money knows. Since mid-2024, ETH whales have been quietly accumulating. Whale holdings just hit their highest level since 2021. Last time that happened? Right before a massive rally. Also… Ethereum activity is already spiking on-chain. Transaction volume is rising, fast. The last two times we saw this setup? 🔹 2016–2017 🔹 2020–2021 ETH went on to crush ATHs both times. Circle — the company behind USDC — just IPO’d in June. Their stock? Skyrocketed! The stablecoin dominoes are falling fast... And Ethereum is sitting at the center of it all. To sum it up: ✅ Regulatory clarity (Genius Act) ✅ Institutional greenlight for stablecoins ✅ ETH is the foundation ✅ Whales accumulating ✅ On-chain activity heating up ✅ Supply burn kicking in The House just rejected a key vote on the GENIUS Act. 🚨 Regulatory momentum just hit a speed bump — but the charts will tell you the real story. Pass or fail... ETH might just be setting up for a monster move. Here’s the set up… If ETH can secure a Weekly close above the orange major resistance and confirm a breakout above the yellow ascending trendline, we could experience LIFTOFF. 🚀 NFA... For edutainment purposes only!
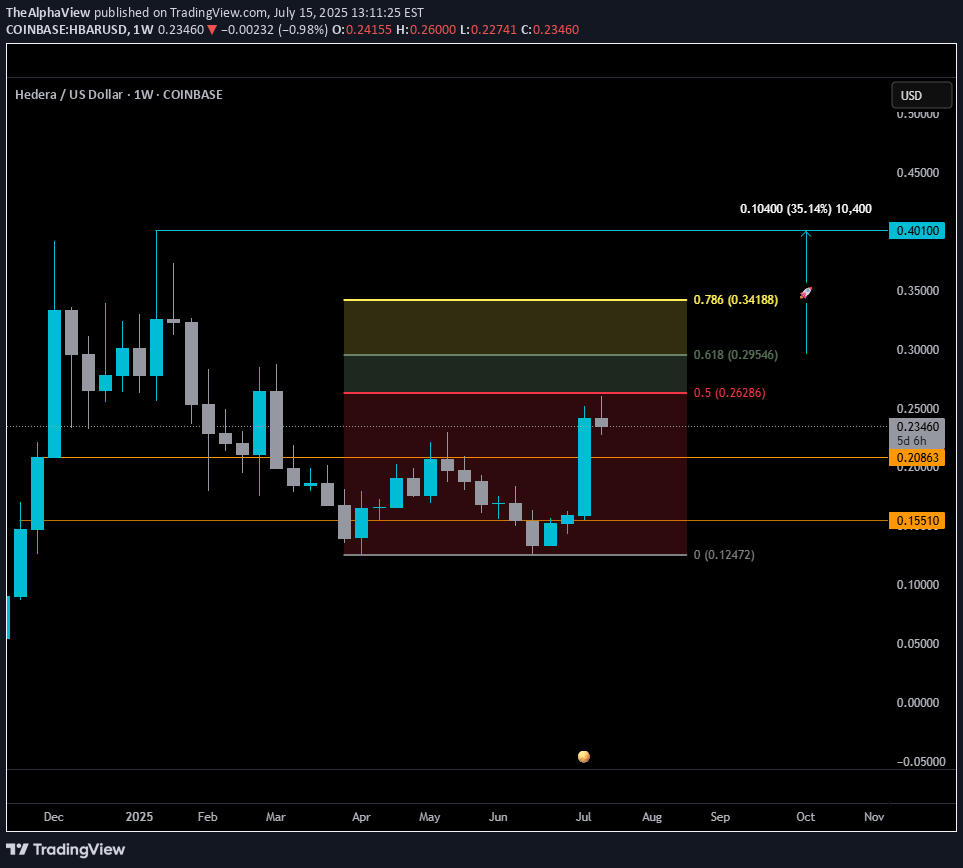
Hedera is attempting to catch some momentum alongside the broader ISO20022 narrative, but from a technical standpoint, here’s what matters right now: 🔍 The 0.5 Fib level at $0.26286 is critical. During last week’s #bUCKmOON the candle came close but ultimately failed to close above it — a clear sign of rejection. Until we see a confirmed weekly close above that level, this move remains a potential fakeout rather than a breakout. ⚠️ If HBAR can secure that close, the next key area is the golden zone. A break into this zone would suggest bullish momentum is gaining strength, with a potential target at $0.401 — roughly 35% from the .618 Fib. 🟥 On the downside, as long as price stays under the 0.5 Fib and in the “red zone,” don’t expect much follow-through. Price will likely continue to range between the two well-defined orange lines: •Support: $0.15510 •Resistance: $0.20863 These levels have held consistently throughout 2025 and should continue to act as key pivots. 📌 In summary: — No weekly close above the Red Zone = range-bound behavior — Break and hold above the red zone = potential entry into bullish continuation — Golden Zone = area to monitor for acceleration or reversal Stay Sharp and Disciplined. Wait for the setup, confirmation is 🗝️. THIS IS NOT FINANCIAL ADVICE. DrAnkin Smöökëē Whizkee. Edumacational Purpiz Only!
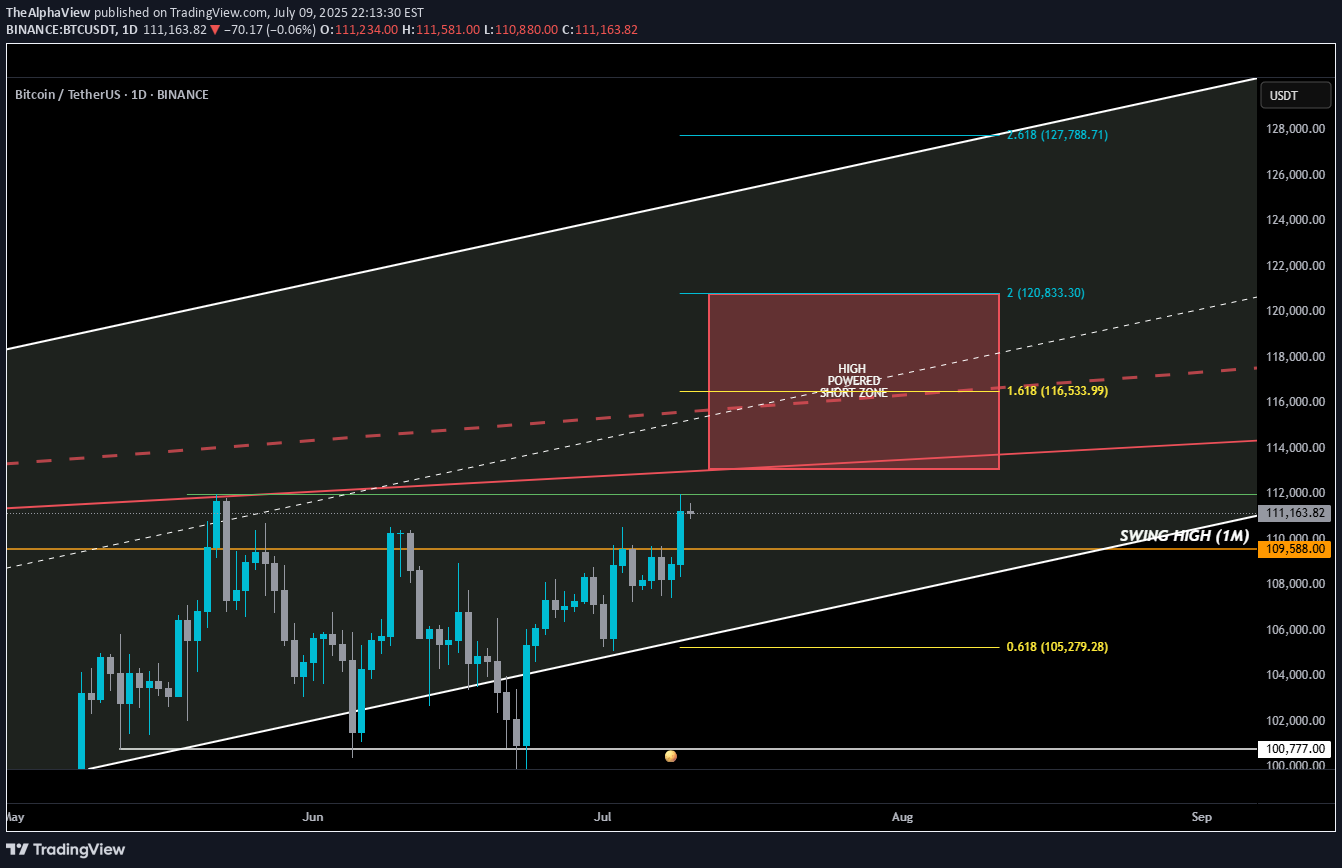
HIGH POWERED SHORT ZONE ⚡️Usually, a 3% move doesn’t make anyone blink—but this one? It sent BTC into all-time high territory. I almost popped the champagne… until I remembered I’m in a short.Not because I don’t believe in upside—but because my add zone in the HIGH POWERED SHORT ZONE hasn’t been tagged. Yet.Here’s the breakdown 🧵👇________________________________________Before anyone goes bUCK wilD and cracks open that dusty bottle of Veuve, double-check something:📅 The July 10th daily candle needs to close above the monthly swing high (orange line).If BTC bulls lock that in, then a move deeper into the HIGH POWERED SHORT ZONE becomes real... play-the-game real…________________________________________Where’s this HIGH POWERED SHORT ZONE coming from?🔻 Solid red line – a trendline from Dec 2024 that has held strong through three separate tests — marking it as a key line on the sand.🔻 Dashed red line – goes all the way back to Dec 2017. A seasoned veteran of resistance.I also drew in a white ascending channel—not just for looks. If BTC breaks out, this channel will help us ask:“How high is too high?”________________________________________Now enters Fibonacci — where nature maps out key alignments on the chart. 🌱🟡 Gold lines = Fib golden ratios🔵 Teal lines = Fib Degen RatiosIt’s wild how they just line up:•2.618? Right on the top of the channel.•1.618? Sitting on the 2017 trendline.•0.618? Near current support + bottom of the channel.Also had to draw that horizontal support white line to keep an eye on. A Bounce or bust? Ask the bUCKmOON!
Disclaimer
Any content and materials included in Sahmeto's website and official communication channels are a compilation of personal opinions and analyses and are not binding. They do not constitute any recommendation for buying, selling, entering or exiting the stock market and cryptocurrency market. Also, all news and analyses included in the website and channels are merely republished information from official and unofficial domestic and foreign sources, and it is obvious that users of the said content are responsible for following up and ensuring the authenticity and accuracy of the materials. Therefore, while disclaiming responsibility, it is declared that the responsibility for any decision-making, action, and potential profit and loss in the capital market and cryptocurrency market lies with the trader.