
TehThomas
@t_TehThomas

What symbols does the trader recommend buying?
Purchase History
پیام های تریدر
Filter
TehThomas
بیت کوین در آستانه نقطه عطف بزرگ: ۷۲ هزار دلار، منطقه نجات یا سقوط؟
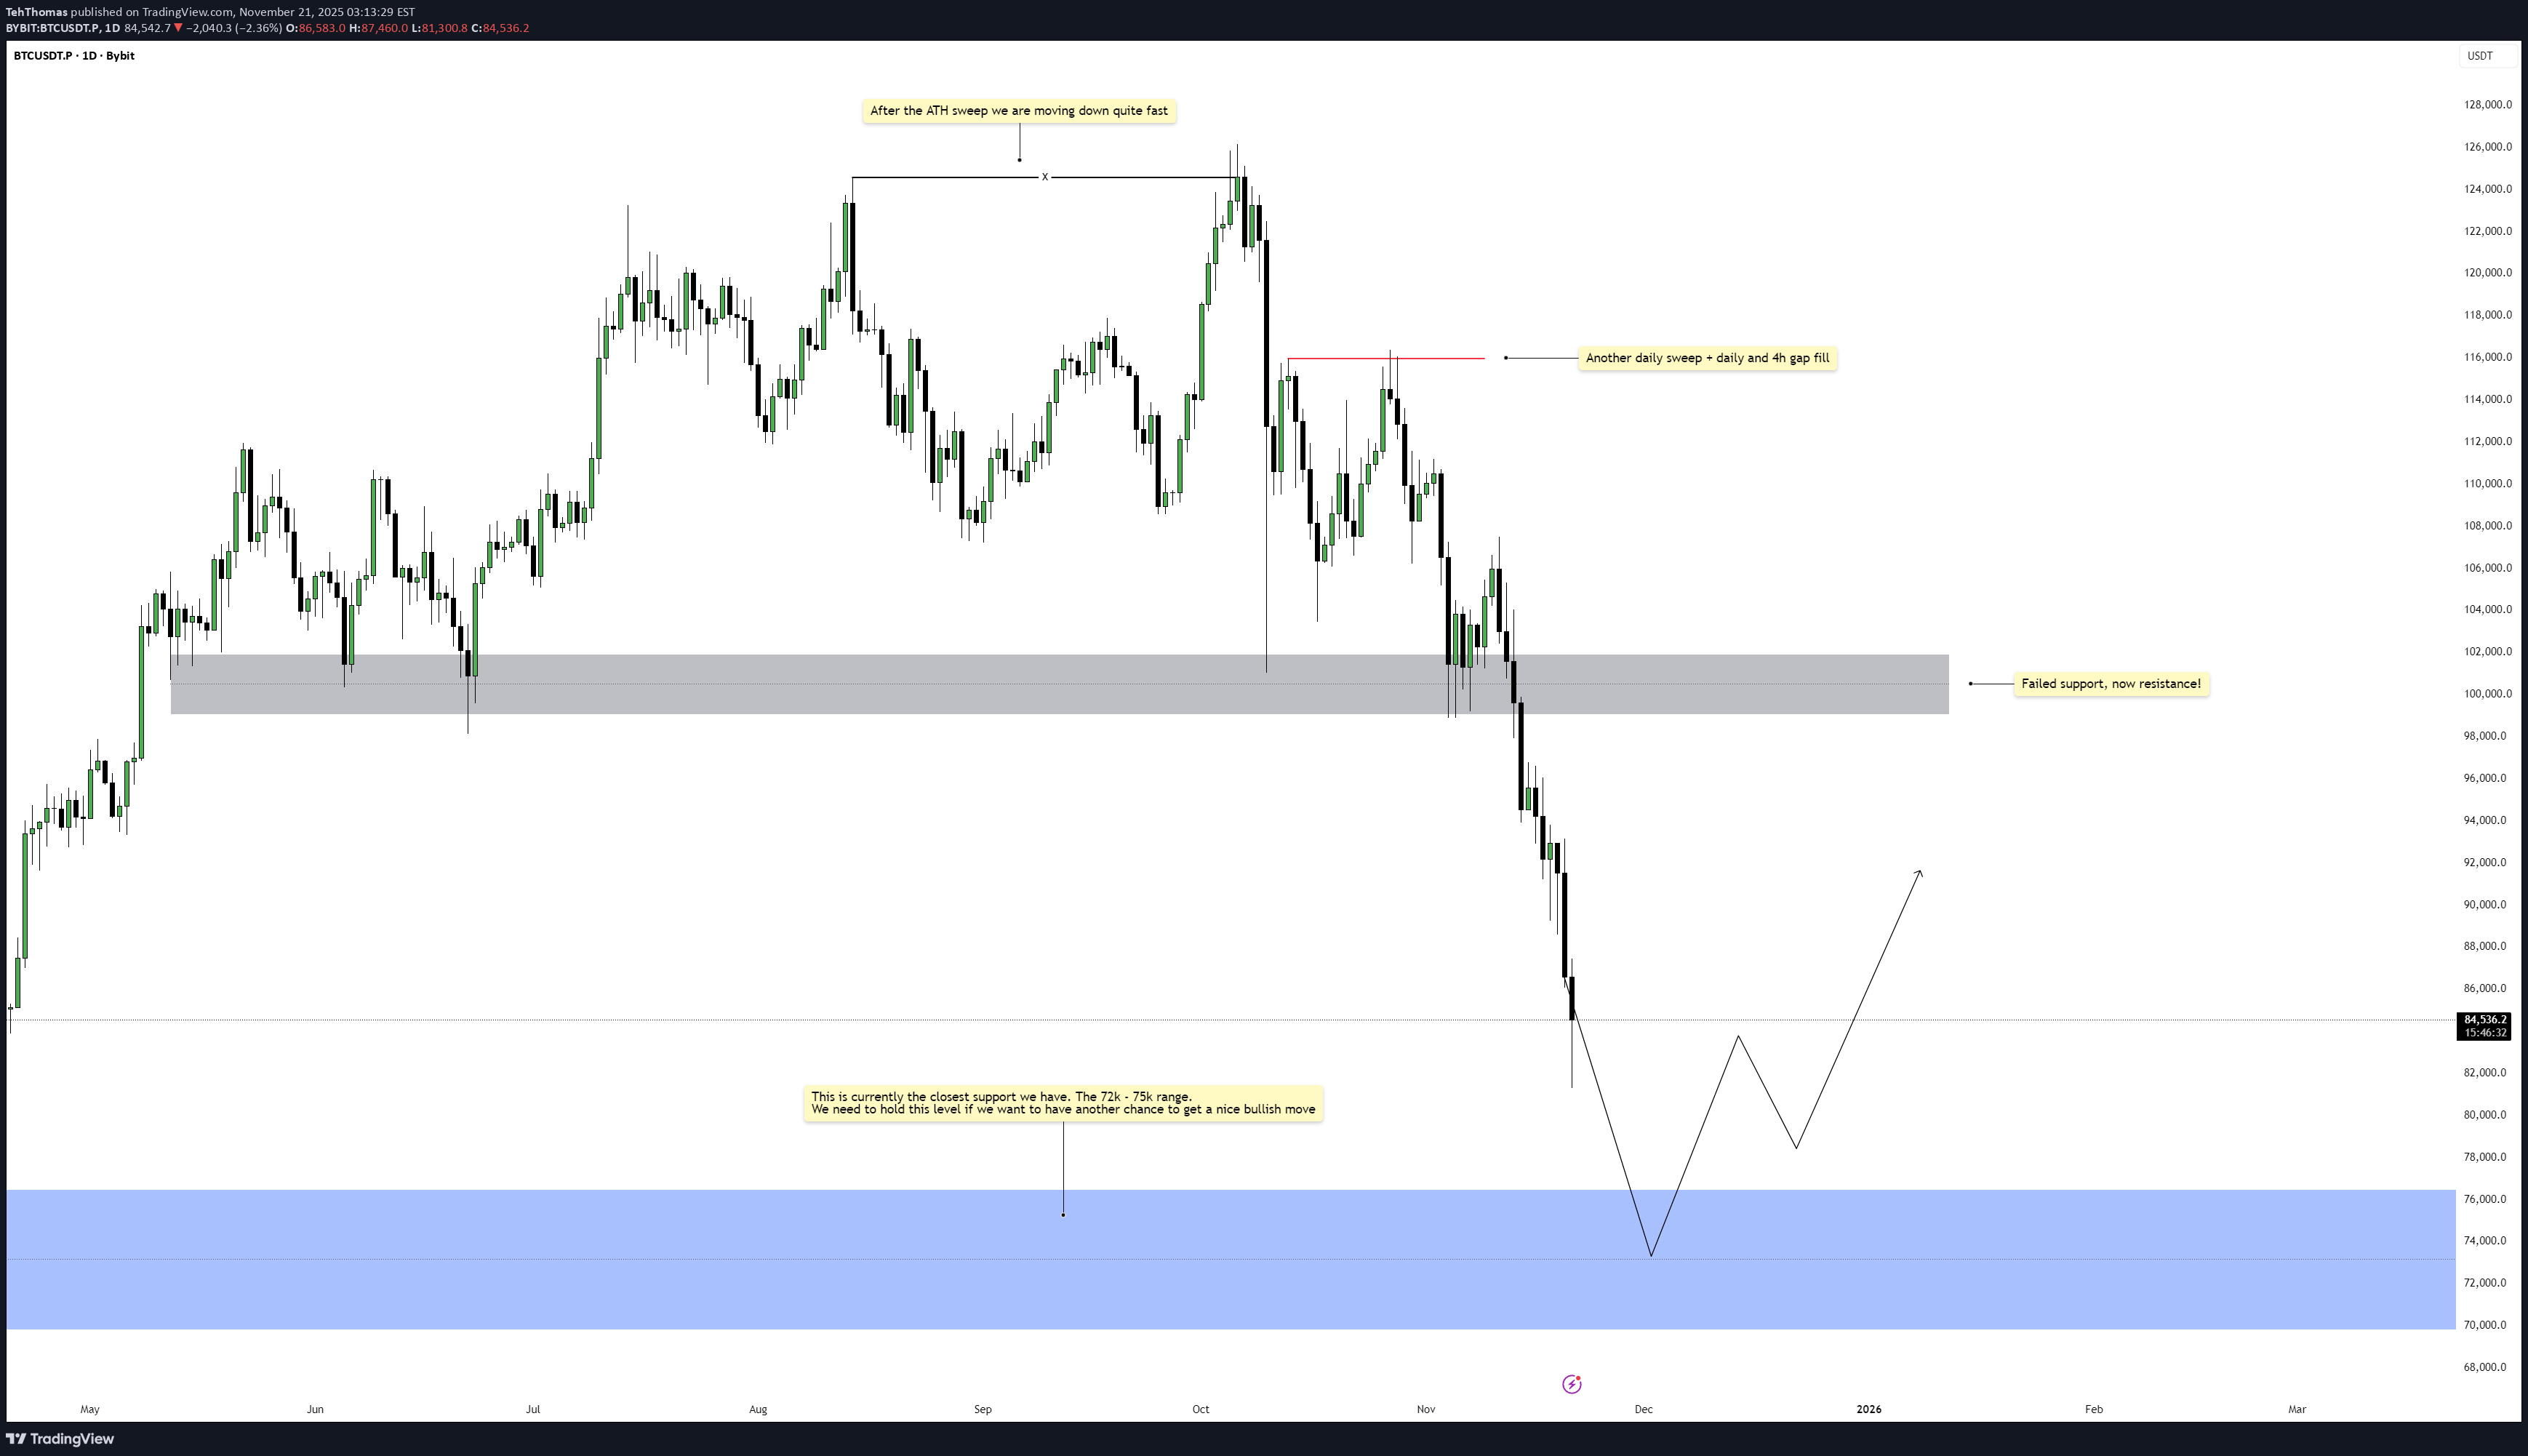
Bitcoin continues to bleed lower after multiple liquidity sweeps, and the decline is beginning to compress into a more controlled down move. The chart shows a clear shift in sentiment after the all time high sweep, then another daily sweep that helped close both the daily and 4H imbalance. Since losing the mid range zone and treating it as resistance, the market has been trending toward the next major area of interest. Consolidation Structure The structure is currently defined by a clean series of lower highs combined with sharp impulsive down legs. These moves are driven by liquidity grabs followed by displacement, which fits the narrative of a market hunting demand. The previously supportive gray zone has now flipped into resistance, confirming that the current trend remains heavy until a deeper demand zone is reached. Key Support Zone and Expectations The most important area beneath price sits around the seventy two thousand to seventy five thousand range, which is the closest meaningful support left on the higher time frame. This zone has been untested since the last major accumulation phase, and as long as price reaches it with a clean move, the reaction can form the base for a bullish leg. If this zone fails to hold, the next meaningful support sits deeper, and the downside extension could accelerate before any recovery starts. Bullish Scenario If Bitcoin reaches the seventy two thousand to seventy five thousand range and prints a clear rejection with displacement back upward, the market can set the foundation for a strong bullish bounce. Ideally, we see a final liquidity sweep beneath that range, followed by a sharp market structure shift on the lower time frames. That would open the door for a sustained recovery toward the mid range inefficiencies left behind during the selloff. Bearish Scenario If the key zone does not hold, the current support gives way and the market moves into a much deeper discount. That would shift the bias toward continuation lower, targeting untouched liquidity pools further down. In this scenario, any attempt to bounce would likely be corrective rather than the start of a true reversal. Conclusion I expect Bitcoin to deliver a meaningful bullish bounce once the seventy two thousand to seventy five thousand zone is tapped, as long as the level holds cleanly. If it fails, the decline continues into a deeper support, but the higher time frame idea remains that the next strong reaction will come from that region. Until then, patience is key while the market completes the move into higher time frame demand. ___________________________________ Thanks for your support! If you found this idea helpful or learned something new, drop a like 👍 and leave a comment, I’d love to hear your thoughts! 🚀Looks like we are still heading towards the 75k range
TehThomas
بیت کوین در آستانه جهش: حرکت نهایی به سمت حمایت و واکنش صعودی قوی!
Bitcoin continues to trade inside a clean falling channel, moving lower in a controlled manner as it approaches a major support zone. The overall flow remains bearish in the short term, however the structure suggests we are nearing an area where a short term bullish reaction becomes highly probable. Momentum remains soft, but the market is clearly hunting liquidity beneath the channel, which aligns with the expectation of one more drive lower before a meaningful bounce forms. Channel Structure And Liquidity Behavior The descending channel is guiding price efficiently, with every lower high respecting the upper boundary and confirming that sellers are still in control for now. This controlled descent usually signals that the market is preparing for a sweep of the lows rather than a sudden break. As price presses toward the channel’s lower boundary and the highlighted support zone, liquidity becomes the focus. A sweep beneath the most recent lows is the type of inducement that often precedes a strong reversal. Support Zone Reaction Expectations The green support zone marked on the chart remains the key area of interest. It aligns with previous accumulation behaviour and prior reactive turning points, giving it weight as a zone where traders expect a bounce. Once price pierces into that zone, the probability of a short term bullish response is high. The ideal reaction would be a sharp rejection from the lows, followed by a move back into the body of the channel and a gradual push upward as the market begins absorbing sell orders. Retest And First Resistance Layer If the support holds and price bounces, the first significant obstacle will be the red resistance zone above. This area represents the first real test of whether buyers have the strength to absorb supply. A clean move into that zone, followed by a higher low, would confirm the shift in momentum and support the idea of a short term bullish continuation. Failure at this level would simply keep Bitcoin inside the same corrective structure. Short Term Bullish Scenario The most probable bullish path is simple: a liquidity sweep into the support zone, a strong rejection, a move back toward mid channel levels, and then a steady climb into the first resistance area. The market does not need to break any major structure immediately. A clean reaction from support is enough to anchor a short term bullish leg, even if the larger trend is still corrective. Conclusion Bitcoin is approaching the point where a short term bullish bounce becomes increasingly likely. The falling channel, the upcoming liquidity sweep, and the depth of the support zone all point to a reaction that should materialize soon. Patience remains important, as the bounce is expected only after the market completes its liquidity objective in the support area. ___________________________________ Thanks for your support! If you found this idea helpful or learned something new, drop a like 👍 and leave a comment, I’d love to hear your thoughts! 🚀So far so good
TehThomas
بیت کوین در نقطه حساس: آیا این حمایت، پایان دردهاست یا سقوط ادامه دارد؟
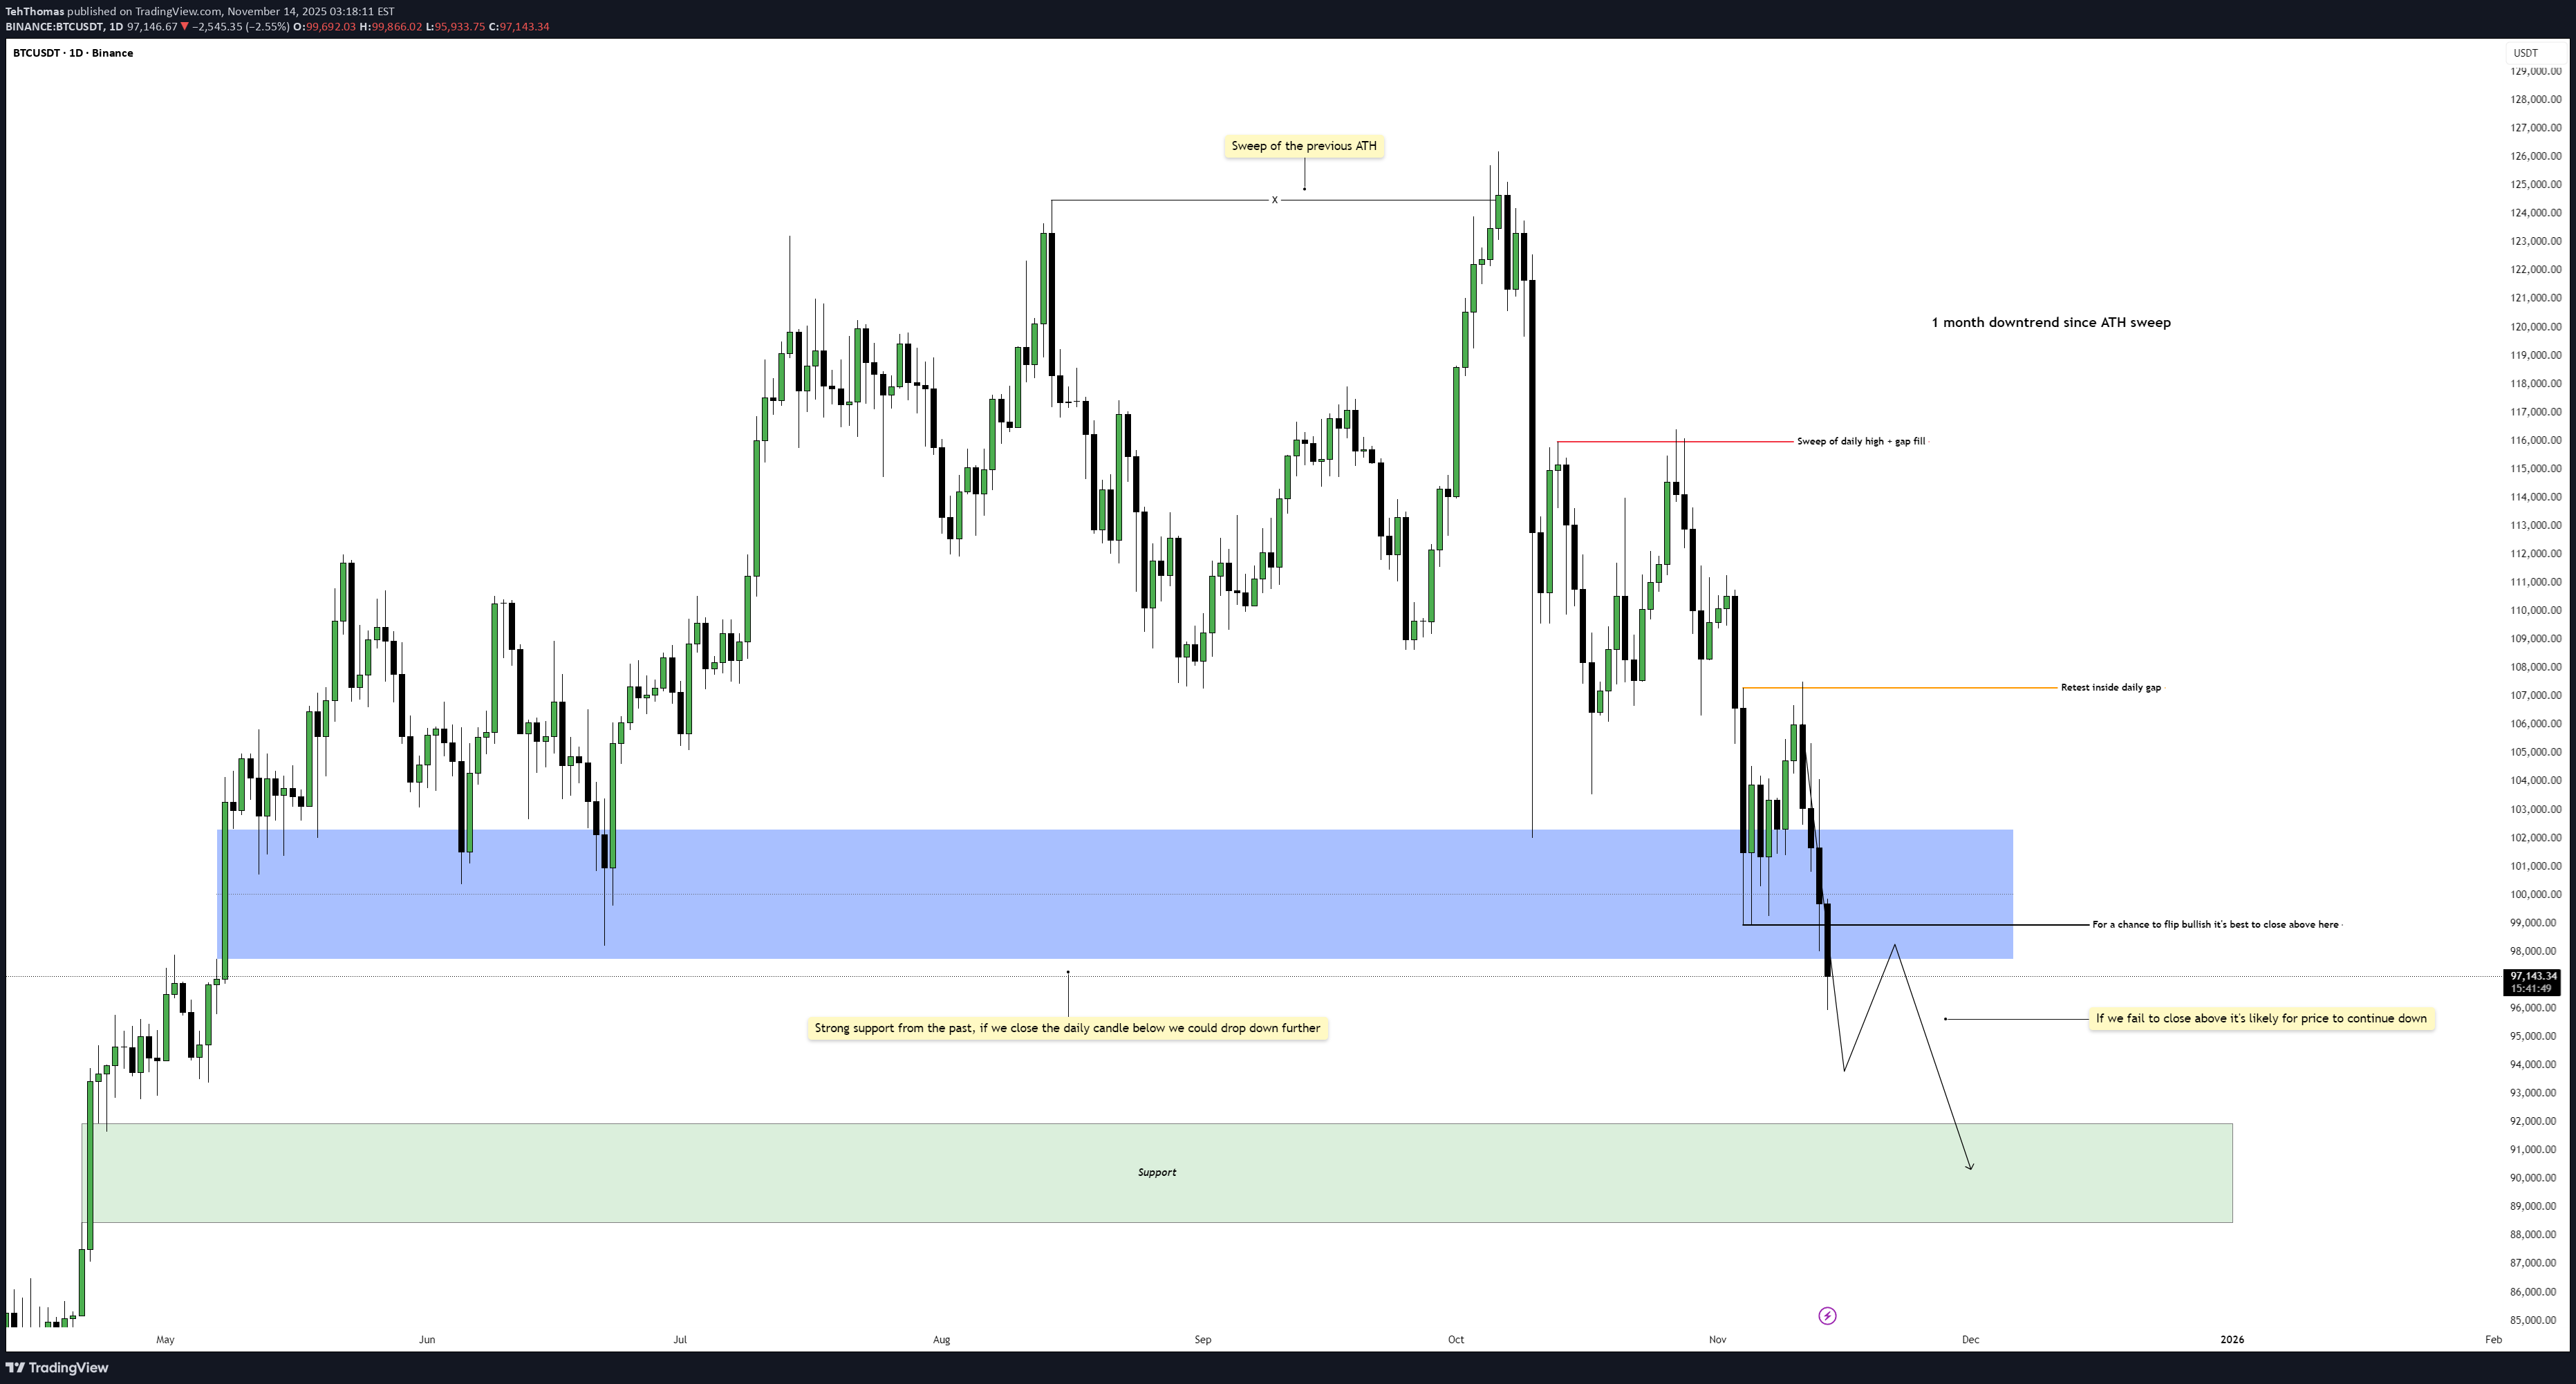
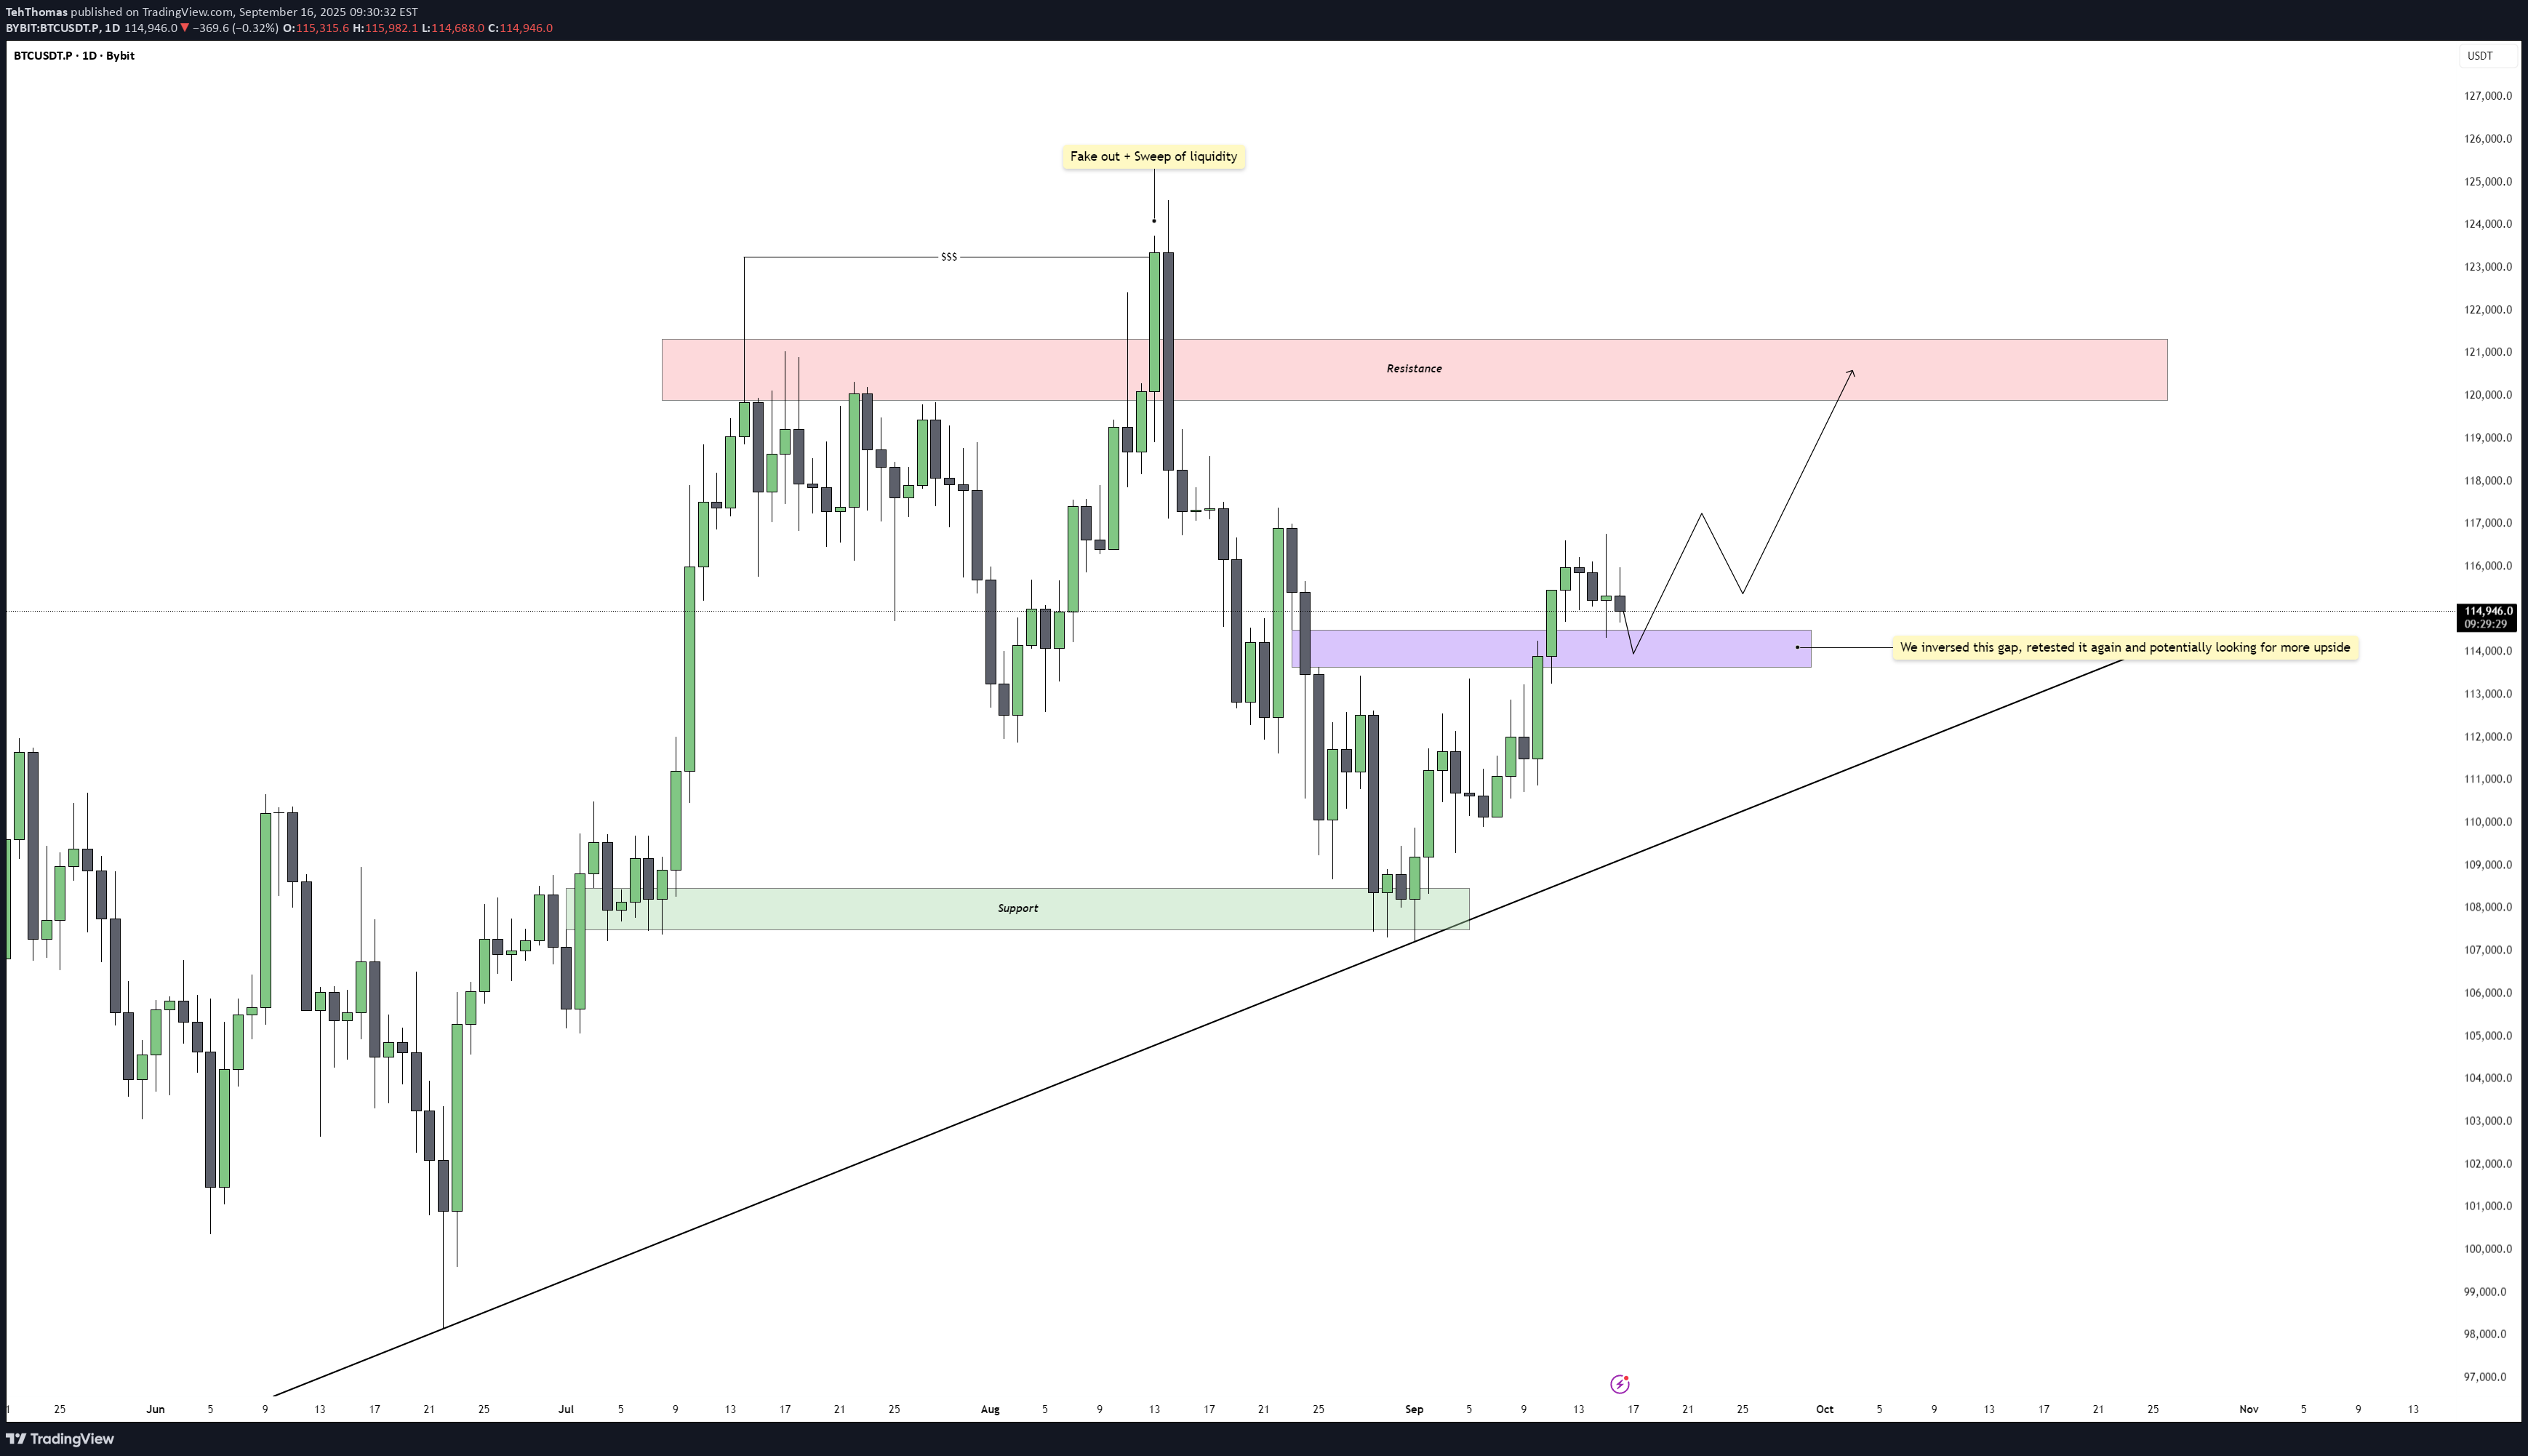
Bitcoin has been grinding lower for about a month after sweeping the previous all time high, which created the shift that kicked off this broader downtrend. Since that sweep, every push up has been met with selling, and the market has slowly bled its way back into a major support zone that has been significant in earlier cycles. This is the kind of level where the market usually makes a statement, either by holding and reversing or by breaking and opening the door to a deeper move. Support Structure and Key Reaction Point Price is sitting inside a wide support band that has given strong reactions in the past. It is a level traders know well and one that typically slows the market down. The difference this time is the structure leading into it. The downtrend has been consistent, with a string of lower highs showing that sellers remain in control for now. How the daily candle closes inside this zone will tell us a lot about whether buyers still have enough strength to defend it or if this level finally gives way. Recent Liquidity Events and Daily Gap Behavior Before dropping into this support, Bitcoin ran a recent daily high and instantly filled the gap above it, making it clear that the move was more about collecting liquidity than shifting the trend. After that, price slid lower again and retested the inside of the daily imbalance, but the retest failed to spark any meaningful demand. That kind of behavior often hints at a market that is still hunting lower levels rather than building upside structure. Bullish Scenario For sentiment to turn, Bitcoin needs to close back above the midline of this zone. That level is the one that would show buyers are actually stepping back in and absorbing the sell side. If the market can reclaim it, a short term reversal becomes possible, and the first targets would be the inefficiencies left behind during the recent selloff. From there, the market would still need to break a series of lower highs before a proper shift is confirmed on the daily timeframe. Bearish Scenario If the daily candle fails to close above that internal level highlighted on the chart, viewers should expect continuation lower to become the more probable scenario. A failed close there tells you buyers did not manage to hold the midpoint of the range, which usually means the market is preparing to reach for deeper liquidity. In that situation, the next major support zone below becomes the logical draw, and the path shown on the chart, a small bounce followed by another leg down, fits well with the current momentum. Conclusion Bitcoin is sitting at a decision point. Either this support zone does its job again and gives the market enough fuel for a recovery, or the daily close confirms that the level has weakened and the market is ready to reach for the next higher timeframe support. Until that close gives clarity, patience is key, since this is typically where traders get chopped if they try to force a direction too early. ___________________________________ Thanks for your support! If you found this idea helpful or learned something new, drop a like 👍 and leave a comment, I’d love to hear your thoughts! 🚀We closed the daily candle below our zone. Which confirms the bearish continuation
TehThomas
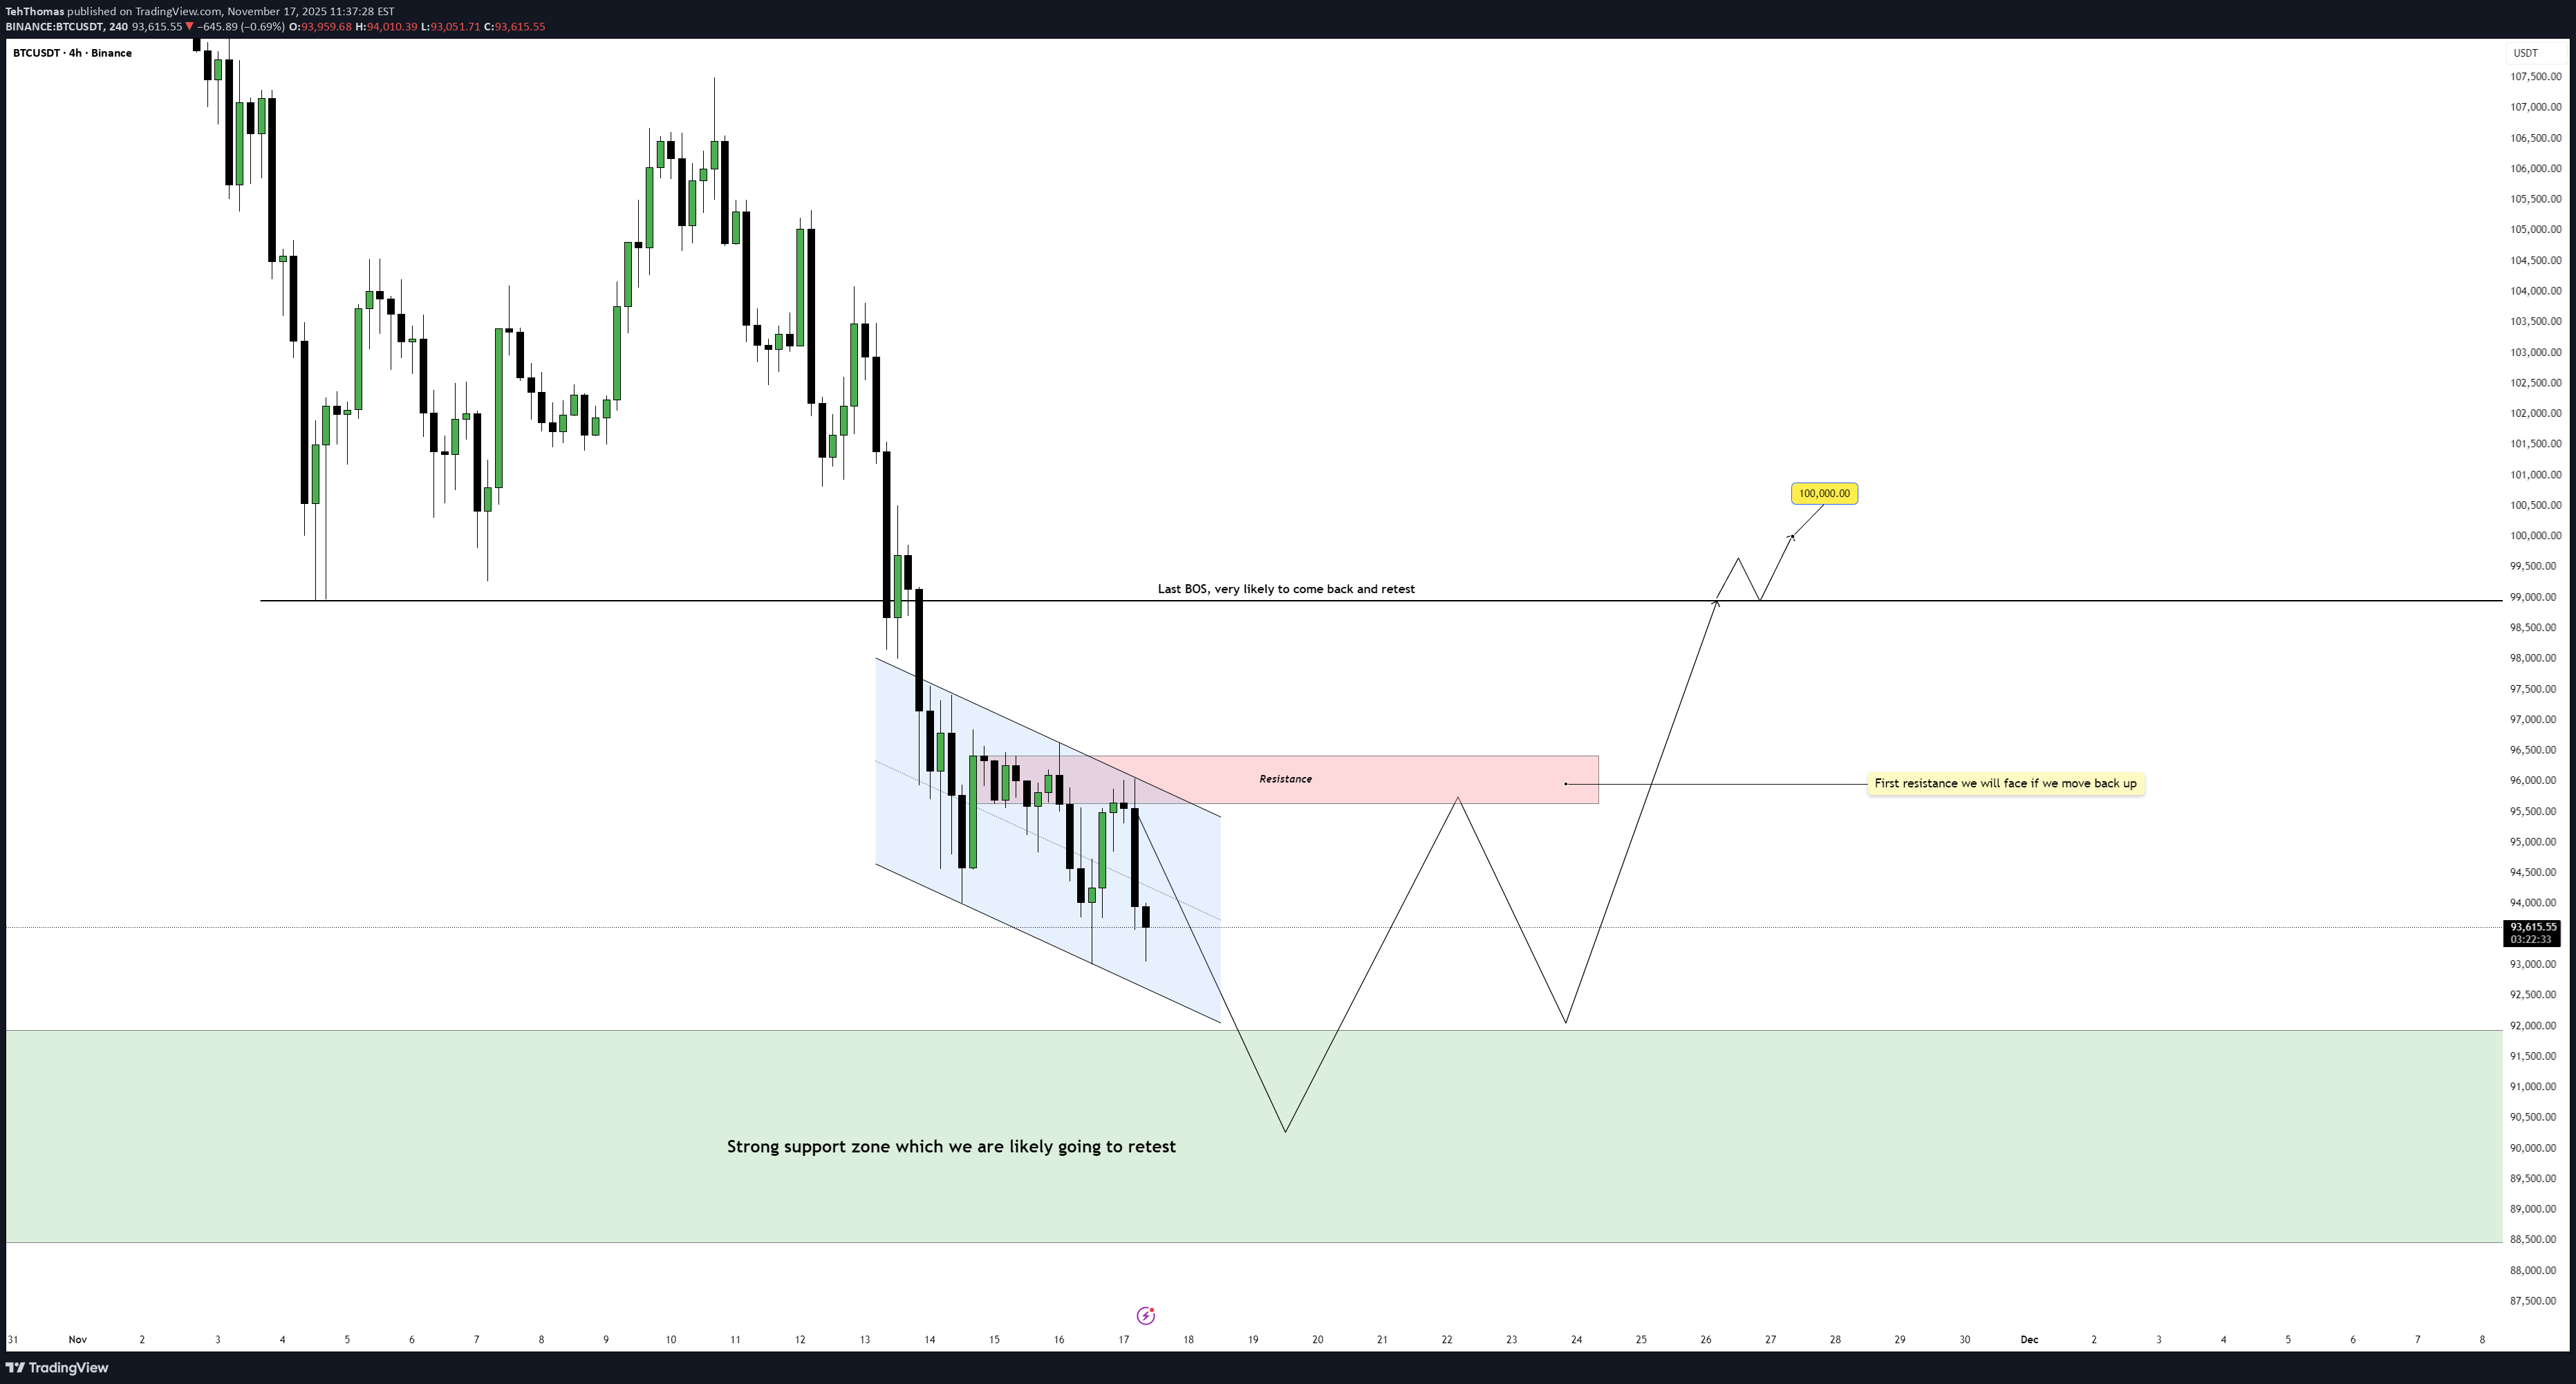
بیت کوین در یک دوراهی حساس: آیا گاوها خط دفاعی را حفظ میکنند؟
Bitcoin has broken its four-hour downtrend line, marking a potential shift in momentum after an extended bearish phase. The move has sparked renewed interest from buyers, signaling the first real attempt to reclaim structure after consistent lower highs. Despite this progress, the market remains trapped beneath a strong resistance area that has historically acted as a ceiling for price action. Structure and Key Levels Following the breakout, Bitcoin left behind a fair value gap, which has now been fully filled, resulting in a healthy bullish reaction. This confirms that the imbalance served as an effective demand zone, attracting buyers back into the market. Above current price, however, lies a key resistance zone that aligns with a previous liquidity sweep, keeping the risk of rejection in play. Bullish Scenario If buyers can maintain control above the filled gap and sustain momentum, the structure could expand higher as liquidity above recent highs becomes the next target. A decisive break and hold above the resistance zone would confirm the continuation of bullish intent and potentially establish a higher low formation on the four-hour timeframe. Bearish Scenario If price struggles to gain acceptance above resistance and fails to hold its current structure, a rejection could trigger a deeper retracement. This would likely drive the market back into the range below, turning the breakout into a liquidity grab rather than a true reversal. A return toward previous demand areas would then become likely as sellers reclaim control. Price Outlook At this point, Bitcoin appears to be consolidating between the strong resistance above and the fair value gap below. This range may act as a decision zone for the next leg. A clean break to the upside would confirm strength and validate the recent shift in structure, while a hard rejection would suggest that the broader downtrend is not yet over. Conclusion Bitcoin is at a crucial juncture, trading between a proven supply area and a fresh demand zone that just produced a strong reaction. The market’s next move will reveal whether this breakout can evolve into a sustained trend reversal or if it was simply another liquidity sweep within a broader bearish context. ___________________________________ Thanks for your support! If you found this idea helpful or learned something new, drop a like 👍 and leave a comment, I’d love to hear your thoughts! 🚀Again on the trendlineBitcoin is still holding support. Now inside a 1h FVG above the trendline
TehThomas
بیت کوین: گاوها برای صعود بعدی به چه تأییدی نیاز دارند؟
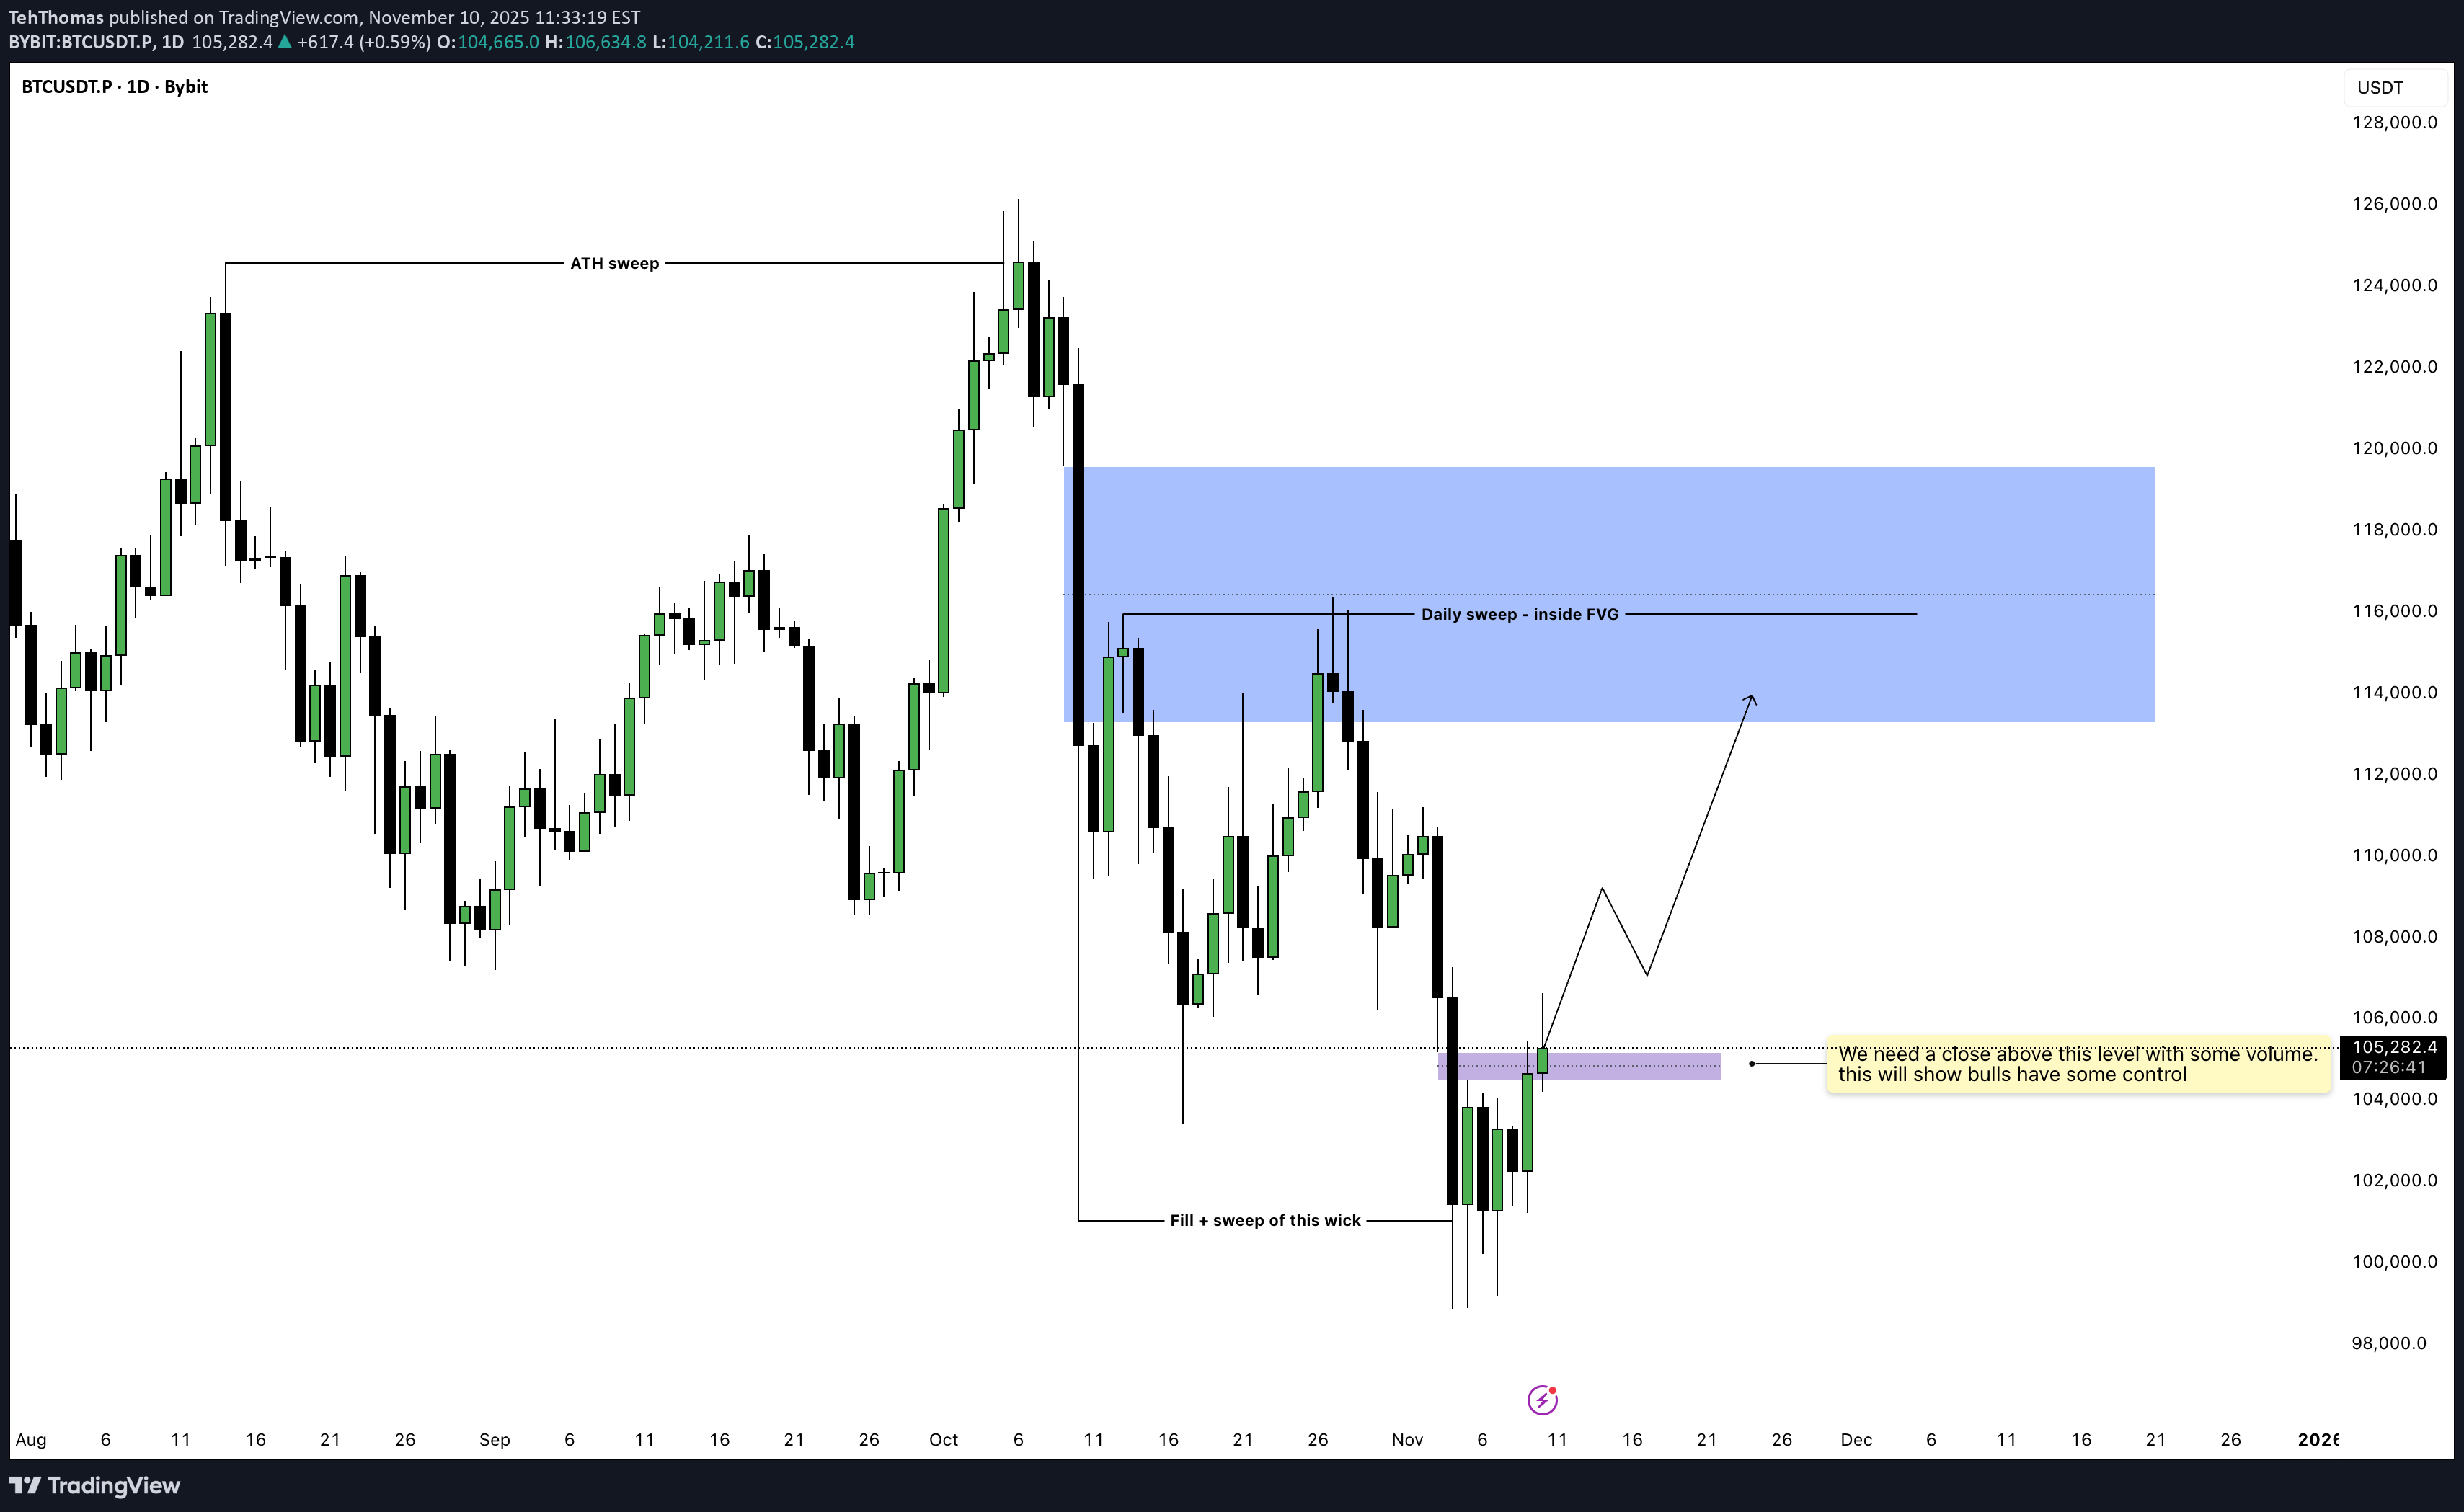
Bitcoin first swept the all-time high, taking out liquidity before showing signs of exhaustion. This move triggered a sharp selloff that rebalanced the previous inefficiency left behind on the daily chart. The rejection from that premium area set the tone for a corrective phase, bringing price back into discount levels where buyers are now attempting to re-establish control. Consolidation Structure After the ATH sweep, Bitcoin formed a clear lower high structure. The subsequent drop not only filled an existing daily Fair Value Gap but also created another sweep within that same range. This type of double sweep formation often acts as a transition phase between bearish distribution and potential accumulation, provided the market finds enough volume support at lower levels. Bullish Scenario The most recent move filled the lower wick and swept local lows, which typically indicates a liquidity grab before a shift in sentiment. If bulls can close above the highlighted level with strong volume, this would suggest a market structure shift on higher timeframes and could trigger a push toward the 111,000–114,000 region, where the next daily inefficiency lies inside the previous sweep zone. Bearish Scenario Failure to reclaim and close above the key resistance level would suggest that the current move is only a retracement within the broader bearish leg. In that case, Bitcoin could revisit the 100,000–101,000 area to re-test the liquidity base created by the recent wick fill, potentially even running the lows one more time before forming a clearer accumulation range. Price Target and Expectations If bullish confirmation comes through, the initial target sits near 111,000, aligning with the lower boundary of the daily FVG. A clean breakout beyond 114,000 would further confirm strength and possibly open the way back toward the 118,000–120,000 region where prior inefficiencies remain unmitigated. Conclusion Bitcoin has completed a deep corrective sweep, but bulls have yet to prove dominance. A decisive close above the marked resistance with solid volume would confirm that buyers are regaining control and set the stage for continuation toward the higher daily imbalance. Until then, patience is key, as the current move remains a potential retracement rather than a confirmed reversal. ___________________________________ Thanks for your support! If you found this idea helpful or learned something new, drop a like 👍 and leave a comment, I’d love to hear your thoughts! 🚀Currently filling some gaps before the expected move up
TehThomas
بیت کوین در آستانه ریزش؟ نشانههای اولیه بیدار شدن خرسها!
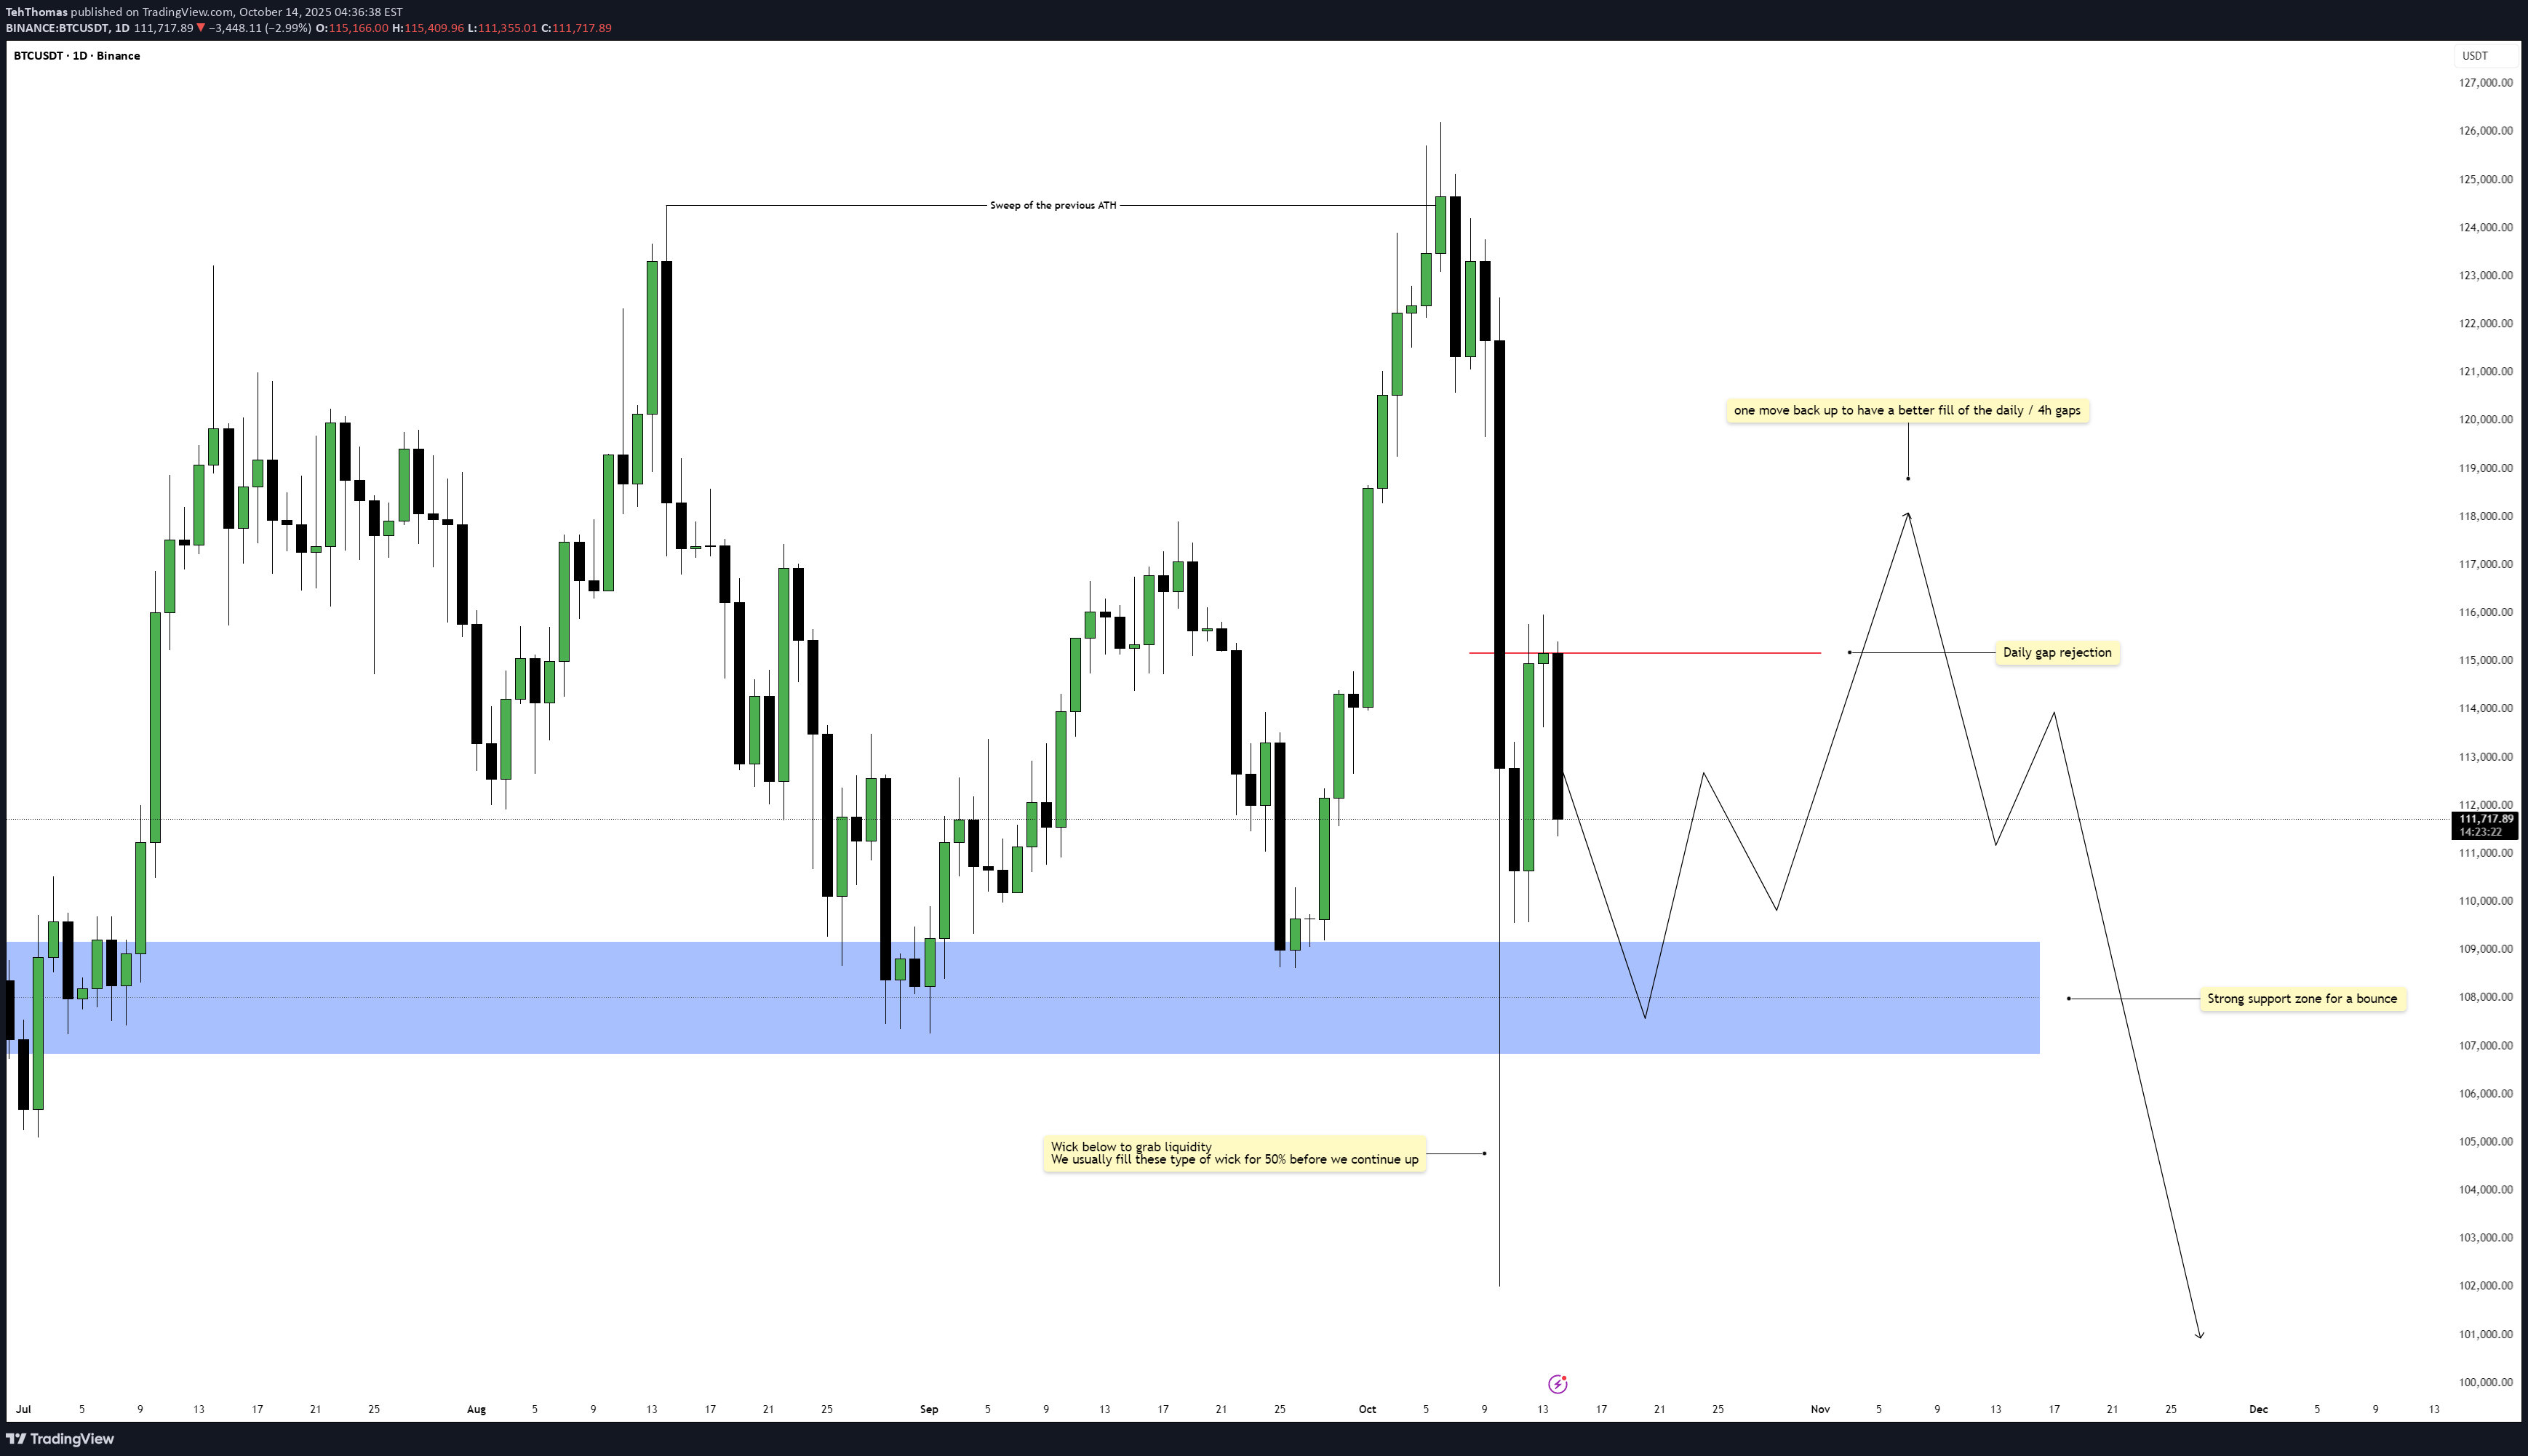
Bitcoin recently swept the previous all-time high, taking liquidity from the major external range. After that sweep, price reacted sharply downward, leaving behind a significant daily imbalance. This gap is now acting as resistance, with clear rejection seen on the daily timeframe. The move signals exhaustion from buyers and an early sign that the market could be preparing for a deeper retracement phase. Consolidation Structure Following the rejection, Bitcoin is moving within a short-term consolidation range, sitting between the daily imbalance above and a major demand zone below. This structure represents indecision as the market transitions from expansion to a potential reaccumulation or redistribution phase. The large wick left behind during the last drop suggests that liquidity was collected below the previous range, but it remains unfilled, hinting at unfinished business in that area. Bullish Scenario In the short term, a bounce from the lower zone could play out as the market attempts to correct the imbalance. This would align with a 50% fill of the previous large wick, providing the liquidity needed before resuming any sustained downside movement. If buyers manage to reclaim control temporarily, the move would likely target the unfilled 4-hour gaps sitting above current price. Bearish Scenario However, any upside reaction is expected to face resistance at the daily imbalance. Once those 4-hour gaps are filled, the likelihood of another rejection increases. If that rejection confirms, it could trigger a larger selloff targeting the strong support area below, where the next round of liquidity rests. The reaction from that zone will determine whether the market continues lower or begins forming a new base for accumulation. Price Target and Expectations The ideal flow would see Bitcoin dip to fill 50% of the large wick, find temporary support, then stage one final bounce into the 4-hour imbalance zone before resuming its bearish leg. This structure keeps the overall narrative intact, combining liquidity behavior with efficient price delivery. Conclusion Bitcoin’s current setup remains technically balanced between two key inefficiencies. A short-term bounce is likely before continuation lower, with the daily gap rejection acting as the main pivot point in this structure. Until the wick fill and 4-hour gaps are resolved, the path of least resistance remains to the downside. ___________________________________ Thanks for your support! If you found this idea helpful or learned something new, drop a like 👍 and leave a comment, I’d love to hear your thoughts! 🚀
TehThomas
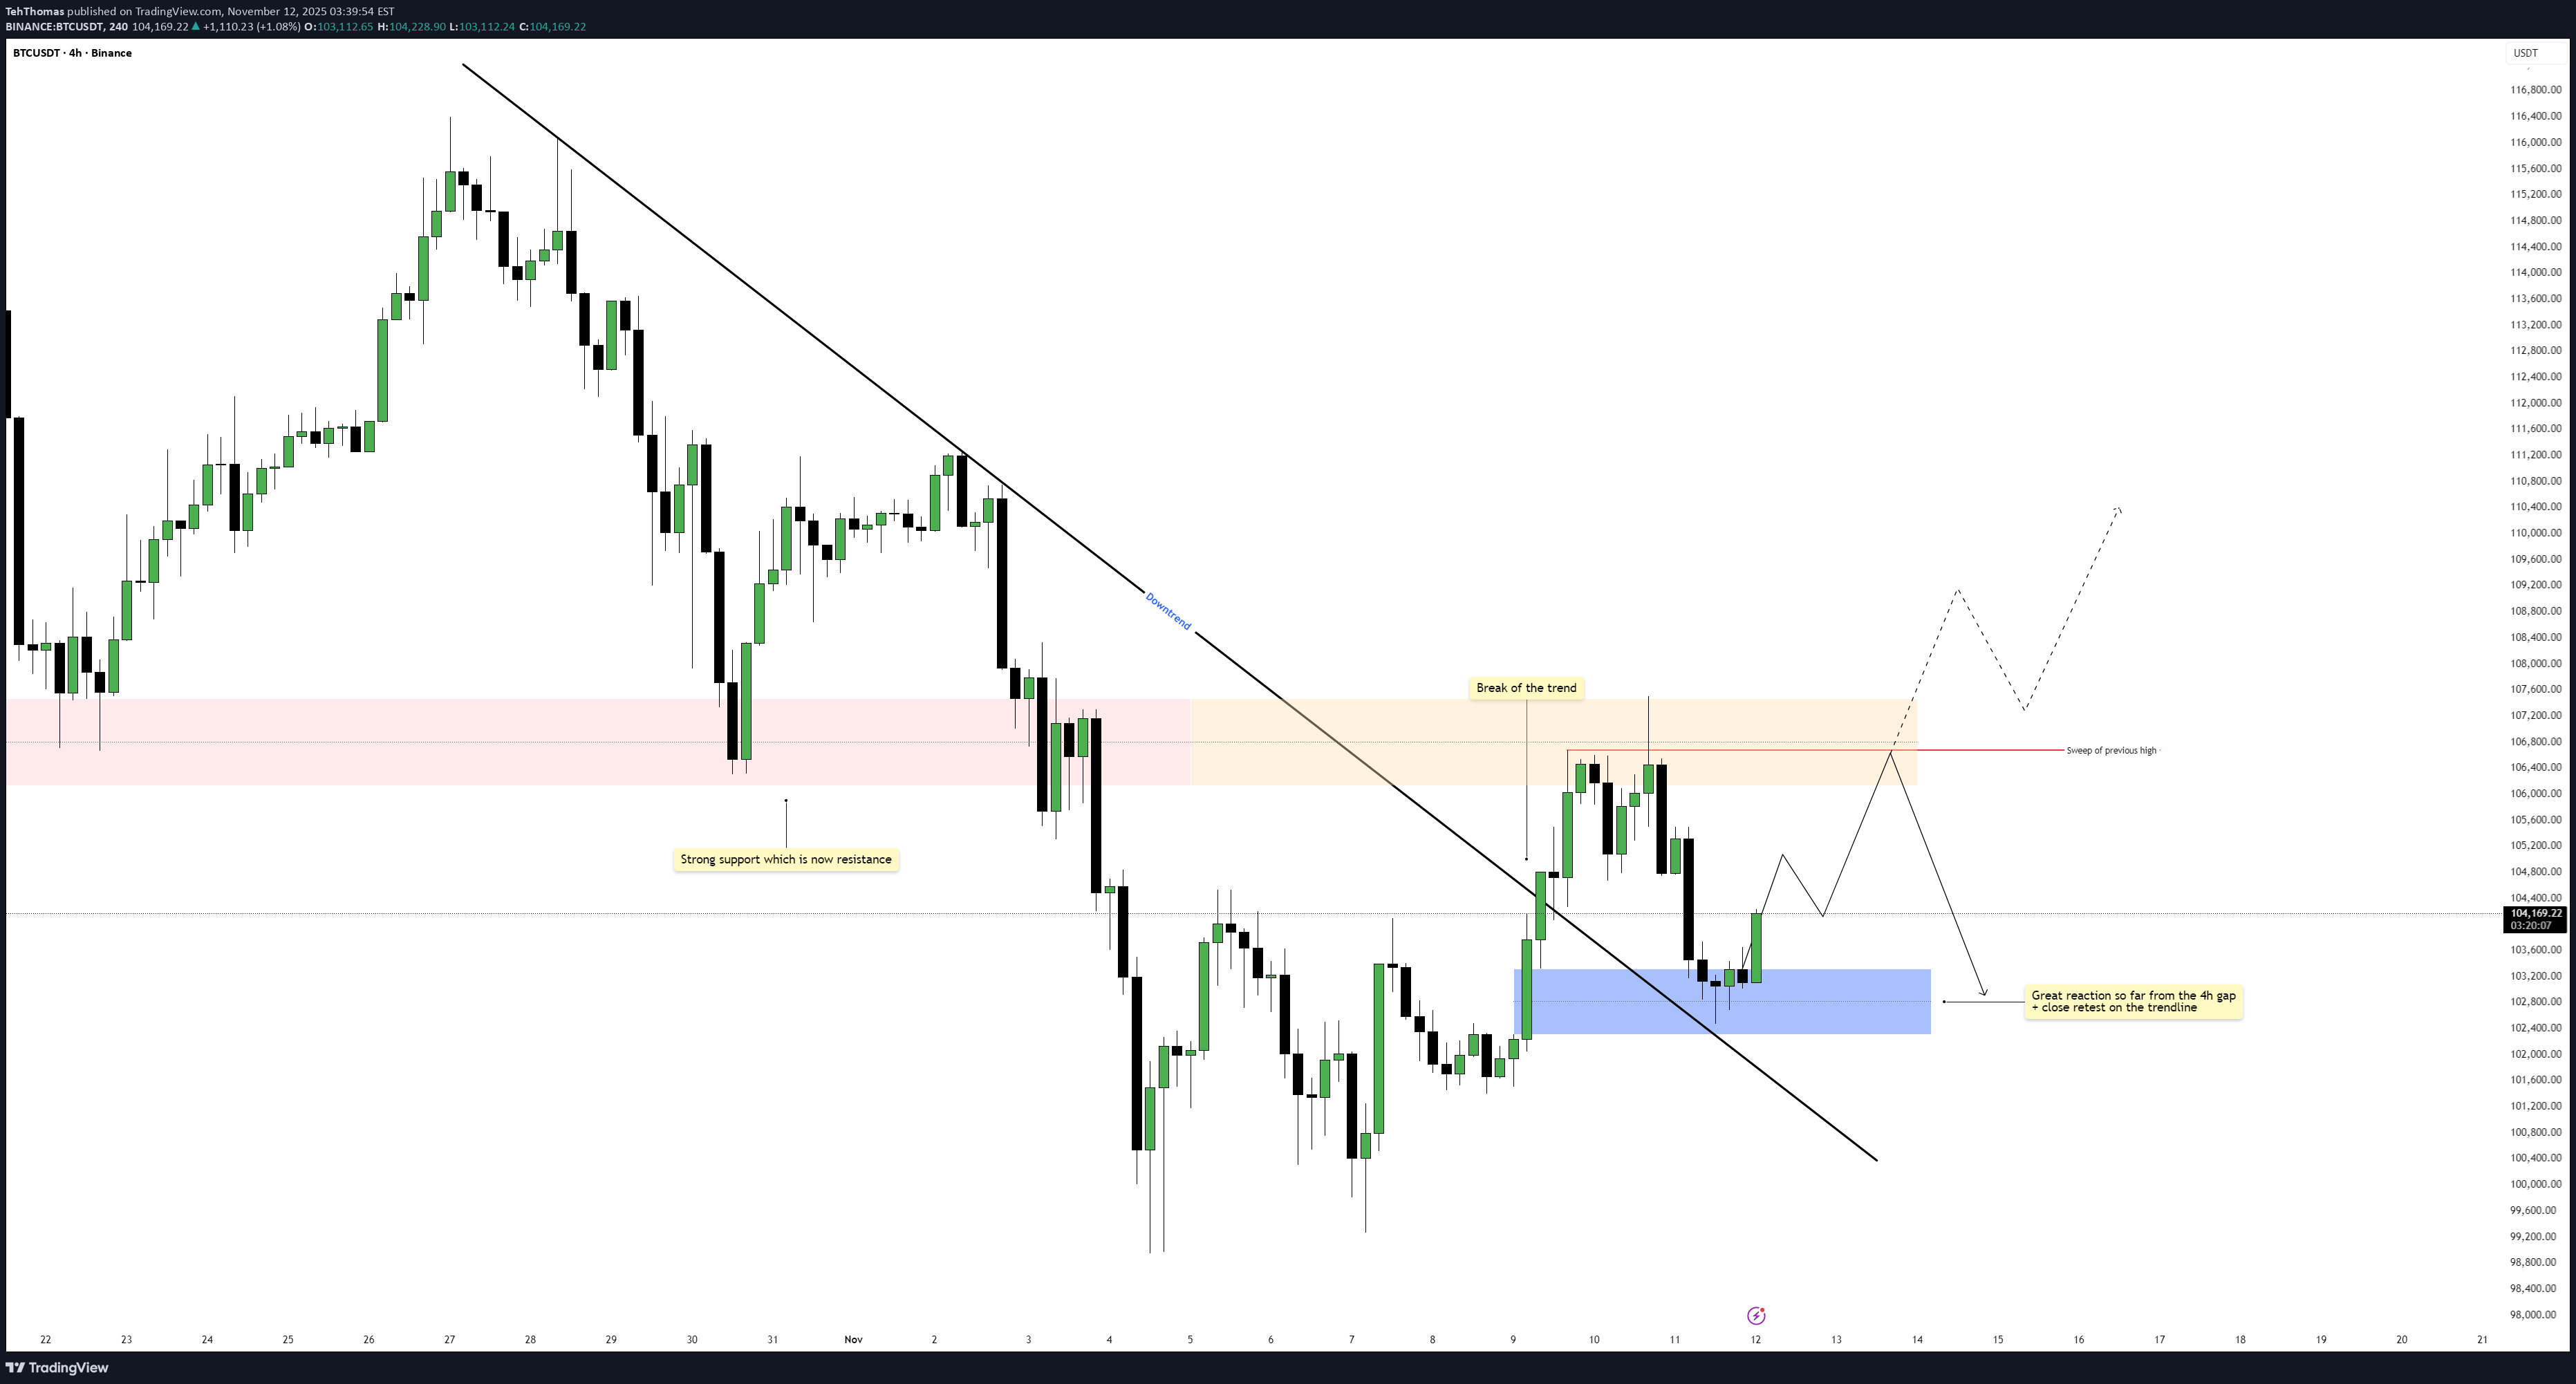
بیت کوین: اصلاح کوتاهمدت ضروری یا آغاز سقوط؟ (تحلیل ساختار بازار)
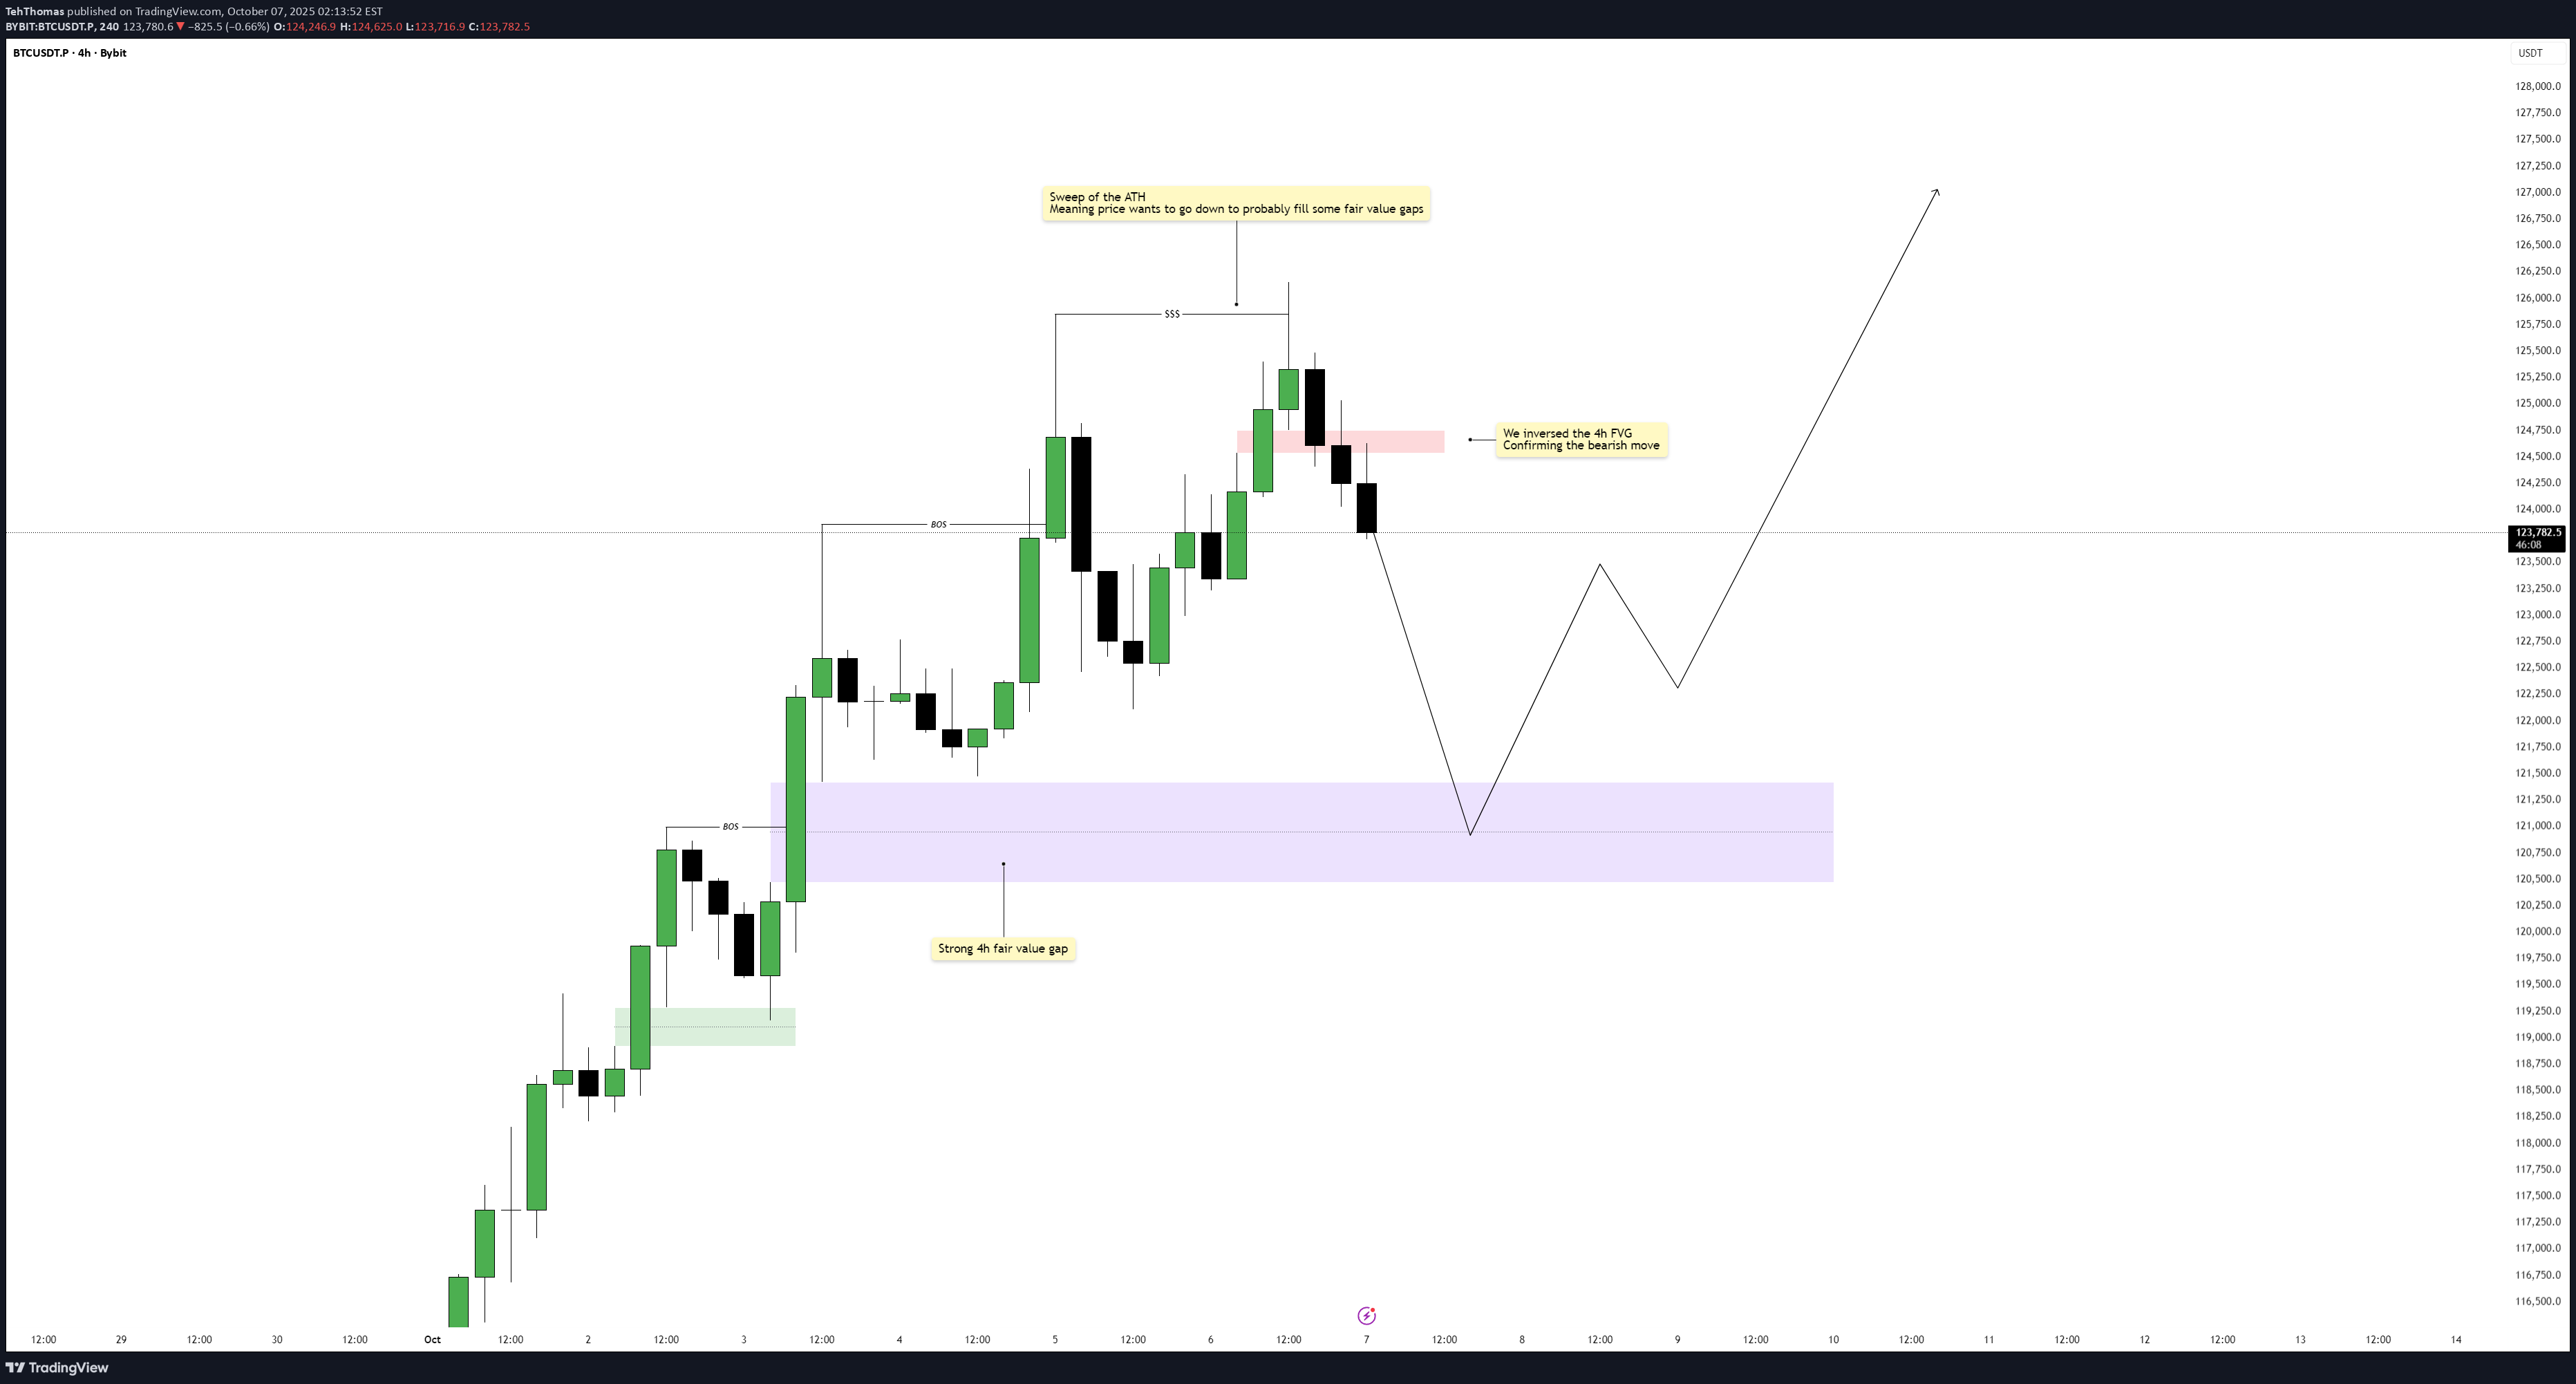
Bitcoin has recently swept the all-time high, triggering a short-term reaction from liquidity resting above that level. This move often signals that the market has completed its buy-side run and is now seeking to rebalance inefficiencies created during the aggressive push upward. The current structure indicates that price is shifting momentum in the short term, preparing for a deeper retracement before resuming its bullish trajectory. Imbalance and Structure Shift Following the liquidity sweep, a clear 4-hour imbalance (IFVG) has formed, acting as the first sign of bearish pressure entering the market. This inefficiency shows that the prior move lacked sufficient counter-orders, meaning price may need to return there to restore balance. The bearish move was further confirmed as price inverted a smaller 4-hour FVG, signaling a potential continuation to the downside in the short term. Bearish Scenario If the market continues to respect the newly formed IFVG, we could see a sustained bearish retracement develop. Price may use this imbalance as a draw, seeking to fill deeper inefficiencies left behind during the prior expansion. This corrective phase is not necessarily a trend reversal but rather a short-term redistribution phase before buyers potentially step back in from lower levels. Bullish Scenario Once the 4-hour fair value gap below is filled, the market could begin forming a base for a new bullish leg. The liquidity collected from the downside move and the rebalancing of inefficiencies would give price enough fuel for a strong continuation higher. Traders should look for a clean market structure shift or displacement from that demand area as the signal of renewed bullish intent. Expectations and Outlook In summary, Bitcoin appears to be in a healthy retracement phase after sweeping liquidity at the highs. The 4-hour imbalance provides a clear short-term target for price to seek, and once filled, the bullish structure could resume. This setup favors patience, waiting for confirmation that the downside rebalancing is complete before anticipating another impulsive rally. Conclusion Overall, Bitcoin’s structure suggests a temporary bearish move to fill the 4-hour FVG, followed by a potential bullish continuation once that inefficiency is resolved. Watching how price reacts upon entering that zone will be key in determining whether the next expansion phase begins. ___________________________________ Thanks for your support! If you found this idea helpful or learned something new, drop a like 👍 and leave a comment, I’d love to hear your thoughts! 🚀Going perfectly so far
TehThomas
Bitcoin - Daily Gap Inversion Aligns with Uptrend
Bitcoin recently made a push higher that cleared local highs and swept liquidity above the previous range. This move created a temporary fake out before price sharply retraced, filling inefficiencies left behind in the market. After completing this corrective move, price has begun reclaiming structure and is now respecting higher timeframe demand zones. Daily Structure The daily chart continues to show a clean uptrend, with higher lows forming along the rising trendline. After the liquidity sweep, price retraced to test key imbalances and has since confirmed a bullish shift by inverting a daily gap. This gap has been retested multiple times, suggesting it is holding firm as support and reinforcing the bullish continuation bias. Liquidity Dynamics The sweep of liquidity at the highs cleared buy-side pressure, resetting the market. This type of liquidity event often precedes sustained directional moves as the market seeks out new inefficiencies and liquidity pools. For now, downside liquidity has been satisfied and the path of least resistance appears to be higher. Upside Scenarios If the inverted daily gap continues to hold, price could target the major resistance block above 120,000 USDT. This zone aligns with the previous rejection area, where liquidity remains untested. Any approach into this resistance will be key to monitor for continuation or rejection. Downside Risk Should Bitcoin lose the daily inverted gap and trendline support, further retracement toward 111,000 to 112,000 USDT becomes possible, where a deeper liquidity pocket and structural support remain. Until then, the higher low structure remains intact. Conclusion Bitcoin has absorbed liquidity, filled inefficiencies, and inverted a daily gap that is now holding as support. Combined with the ongoing daily uptrend, this strengthens the bullish outlook with a clear target toward the 120,000 USDT resistance zone. ___________________________________ Thanks for your support! If you found this idea helpful or learned something new, drop a like 👍 and leave a comment, I’d love to hear your thoughts! 🚀Still looking good, expecting bullish movement today, just becareful with the FOMC!
TehThomas
Bitcoin - Clearing the Gaps on the Way to 117k
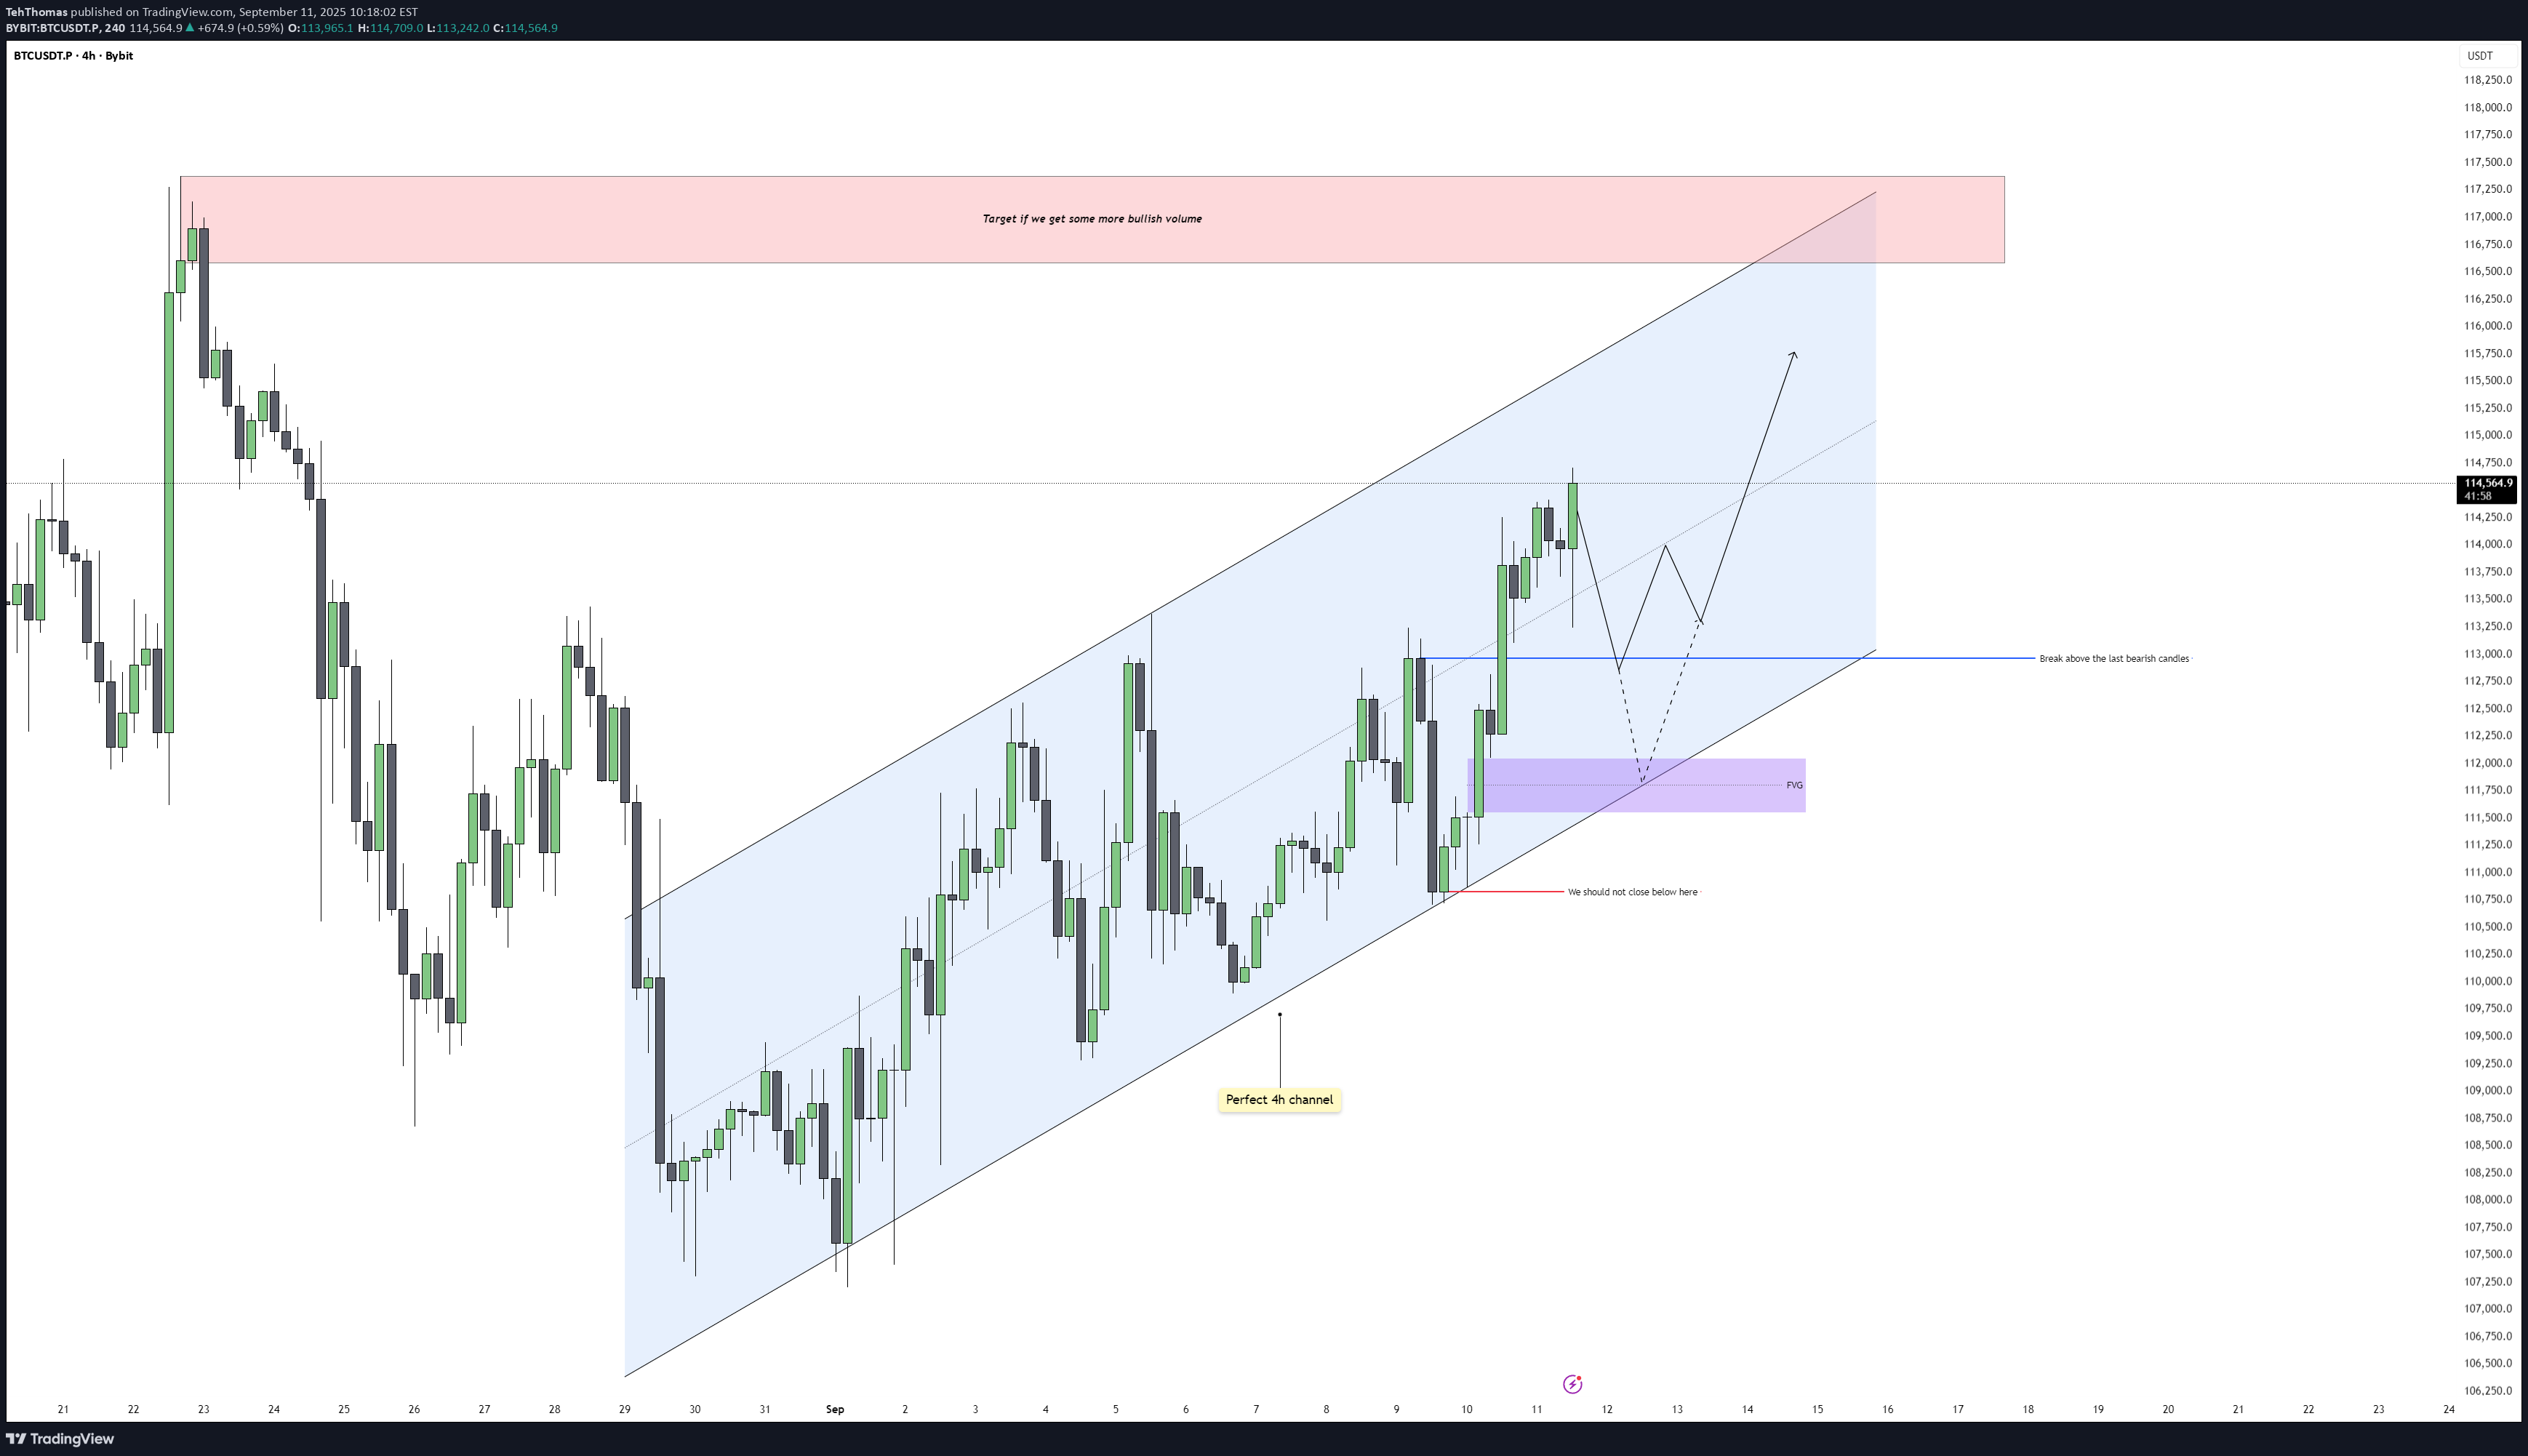
Bitcoin continues to respect the ascending channel on the 4H chart, showing steady higher highs and higher lows with clean structure. Price has been climbing with solid bullish momentum, and each retracement so far has been contained within the channel. This gives us a clear framework to track both short-term pullbacks and the next potential leg higher. Channel Dynamics The channel is holding perfectly, with both the upper and lower bounds being respected almost to the point. As long as price trades within this structure, the bias remains bullish. A deep pullback into the lower side of the channel would not necessarily invalidate the setup, but we should avoid closing below the last key demand zone if we want to keep the bullish structure intact. Fair Value Gaps Below Before continuing higher, Bitcoin may dip back into inefficiencies left behind. A key fair value gap sits below around the 111,700–112,300 region, aligning with prior support. Price filling this gap would be healthy for the structure, giving bulls a better base to push from. If price respects that level, the probability of a continuation toward the channel highs increases significantly. Bullish and Bearish Scenarios On the bullish side, if we hold the demand zone and reclaim the blue structure line, price should attempt to sweep short-term highs and extend into the upper channel boundary. A clean break above would open the door to the red supply zone around 117,000–118,000. On the bearish side, any decisive close below the purple fair value gap would shift momentum and put pressure on the lower channel boundary, signaling weakness and invalidating the immediate bullish scenario. Price Target and Expectations If the structure continues to play out, I expect Bitcoin to first dip into the imbalance below, find support, then make another leg higher toward 116,500–118,000. This area is a logical liquidity pool where stops above recent highs are clustered, and also aligns with a major supply zone. That zone should be closely monitored for reactions and potential reversals. Conclusion Bitcoin remains in a constructive bullish channel, but gaps below need to be addressed before a push into higher liquidity levels. I will be looking for a retracement into the imbalance to set the stage for a continuation higher into the upper red supply zone. As long as we hold above the key demand region, the bullish play remains valid. ___________________________________ Thanks for your support! If you found this idea helpful or learned something new, drop a like 👍 and leave a comment, I’d love to hear your thoughts! 🚀We tested the upper side of the channel first, probably heading down now towards the gaps
TehThomas
Bitcoin – Next Week Outlook: Liquidity Sweep Then Gap Fill
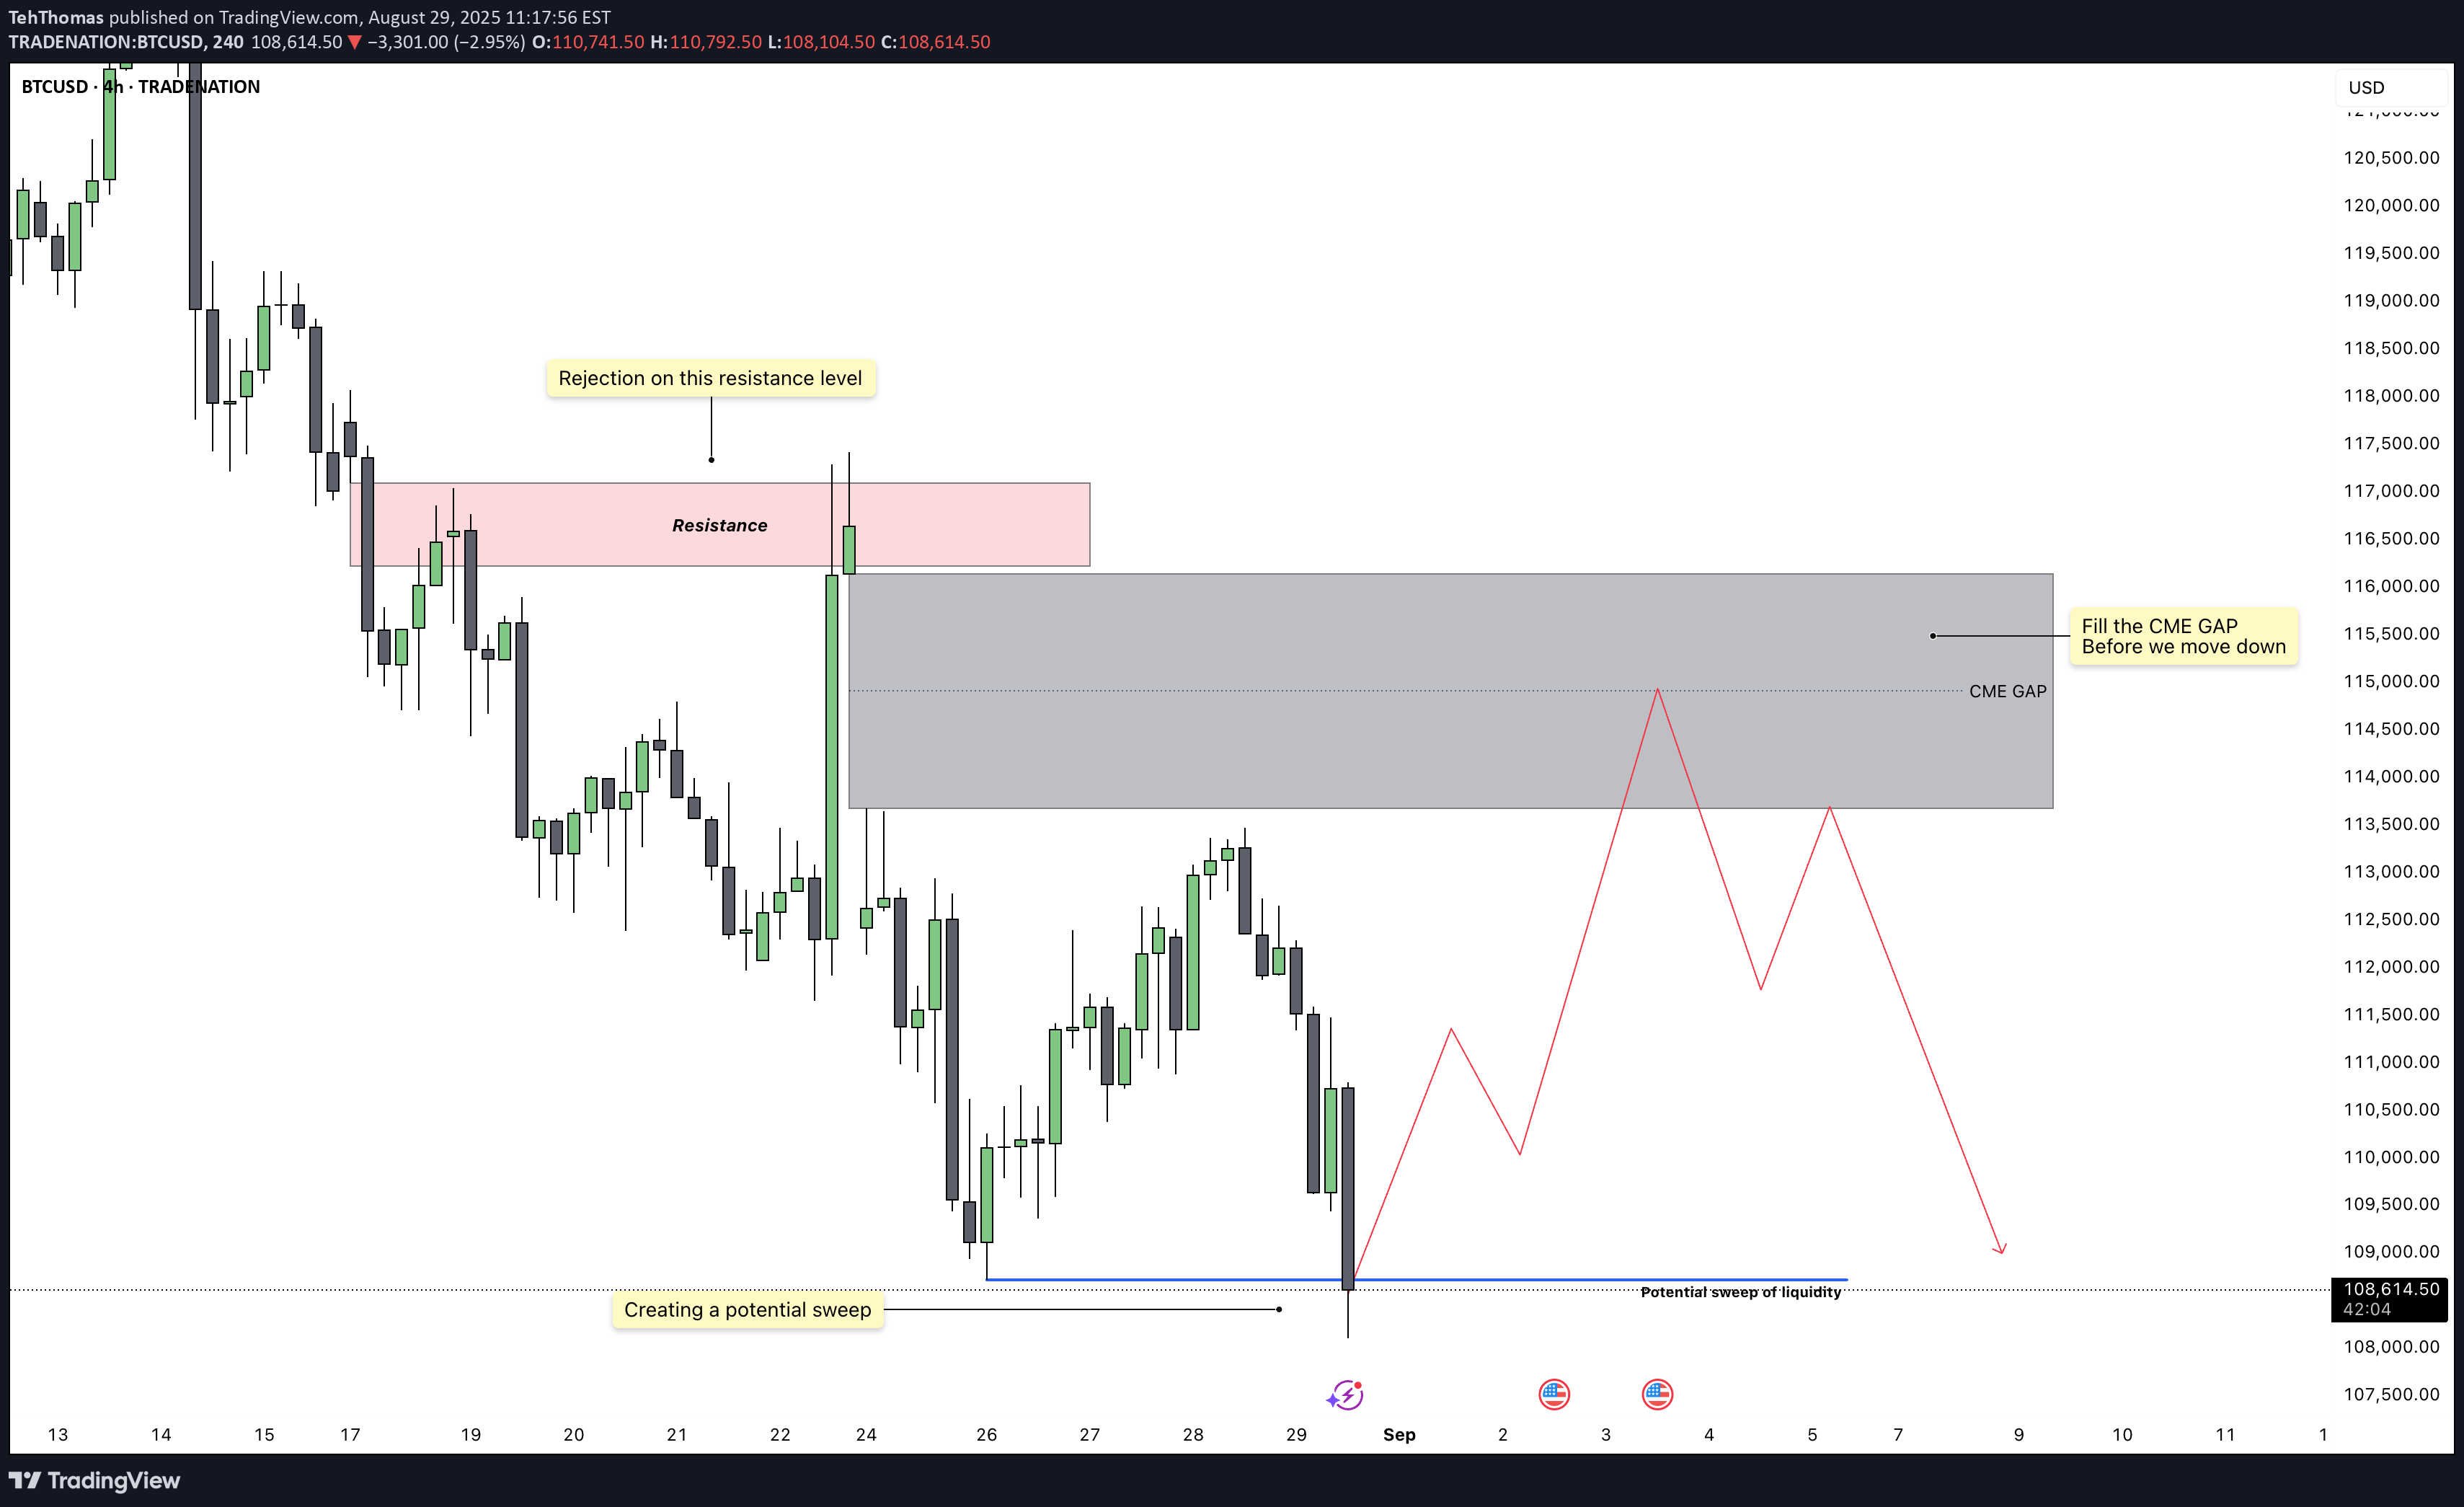
Bitcoin has been trading inside a broader downtrend, with repeated rejections at key resistance levels confirming bearish pressure. Recently, we saw price reject strongly at a 4H resistance zone, which set the stage for another leg down. However, before extending lower, there is still an unfilled CME gap above, and history shows that these gaps are often targeted before the market makes its next decisive move. Liquidity Sweep The most recent drop into the 108,500 zone appears to have created a potential liquidity sweep. Price dipped below a short-term low, likely grabbing stop losses and inducing traders into shorts, which could fuel a reversal back upward. This kind of move often signals accumulation before the market retraces higher. CME Gap Dynamics The CME gap between 114,000 and 116,000 remains unfilled, making it a strong magnet for price. Bitcoin has a clear tendency to revisit and fill these inefficiencies, and until that gap is resolved, I am leaning toward another upward push. The gap aligns with the rejection area from the previous resistance, so it would be a logical point for price to revisit before resuming the downward move. Short-Term Scenarios If Bitcoin holds above the recent liquidity sweep and builds strength on lower timeframes, I expect a climb back toward the CME gap. Once that gap is filled, the reaction from 115,000–116,000 will be key. If sellers defend that level again, the market could set up for another decline, targeting the lows around 109,000 and potentially lower. On the other hand, a clean break and acceptance above 116,000 would challenge the bearish bias, but for now that is less likely given the trend context. Expectations and Targets The primary expectation is for Bitcoin to rally back into the 114,000–116,000 zone to fill the CME gap. From there, I anticipate sellers to step in again, driving price back down toward 110,000 and possibly retesting the sweep lows. This sequence of liquidity sweep, gap fill, and bearish continuation would align with the current market structure. Conclusion In summary, Bitcoin has swept liquidity at the lows and now has unfinished business above with the CME gap. A move up into that gap looks probable before we see continuation to the downside. As long as price respects the 4H resistance zone after the gap is filled, I will maintain a bearish outlook with eyes on new lows afterward. Disclosure: I am part of Trade Nation's Influencer program and receive a monthly fee for using their TradingView charts in my analysis. ___________________________________ Thanks for your support! If you found this idea helpful or learned something new, drop a like 👍 and leave a comment, I’d love to hear your thoughts! 🚀We closed below the low, not really sweeping it. Now this is not a big problem but i prefer a clean sweep. We could reject on the 4h fair value gap, come down once more to make a sweep and then reverse and make a new bullish move.
Disclaimer
Any content and materials included in Sahmeto's website and official communication channels are a compilation of personal opinions and analyses and are not binding. They do not constitute any recommendation for buying, selling, entering or exiting the stock market and cryptocurrency market. Also, all news and analyses included in the website and channels are merely republished information from official and unofficial domestic and foreign sources, and it is obvious that users of the said content are responsible for following up and ensuring the authenticity and accuracy of the materials. Therefore, while disclaiming responsibility, it is declared that the responsibility for any decision-making, action, and potential profit and loss in the capital market and cryptocurrency market lies with the trader.