Technical analysis by TehThomas about Symbol BTC on 11/14/2025

TehThomas
بیت کوین در نقطه حساس: آیا این حمایت، پایان دردهاست یا سقوط ادامه دارد؟
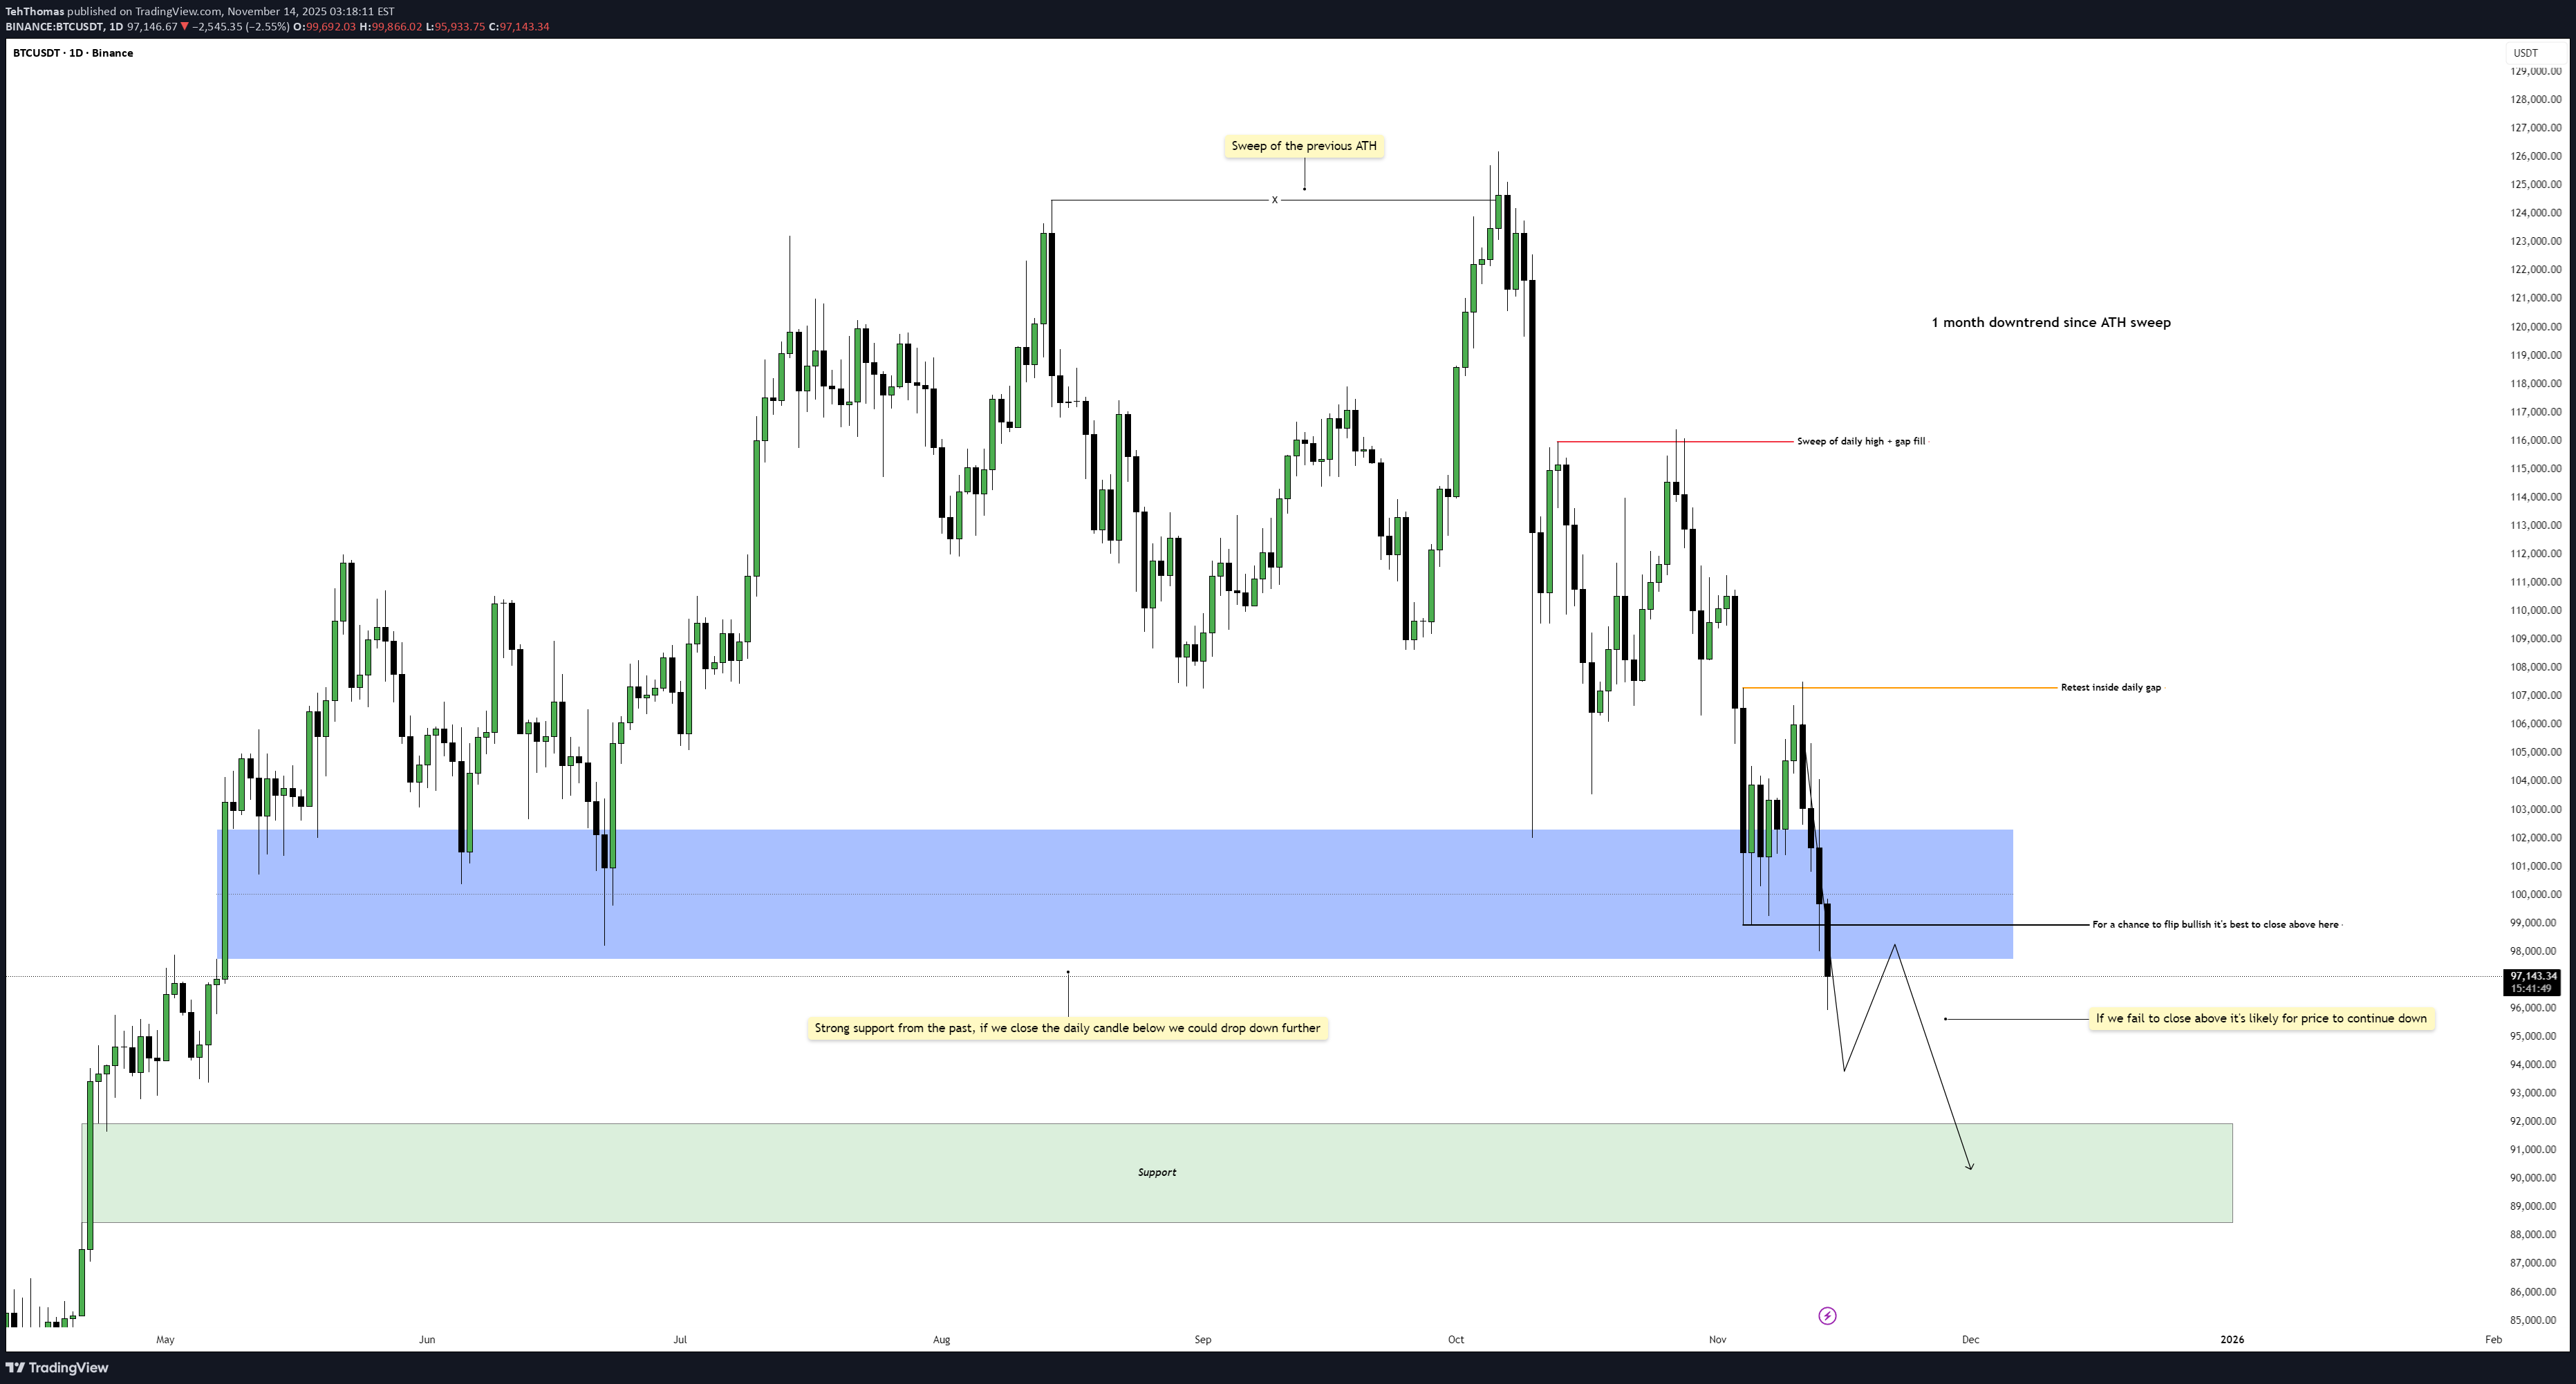
Bitcoin has been grinding lower for about a month after sweeping the previous all time high, which created the shift that kicked off this broader downtrend. Since that sweep, every push up has been met with selling, and the market has slowly bled its way back into a major support zone that has been significant in earlier cycles. This is the kind of level where the market usually makes a statement, either by holding and reversing or by breaking and opening the door to a deeper move. Support Structure and Key Reaction Point Price is sitting inside a wide support band that has given strong reactions in the past. It is a level traders know well and one that typically slows the market down. The difference this time is the structure leading into it. The downtrend has been consistent, with a string of lower highs showing that sellers remain in control for now. How the daily candle closes inside this zone will tell us a lot about whether buyers still have enough strength to defend it or if this level finally gives way. Recent Liquidity Events and Daily Gap Behavior Before dropping into this support, Bitcoin ran a recent daily high and instantly filled the gap above it, making it clear that the move was more about collecting liquidity than shifting the trend. After that, price slid lower again and retested the inside of the daily imbalance, but the retest failed to spark any meaningful demand. That kind of behavior often hints at a market that is still hunting lower levels rather than building upside structure. Bullish Scenario For sentiment to turn, Bitcoin needs to close back above the midline of this zone. That level is the one that would show buyers are actually stepping back in and absorbing the sell side. If the market can reclaim it, a short term reversal becomes possible, and the first targets would be the inefficiencies left behind during the recent selloff. From there, the market would still need to break a series of lower highs before a proper shift is confirmed on the daily timeframe. Bearish Scenario If the daily candle fails to close above that internal level highlighted on the chart, viewers should expect continuation lower to become the more probable scenario. A failed close there tells you buyers did not manage to hold the midpoint of the range, which usually means the market is preparing to reach for deeper liquidity. In that situation, the next major support zone below becomes the logical draw, and the path shown on the chart, a small bounce followed by another leg down, fits well with the current momentum. Conclusion Bitcoin is sitting at a decision point. Either this support zone does its job again and gives the market enough fuel for a recovery, or the daily close confirms that the level has weakened and the market is ready to reach for the next higher timeframe support. Until that close gives clarity, patience is key, since this is typically where traders get chopped if they try to force a direction too early. ___________________________________ Thanks for your support! If you found this idea helpful or learned something new, drop a like 👍 and leave a comment, I’d love to hear your thoughts! 🚀We closed the daily candle below our zone. Which confirms the bearish continuation