
TRADE_WITH_VISION
@t_TRADE_WITH_VISION

What symbols does the trader recommend buying?
Purchase History
پیام های تریدر
Filter
Signal Type
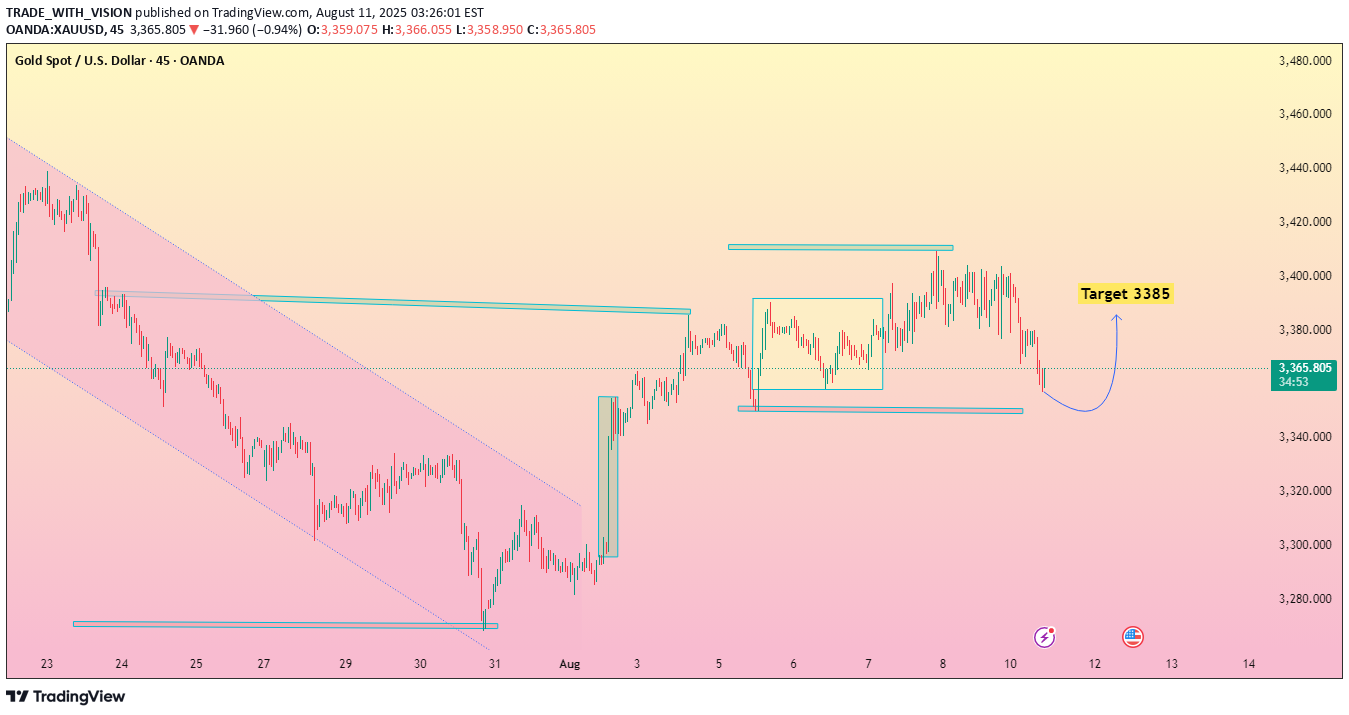
After breaking out of the descending channel, gold entered a consolidation phase before facing a corrective dip. Current price action suggests a potential reversal from support, with bullish momentum likely to target the 3385 level in the short term. Key support lies around 3,260, and sustained buying pressure above this zone could fuel the projected upward move.| Previous Trend: Price was in a strong downtrend, moving inside a descending channel until the end of July. This was followed by a sharp bullish breakout with strong volume, indicating a momentum shift. Current Structure: After the breakout, gold formed a sideways consolidation (yellow box), suggesting accumulation before the next move. Recently, price retraced from the upper resistance zone and is now testing the lower horizontal support. Key Levels: Support Zone: 3,250 – 3,260 (critical demand area; a bounce here is expected). Resistance Zone: 3,380 – 3,385 (short-term target). Breakout Confirmation: A strong bullish candle above 3,300 would strengthen the move toward the target.
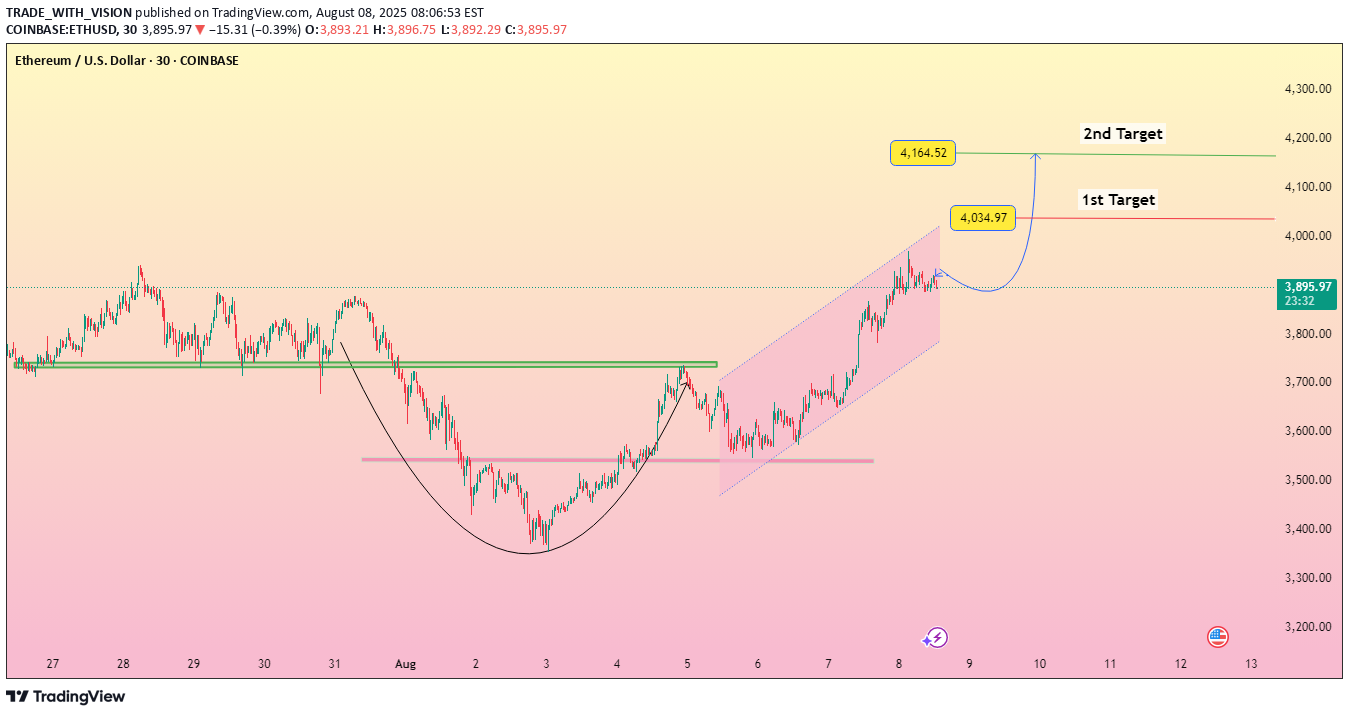
This chart displays a classic *"Cup and Handle"* formation in Ethereum (ETH/USD) on the 30-minute timeframe. After forming a rounded bottom (cup) and consolidating (handle), price breaks out into an ascending channel, indicating bullish momentum. Two clear bullish targets are projected: - *1st Target:* 4,034.97 - *2nd Target:*4,164.52 Support and resistance levels are marked, and the structure suggests potential continuation toward higher highs if volume and momentum sustain. Ideal for short-term swing traders watching breakout patterns. Pattern Observed:* *Cup and Handle Formation* - A bullish reversal pattern that signals a continuation of upward movement. - The *cup* shows a rounded bottom, indicating market recovery from a downtrend. - The *handle* (short consolidation) confirms buying pressure after the breakout. --- *Price Action & Trend:* - After breaking above the resistance (~3,580), price entered a *rising channel*, showing consistent higher highs and higher lows. - The breakout is strong, confirming bullish momentum. - Minor retracement or sideways movement expected before hitting target zones. — *Key Levels:* - *Current Price:*3,910 - *Breakout Point:* ~3,580 (acted as neckline/resistance) - *1st Target:*4,034.97 (short-term resistance) - *2nd Target:* $4,164.52 (next major resistance level) --- *Indicators & Signals:* - *Trend:* Strong uptrend within channel - *Volume (not visible but assumed):* Likely increased on breakout, which strengthens pattern confirmation - *No signs of major reversal yet*, but RSI or volume checks would confirm if it's overbought or sustable
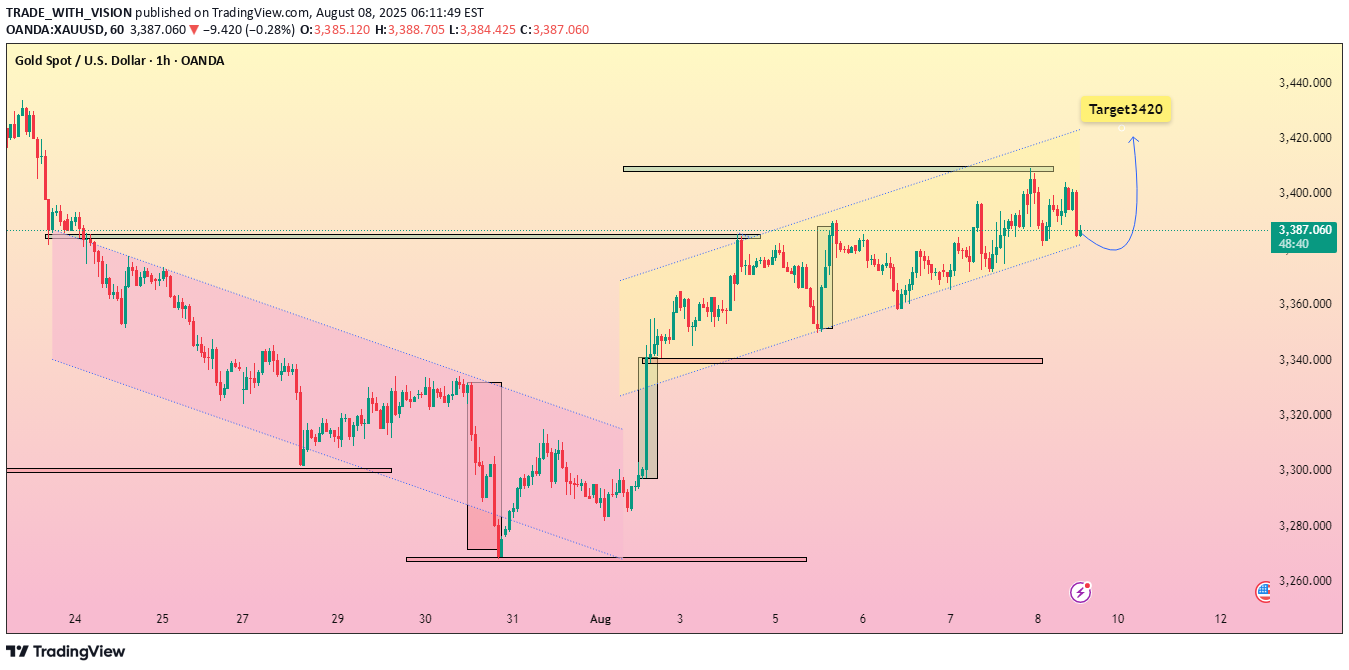
This XAU/USD (Gold Spot vs. U.S. Dollar) 1-hour chart shows a clear shift from a prior downtrend to a well-defined ascending channel. Price action is consolidating near the upper boundary, signaling strong bullish momentum. The projection targets $3,420, with the market likely to retest channel support before resuming the upward move. Traders may watch for a breakout confirmation above $3,400 to validate the bullish continuation. Trend Overview Previous Trend: A strong downtrend (marked in purple channel) that ended around the $3,260 zone. Current Trend: Price broke out of the downtrend and has been moving inside a rising parallel channel since early August. --- Key Technical Points 1. Support Zone: The lower boundary of the yellow ascending channel is acting as dynamic support. Strong horizontal support lies near $3,345–$3,350. 2. Resistance Zone: The upper channel line and horizontal resistance are around $3,400–$3,405. Main target zone at $3,420. 3. Market Structure: Higher highs and higher lows confirm bullish market structure. Sideways consolidation within the channel suggests accumulation before the next push. 4. Target Projection: If price respects channel support and breaks above $3,400, the projected measured move aligns with the $3,420 target.
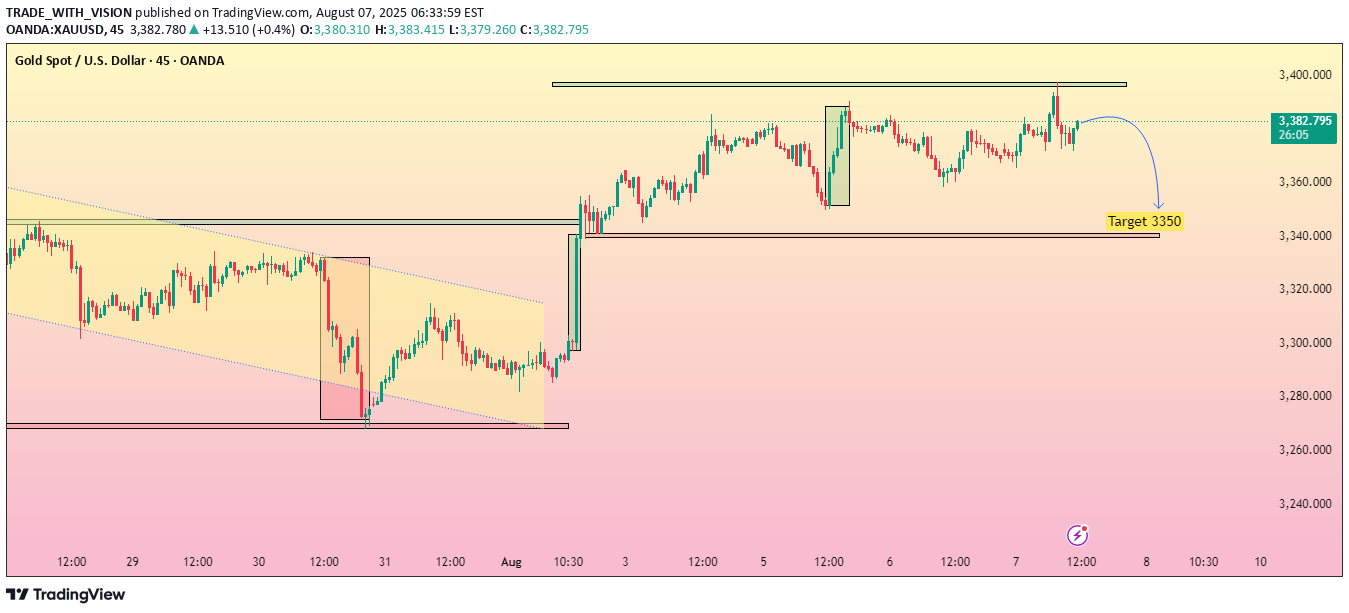
This 45-minute chart of Gold Spot (XAU/USD) highlights a possible bearish reversal pattern. After testing and rejecting resistance around the $3,400 level twice, price action shows signs of weakening bullish momentum. The chart suggests a corrective move is likely, targeting the support zone around $3,350, which aligns with the previous breakout level and horizontal support. Traders should watch for confirmation signals near the resistance before entering short positions. Keep an eye on volume and candlestick patterns to validate the move.🔍 Overview Current Price: $3,380.32 Timeframe: 45-minute chart Instrument: Gold Spot (XAU/USD) Trend: Sideways to bearish bias near resistance Key Zones: Resistance: ~$3,400 Support (Target): ~$3,350 Major Support: ~$3,295–$3,300 (prior consolidation low) --- 🧱 Chart Structure & Key Observations 1. Double Top Formation Price has tested the $3,400 zone twice and failed to break higher. This creates a potential double top – a bearish reversal pattern. 2. Price Rejection Long upper wicks near the top suggest strong selling pressure. The recent move downward signals a shift in sentiment. 3. Bearish Impulse & Projection The forecasted arrow shows a corrective move toward $3,350. This level coincides with previous breakout structure and acts as a logical support retest.
Disclaimer
Any content and materials included in Sahmeto's website and official communication channels are a compilation of personal opinions and analyses and are not binding. They do not constitute any recommendation for buying, selling, entering or exiting the stock market and cryptocurrency market. Also, all news and analyses included in the website and channels are merely republished information from official and unofficial domestic and foreign sources, and it is obvious that users of the said content are responsible for following up and ensuring the authenticity and accuracy of the materials. Therefore, while disclaiming responsibility, it is declared that the responsibility for any decision-making, action, and potential profit and loss in the capital market and cryptocurrency market lies with the trader.