Technical analysis by TRADE_WITH_VISION about Symbol PAXG: Buy recommendation (8/8/2025)

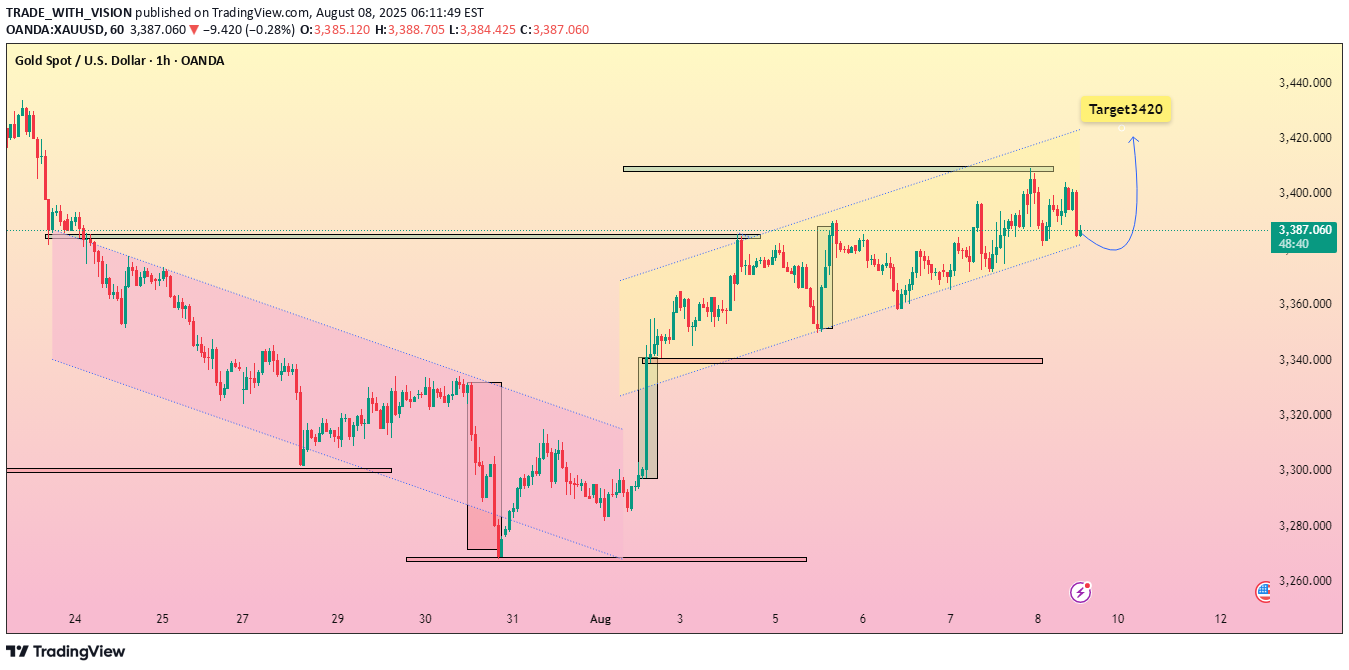
This XAU/USD (Gold Spot vs. U.S. Dollar) 1-hour chart shows a clear shift from a prior downtrend to a well-defined ascending channel. Price action is consolidating near the upper boundary, signaling strong bullish momentum. The projection targets $3,420, with the market likely to retest channel support before resuming the upward move. Traders may watch for a breakout confirmation above $3,400 to validate the bullish continuation. Trend Overview Previous Trend: A strong downtrend (marked in purple channel) that ended around the $3,260 zone. Current Trend: Price broke out of the downtrend and has been moving inside a rising parallel channel since early August. --- Key Technical Points 1. Support Zone: The lower boundary of the yellow ascending channel is acting as dynamic support. Strong horizontal support lies near $3,345–$3,350. 2. Resistance Zone: The upper channel line and horizontal resistance are around $3,400–$3,405. Main target zone at $3,420. 3. Market Structure: Higher highs and higher lows confirm bullish market structure. Sideways consolidation within the channel suggests accumulation before the next push. 4. Target Projection: If price respects channel support and breaks above $3,400, the projected measured move aligns with the $3,420 target.
