Technical analysis by TRADE_WITH_VISION about Symbol PAXG: Sell recommendation (8/7/2025)

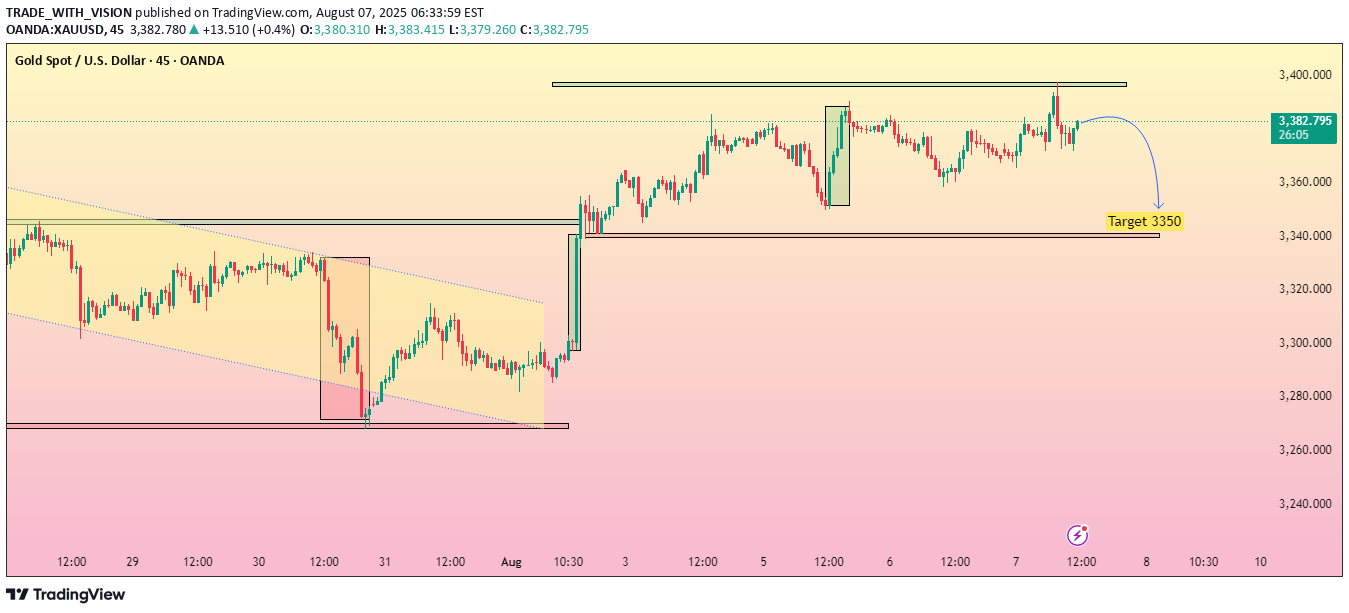
This 45-minute chart of Gold Spot (XAU/USD) highlights a possible bearish reversal pattern. After testing and rejecting resistance around the $3,400 level twice, price action shows signs of weakening bullish momentum. The chart suggests a corrective move is likely, targeting the support zone around $3,350, which aligns with the previous breakout level and horizontal support. Traders should watch for confirmation signals near the resistance before entering short positions. Keep an eye on volume and candlestick patterns to validate the move.🔍 Overview Current Price: $3,380.32 Timeframe: 45-minute chart Instrument: Gold Spot (XAU/USD) Trend: Sideways to bearish bias near resistance Key Zones: Resistance: ~$3,400 Support (Target): ~$3,350 Major Support: ~$3,295–$3,300 (prior consolidation low) --- 🧱 Chart Structure & Key Observations 1. Double Top Formation Price has tested the $3,400 zone twice and failed to break higher. This creates a potential double top – a bearish reversal pattern. 2. Price Rejection Long upper wicks near the top suggest strong selling pressure. The recent move downward signals a shift in sentiment. 3. Bearish Impulse & Projection The forecasted arrow shows a corrective move toward $3,350. This level coincides with previous breakout structure and acts as a logical support retest.
