
TAS1TheActualSnail
@t_TAS1TheActualSnail
What symbols does the trader recommend buying?
Purchase History
پیام های تریدر
Filter
Signal Type

TAS1TheActualSnail
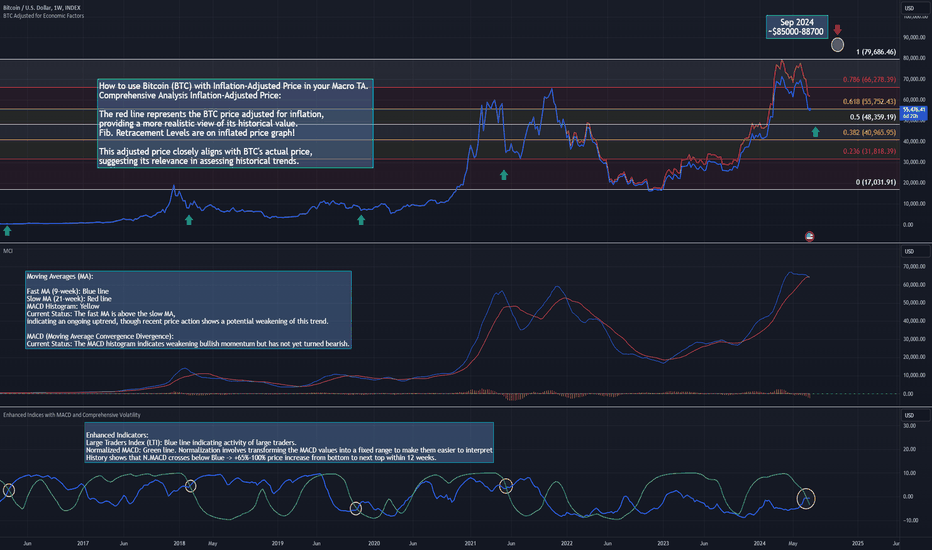
This analysis examines BTC's price action, both actual and inflation-adjusted, using key technical indicators and Fibonacci retracement levels on the weekly chart. The goal is to provide insights into potential future movements and the overall trend. Key Observations from the Chart Inflation-Adjusted Price and Fibonacci Retracement Levels Inflation-Adjusted Price: The red line represents the BTC price adjusted for inflation, providing a more realistic view of its historical value. This adjusted price closely aligns with BTC's actual price, suggesting its relevance in assessing historical trends. Fibonacci Retracement Levels: 0.236 Level ($31,867.68) 0.382 Level ($41,045.73) 0.5 Level ($48,463.61) 0.618 Level ($55,881.49) 0.786 Level ($66,442.54) 1 Level ($79,895.31) These levels are critical for identifying potential support and resistance zones. Technical Indicators Moving Averages (MA): Fast MA (9-week): Blue line Slow MA (21-week): Red line Current Status: The fast MA is above the slow MA, indicating an ongoing uptrend, though recent price action shows a potential weakening of this trend. MACD (Moving Average Convergence Divergence): Shows the momentum of the price movement. Current Status: The MACD histogram indicates weakening bullish momentum but has not yet turned bearish. Enhanced Indicators: Large Traders Index (LTI): Blue line indicating activity of large traders. Normalized MACD: Green line indicating the normalized MACD (Moving Average Convergence Divergence) is a variation of the traditional MACD indicator that has been adjusted or scaled to fit within a specific range, often to make it easier to compare with other indicators or to standardize the values for analysis. Key Levels and Their Implications Support and Resistance Levels Current Price Action: Resistance at $55,881.49 (0.618 Fibonacci level): A critical level that BTC needs to break for continued bullish momentum. Support at $48,463.61 (0.5 Fibonacci level): Immediate support level that needs to hold to prevent further decline. Key Support Zone at $31,867.68 (0.236 Fibonacci level): Significant support that could be tested if the current support fails. Potential Future Movements Bullish Scenario Break Above $55,881.49: If BTC breaks above this level, it could potentially move towards the $66,442.54 and eventually aim for $79,895.31. Indicators like MACD turning bullish and increased activity by large traders would support this scenario. Sustained Uptrend: The moving averages need to maintain the current crossover, and the RSI should remain neutral or move towards overbought territory. Bearish Scenario Break Below $48,463.61: If BTC fails to hold this support, it might find support at $41,045.73 or even $31,867.68. Indicators turning bearish, such as MACD crossing below the signal line, would reinforce this scenario. Potential for Further Downside: If the price action breaks key support levels and volatility increases, a more prolonged correction could occur. Conclusion Summary of Key Insights Current Trend: BTC is in an uptrend, with the fast MA above the slow MA, though recent price action suggests caution. Key Levels: Immediate resistance at $55,881.49 and support at $48,463.61. Critical support at $31,867.68. Indicators: MACD, volatility measures, and trader indices provide additional insights into momentum and market sentiment. Future Outlook Bullish Continuation: Watch for a break above $55,881.49 with supporting indicators. Bearish Risk: Monitor support at $48,463.61, with potential downside to $41,045.73 or $31,867.68 if broken. ---------------------------------------- My scripts are free for all TradingView users. Feedbacks are welcome!

TAS1TheActualSnail
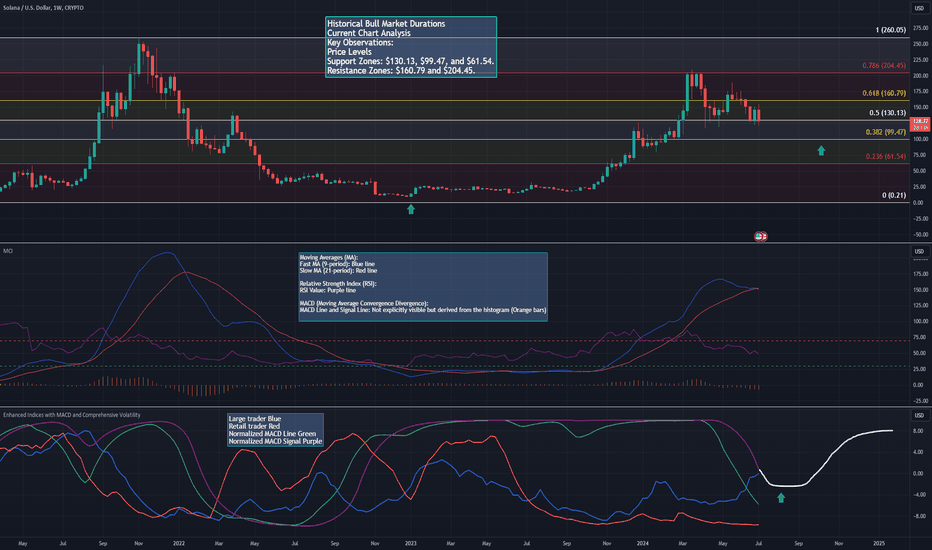
Solana (SOL) has captured the attention of traders and investors alike with its impressive price movements and robust technology. This comprehensive analysis dives into the current state of Solana's bull market, examining key indicators, historical trends, and potential future scenarios based on the weekly chart data. Historical Context and Past Bull Markets Solana has experienced several notable bull markets in the past, with the most significant occurring from late 2020 to mid-2021, lasting approximately 7-8 months. These periods were characterized by rapid price appreciation and heightened market activity, driven by strong market sentiment and broader cryptocurrency market cycles. Current Market Analysis Key Support and Resistance Levels Support Zones: $130.13: Immediate support level. $99.47: Important mid-level support. $61.54: Critical long-term support. Resistance Zones: $160.79: Significant resistance level. $204.45: Higher resistance level indicating potential upside targets. Technical Indicators Moving Averages (MA): The fast MA (9-week) is above the slow MA (21-week), indicating a sustained bullish trend. Relative Strength Index (RSI): Currently in a neutral zone, not indicating overbought or oversold conditions, suggesting room for further price movements. MACD (Moving Average Convergence Divergence): Positive but showing signs of weakening momentum. A bullish crossover in the normalized MACD line above the signal line would reinforce the bullish scenario. Enhanced Indicators: Large Traders Index (LTI): Increased activity by large traders often precedes significant market moves. Retail Traders Index (RTI): Measures the activity of retail traders. Normalized Combined Volatility: Indicates potential for significant price movements. Market Sentiment and Volatility The enhanced normalized volatility suggests a period of high market activity, typical in bull markets. Increased activity by large traders (blue line) and retail traders (red line) provides insights into market sentiment, with large trader activity often indicating upcoming major moves. Future Projections Short-Term (Next 3-6 Months) Bullish Scenario: If Solana maintains support above $130.13 and bullish indicators remain strong, we could see a continuation of the uptrend, potentially testing the $160.79 resistance level. Bearish Scenario: A break below $130.13 could lead to a test of the $99.47 support level. A sustained move below this level might signal further downside. Medium-Term (6-12 Months) The bull market could potentially extend, with the possibility of reaching new all-time highs driven by strong market sentiment, technological advancements, and broader market recovery. Long-Term Bull markets in cryptocurrencies can last beyond a year, influenced by major events, adoption, and technological progress. Continuous monitoring of key support and resistance levels, along with broader market trends, will be crucial. Conclusion The current bull market for Solana shows strong potential for continuation, with key support levels at $130.13 and $99.47 providing crucial benchmarks. Breaking the $160.79 resistance level could signal further upside. Monitoring technical indicators like the moving averages, RSI, MACD, and enhanced volatility measures will provide valuable insights into the market's direction. Based on historical trends and current analysis, the bull market could last another 3-12 months. P.S. My scripts are free to download.

TAS1TheActualSnail
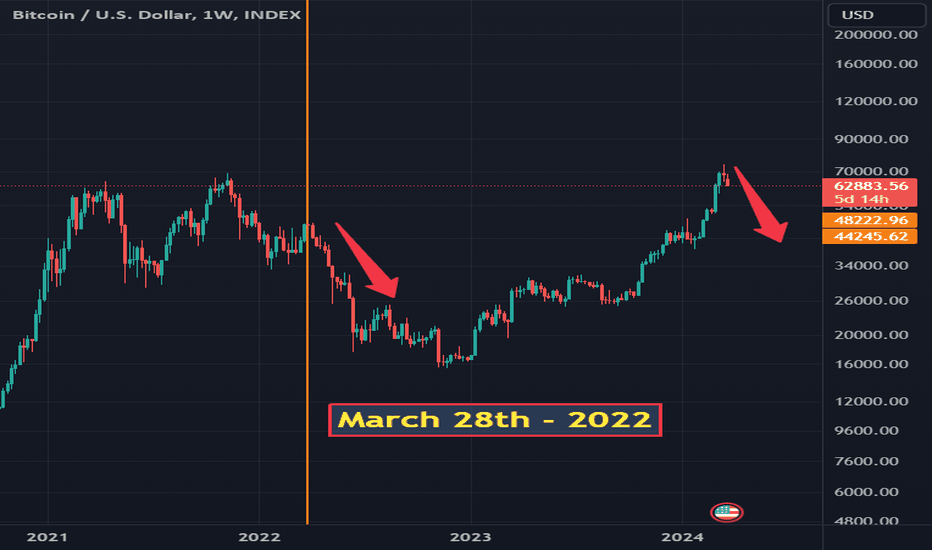
Hello everyone, Let's take a closer look at what's happening with USDT (Tether) dominance on the weekly charts and how it might be signaling a key movement in the crypto space. Now, we've noticed that USDT dominance seems to be hitting a support level and is starting to climb up. This is quite significant because USDT dominance reflects Tether's share of the total crypto market cap. When traders and investors start moving their funds into USDT, it's often a move to safety, especially when the market shows signs of volatility or a potential downturn. Now, here's where it gets interesting. If we flash back to March 28, 2022, we can see a similar situation unfolding – USDT dominance found support, and this correlated with a notable correction in the price of Bitcoin. We're spotting what could be a repeating pattern here. The climb in USDT dominance could be indicating that once again, traders might be hedging against current market movements, signaling caution as we see capital flowing into the stablecoin – a classic move during times of uncertainty. let's dial into the situation we're seeing here. We've identified a possible pattern with USDT dominance suggesting that we might be in for a market correction. The last time we saw something like this, we were deep in a bear market. Now, the dynamics are slightly different. We're approaching a Bitcoin halving event. Historically, halvings tend to have bullish implications for Bitcoin due to the reduced supply of new bitcoins entering the market. However, the anticipation of such events can bring about increased volatility. If we're drawing parallels with the last occurrence, we should consider that although history doesn't always repeat itself, it often rhymes. How much of a correction could we see? That's the million-dollar question. Corrections in a pre-halving period can vary widely. They could be short and sharp, or slightly deeper as traders position themselves ahead of the event. What's important to note is that while we could see a dip in response to the rising USDT dominance, the upcoming halving could also provide a counterbalance to a lengthy bearish trend. Keep in mind, corrections are a natural part of market cycles, even when an overall bullish sentiment is expected. They offer a reset, a breath for the market to consolidate before the next potential move. The key takeaway here is not the correction itself but how we position ourselves to manage it and potentially take advantage of the opportunities it presents. As always, my advice is not to fixate on the depth of a potential correction but rather to focus on your strategy. Do you have your risk management in place? Are you diversified enough to handle unexpected shifts? These are the factors within your control. Let's watch the charts, stay informed on global market trends, and remember, the halving is coming up, which could add a whole new dimension to the typical market ebb and flow. Trade wisely, everyone

TAS1TheActualSnail
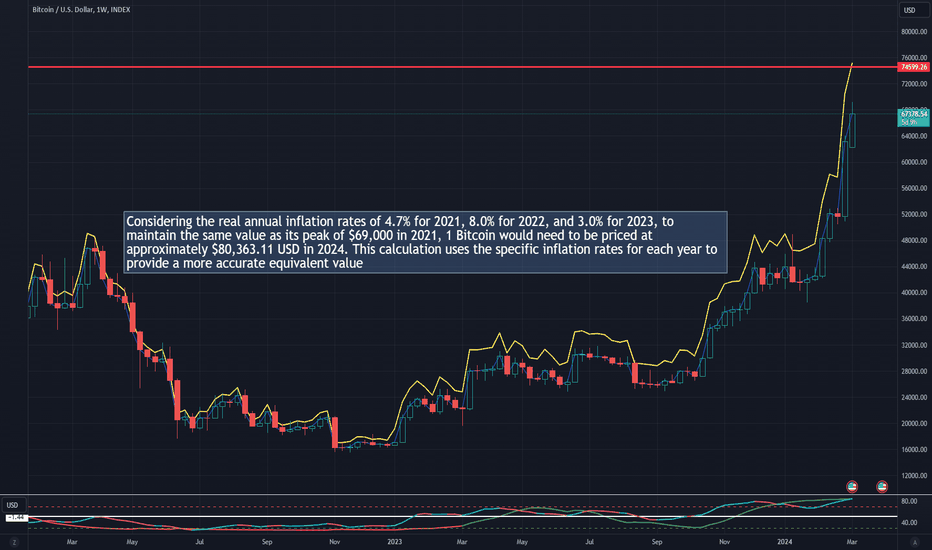
Based on the core Consumer Price Index (CPI), which excludes volatile items like food and energy to provide a clearer view of underlying inflation trends: For January 2024, the year-over-year core CPI was 3.87%. In 2023, the core CPI varied significantly, starting at 5.54% in January, dipping to around 4% towards the end of the year, and ending at 3.91% in December. Throughout 2022, the core CPI saw a gradual increase from 6.08% in January, reaching a peak of 6.31% in October, and then slightly declining to 5.69% by December. In 2021, the core CPI was lower at the start of the year, with January at 1.49%, and saw a gradual increase throughout the year, ending at 5.63% in December. To calculate the equivalent value of 1 Bitcoin in 2024 dollars, considering the actual core inflation rates, we will use the December figures for each year as representative annual rates. Let's use these rates for a calculation. Considering the actual core Consumer Price Index (CPI) inflation rates, to maintain the same value as its peak of $69,000 in 2021, 1 Bitcoin would need to be priced at approximately $80,043.78 USD in 2024. This calculation uses the core CPI rates of 5.63% for 2021, 5.69% for 2022, and 3.91% for 2023, providing an adjusted value that reflects underlying inflation trends without the impact of volatile items like food and energy.

TAS1TheActualSnail
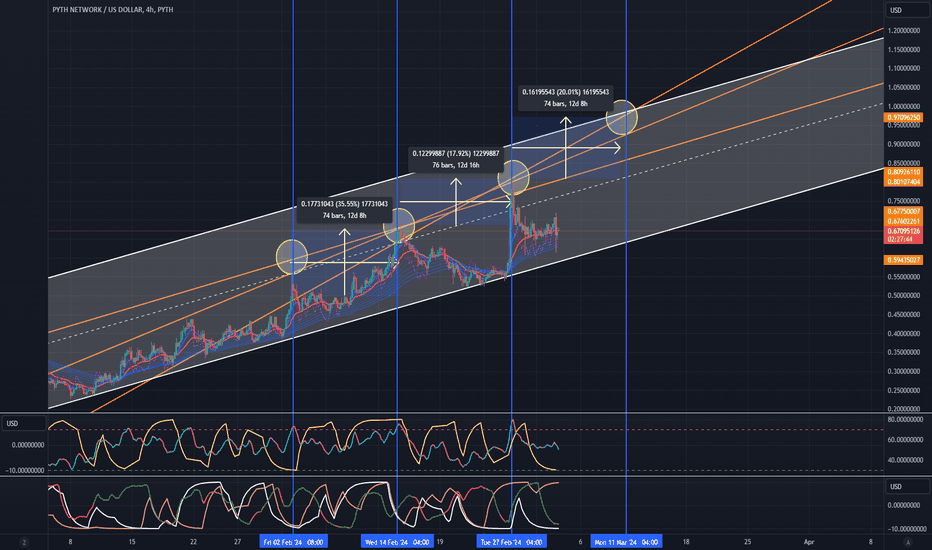
My scripts found a pattern in PYTH which if it repeats, pushes the price +50% close to $1 clsoe to end of next week (probably Sunday March 10th because candles range are 74-77). in the scripts were considered Large VS Retail traders, DMA, Numbers of candles, trendline angles, Advanced RSI, volatility index and so on.

TAS1TheActualSnail
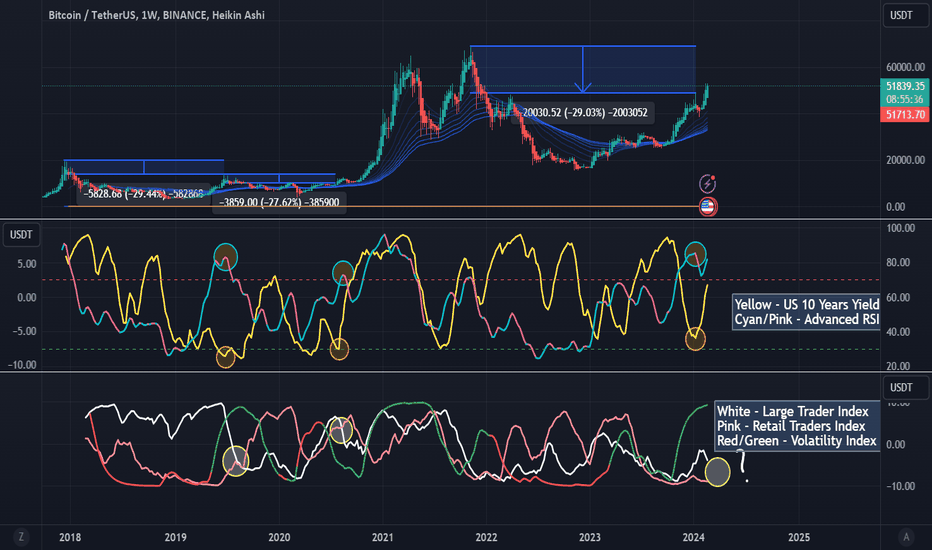
When I am comparing the weekly data, I see similar patterns repeating way too early for Bitcoin's bullmarket. Market is too hot. Why am I saying that? Lets see: 1st: On July 2019, Weekly RSI hits the top, 10 year yield makes a lower low, from that moment a healthy correction starts and lasts for a couple of weeks, during this time in the bottom chart, we can see the volatility index is very high, Retail index is rising meaning the retail is coming in the market while the big traders are lowering in number until they cross and shift happens, there are more retail than large traders. 2nd : In August 2020 post halving, similar shifts in traders occurred right after 10 YY bottomed, and WRSI topped, volatility index this time is lower but green, showing lower volatility but the market sentiment is bullish. 3rd time: On Jan 2024, coincidence is that with ETF news, RSI topped, 10 YY bottomed, and the healthy correction happened as well. Corrections were Close to 29% from the last market cycle ATH and mid-cycle top. In my opinion, with BTC ETF and global situation of breaking ATHs while technicaly some countries are in recession, shows market doesnt care anymore. We are in a frenzy of everything bullmarket. This market sentiment made that BTC price wise compared to USD in the charts looking ahead of the schedule +1 Year right now. Volatility index very high nad bullish, RSI topped tested the resitance and going up?!! Some of these indicators don't show a prehalving market in the chart. Final call, imo a very possible scenario is because of the market in election years and the historical data proving that, we will have a crazy bullmarket, with crazy multi-year bearmarket. I will enjoy the ride, but don't be greedy and take profits. Second scenario, is very unlikely. What do you think?

TAS1TheActualSnail
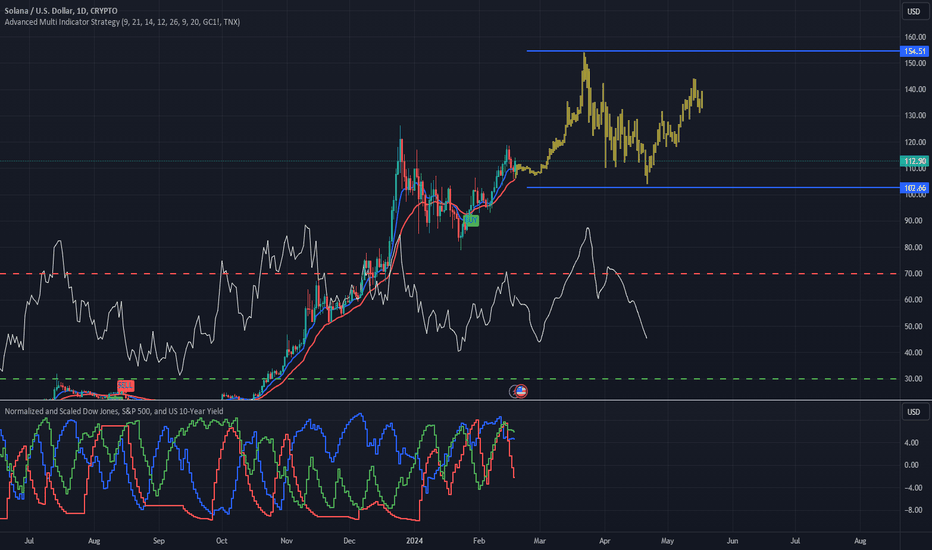
Long Term EMA Index acting as support. $102 is a tough resistance, however SOL moved very fast recently, Large Trader index Dropped 30% on Daily chart. Based on the experimental data, it is very likely to see another run up to $154 per SOL in third week of March.

TAS1TheActualSnail
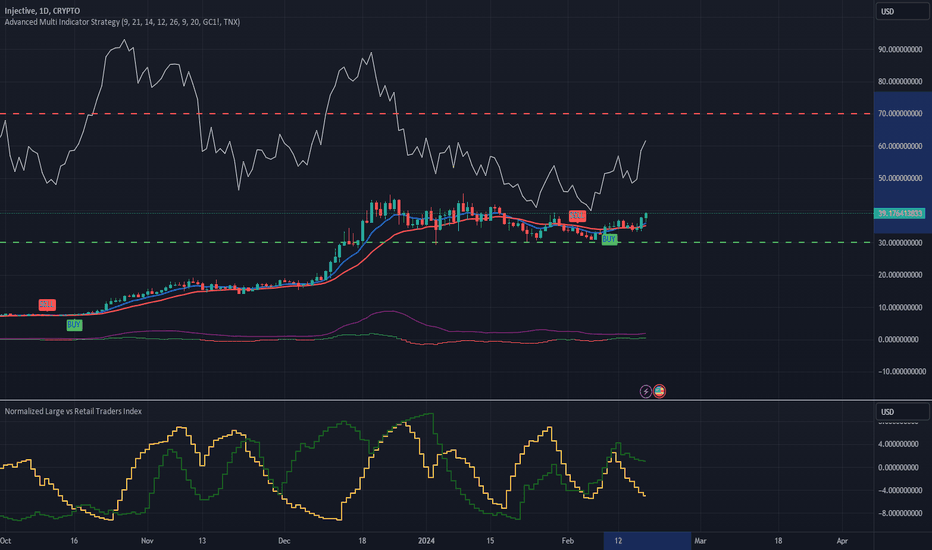
I am testing a new script which overlaps many data. Short and Long-Term EMAs: For trend identification. RSI: To gauge market momentum. MACD (Moving Average Convergence Divergence): For both trend following and momentum, with the histogram providing visual cues on momentum shifts. Volatility Calculation: Helps in understanding market stability or turbulence, potentially indicating periods of higher risk or opportunity. This indicator shows the same pattern INJ repeated and I expect in the next 19 days a 133% price increase, up to $73.

TAS1TheActualSnail
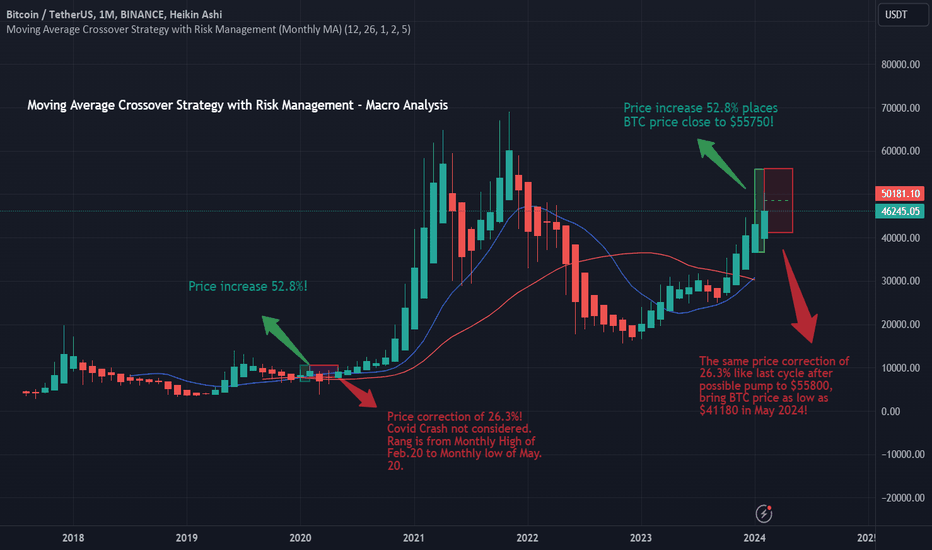
Considering the new (MA) Crossover Strategy with Risk Management - Macro Analysis, on monthly chart before the halving in 2020 the cross over happened. Price went up 52.8% and correction of 26.3% happened! (Covid Crash not considered as a new global pandemic is not expected in the upcoming weeks) Correction Range is from Monthly High of Feb.2020 to Monthly low of May.2020. Considering similar scenario with 52.8% price increase and 26.3%decrease, it results the BTC monthly high price of $55750 for Feb 2024 and as low as 41180 in May $2024! Indicator is under proof of time test, Short term Cautious and Long term Bullish!

TAS1TheActualSnail
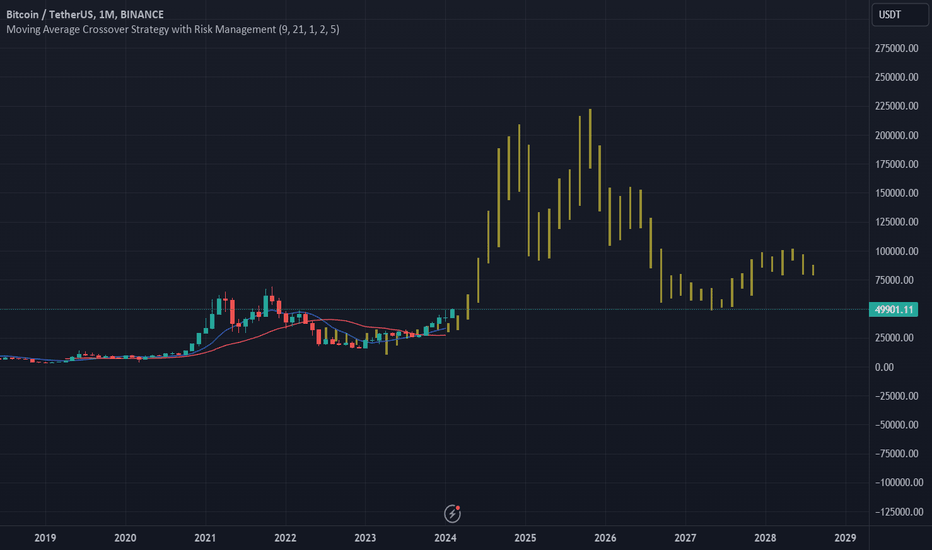
New indicator under test. Moving Average Crossover Strategy with Risk Management had a cross over on Monthly; same happened last cycle before halving. Since that cross, BTC pumped 794%. If this time does the same. 26 candles, and 794%, places BTC price in Nov 2025 close to $200K, marking the top of the cycle. The shown candles are just copy of the last cycle just for illustration possible scenario.
Disclaimer
Any content and materials included in Sahmeto's website and official communication channels are a compilation of personal opinions and analyses and are not binding. They do not constitute any recommendation for buying, selling, entering or exiting the stock market and cryptocurrency market. Also, all news and analyses included in the website and channels are merely republished information from official and unofficial domestic and foreign sources, and it is obvious that users of the said content are responsible for following up and ensuring the authenticity and accuracy of the materials. Therefore, while disclaiming responsibility, it is declared that the responsibility for any decision-making, action, and potential profit and loss in the capital market and cryptocurrency market lies with the trader.