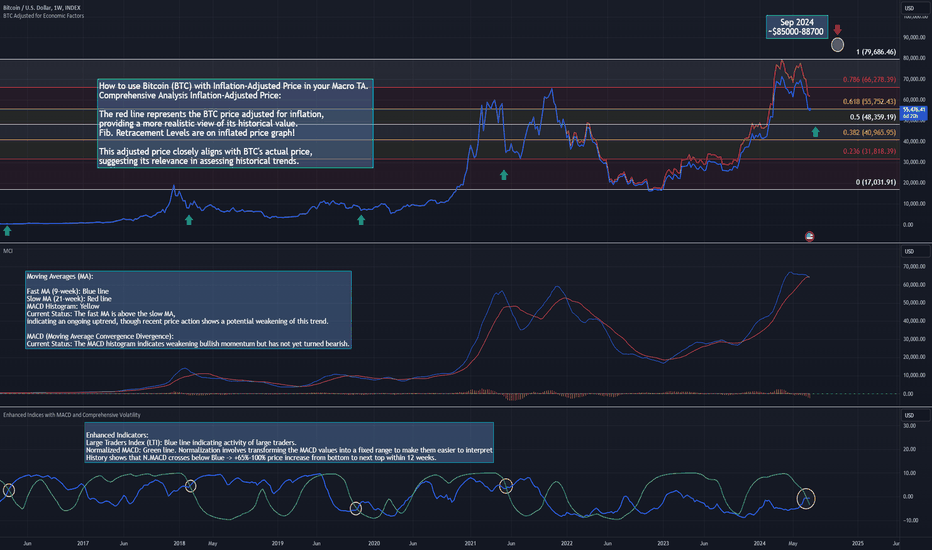
Technical analysis by TAS1TheActualSnail about Symbol BTC on 7/8/2024

TAS1TheActualSnail

This analysis examines BTC's price action, both actual and inflation-adjusted, using key technical indicators and Fibonacci retracement levels on the weekly chart. The goal is to provide insights into potential future movements and the overall trend. Key Observations from the Chart Inflation-Adjusted Price and Fibonacci Retracement Levels Inflation-Adjusted Price: The red line represents the BTC price adjusted for inflation, providing a more realistic view of its historical value. This adjusted price closely aligns with BTC's actual price, suggesting its relevance in assessing historical trends. Fibonacci Retracement Levels: 0.236 Level ($31,867.68) 0.382 Level ($41,045.73) 0.5 Level ($48,463.61) 0.618 Level ($55,881.49) 0.786 Level ($66,442.54) 1 Level ($79,895.31) These levels are critical for identifying potential support and resistance zones. Technical Indicators Moving Averages (MA): Fast MA (9-week): Blue line Slow MA (21-week): Red line Current Status: The fast MA is above the slow MA, indicating an ongoing uptrend, though recent price action shows a potential weakening of this trend. MACD (Moving Average Convergence Divergence): Shows the momentum of the price movement. Current Status: The MACD histogram indicates weakening bullish momentum but has not yet turned bearish. Enhanced Indicators: Large Traders Index (LTI): Blue line indicating activity of large traders. Normalized MACD: Green line indicating the normalized MACD (Moving Average Convergence Divergence) is a variation of the traditional MACD indicator that has been adjusted or scaled to fit within a specific range, often to make it easier to compare with other indicators or to standardize the values for analysis. Key Levels and Their Implications Support and Resistance Levels Current Price Action: Resistance at $55,881.49 (0.618 Fibonacci level): A critical level that BTC needs to break for continued bullish momentum. Support at $48,463.61 (0.5 Fibonacci level): Immediate support level that needs to hold to prevent further decline. Key Support Zone at $31,867.68 (0.236 Fibonacci level): Significant support that could be tested if the current support fails. Potential Future Movements Bullish Scenario Break Above $55,881.49: If BTC breaks above this level, it could potentially move towards the $66,442.54 and eventually aim for $79,895.31. Indicators like MACD turning bullish and increased activity by large traders would support this scenario. Sustained Uptrend: The moving averages need to maintain the current crossover, and the RSI should remain neutral or move towards overbought territory. Bearish Scenario Break Below $48,463.61: If BTC fails to hold this support, it might find support at $41,045.73 or even $31,867.68. Indicators turning bearish, such as MACD crossing below the signal line, would reinforce this scenario. Potential for Further Downside: If the price action breaks key support levels and volatility increases, a more prolonged correction could occur. Conclusion Summary of Key Insights Current Trend: BTC is in an uptrend, with the fast MA above the slow MA, though recent price action suggests caution. Key Levels: Immediate resistance at $55,881.49 and support at $48,463.61. Critical support at $31,867.68. Indicators: MACD, volatility measures, and trader indices provide additional insights into momentum and market sentiment. Future Outlook Bullish Continuation: Watch for a break above $55,881.49 with supporting indicators. Bearish Risk: Monitor support at $48,463.61, with potential downside to $41,045.73 or $31,867.68 if broken. ---------------------------------------- My scripts are free for all TradingView users. Feedbacks are welcome!