
Strength_in_numbers
@t_Strength_in_numbers

What symbols does the trader recommend buying?
Purchase History
پیام های تریدر
Filter
Strength_in_numbers
بیت کوین در آستانه انفجار؟ نشانههای بازگشت قدرتمند قیمت (RSI و سطوح کلیدی)
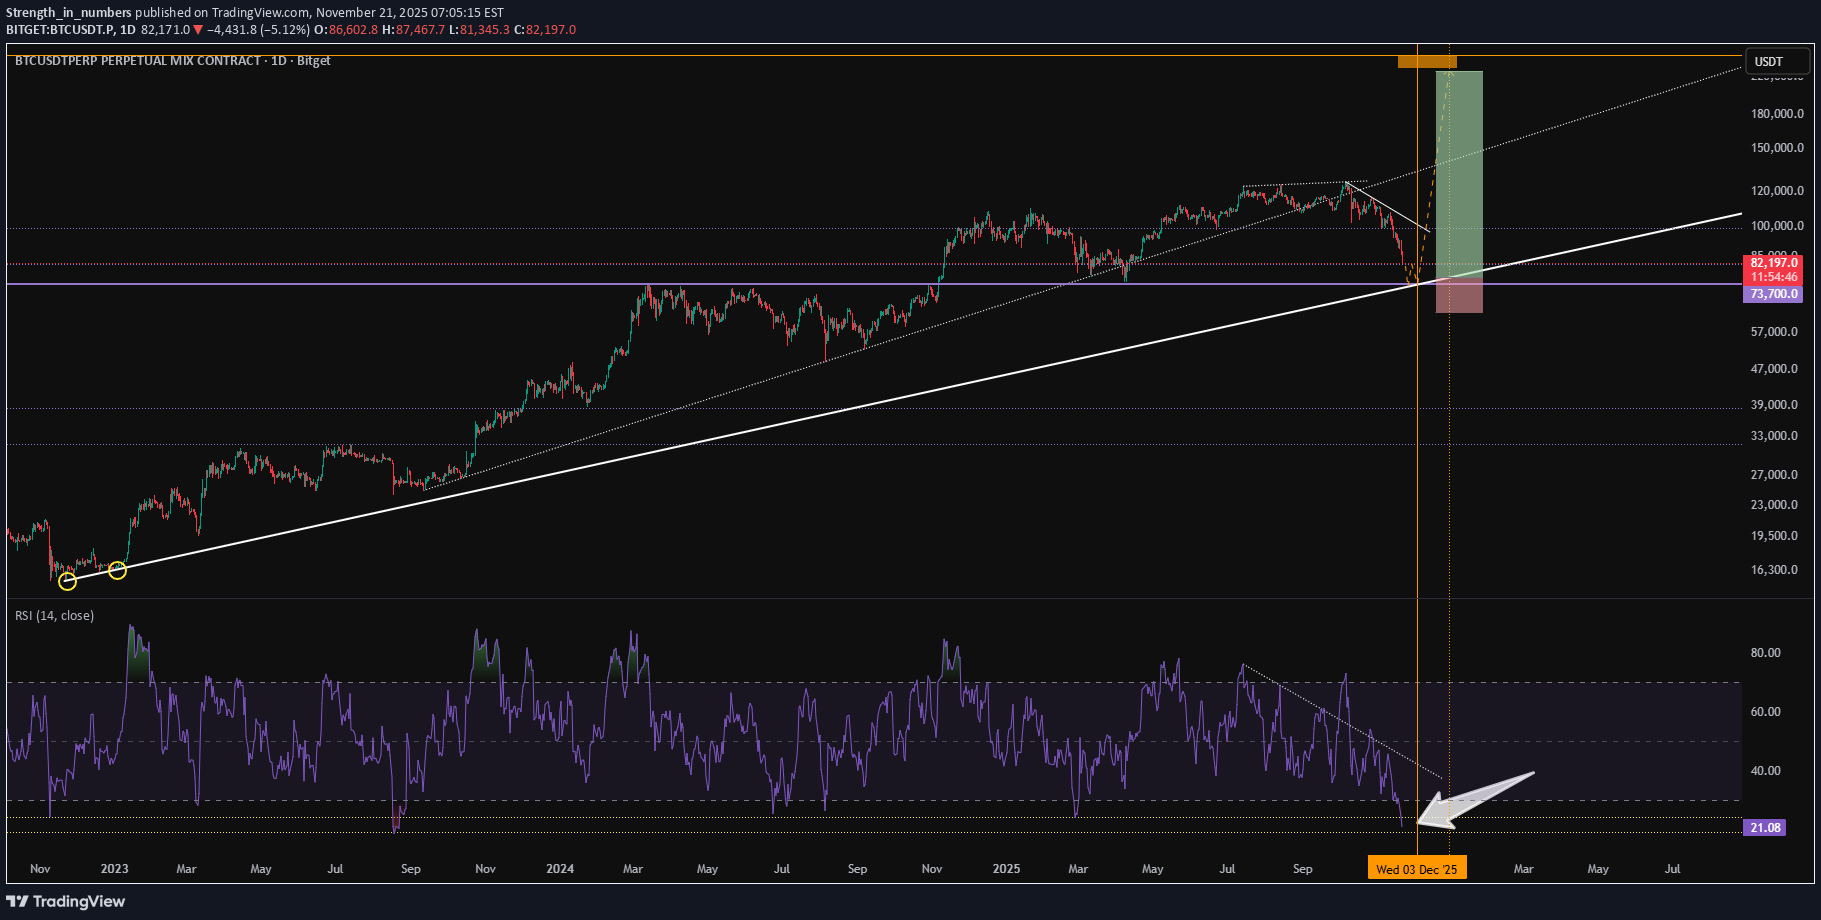
BTC has moved into "Oversold" territory on the daily RSI - clue no. 1 The RSI is also nearing "oversold" on the Weekly TF - clue no. 2 Price is approaching the previous high of 73.7K - this price level which acted as resistance could well flip into support as it did in April. Clues I would be looking for to go long (that haven't happened yet): Bullish div. on the Daily RSI A touch on the thick white line (projection from Dec 2022) Price not falling sub-74K Anticipate an explosive move into December at the start of the month - possibly 4th Dec. Entry @ 77K TP @ 240K SL @ 63K
Strength_in_numbers
اورکا (ORCA) آماده جهش ۱۱ برابری؟ سطوح حیاتی و هدف نهایی رمز ارز
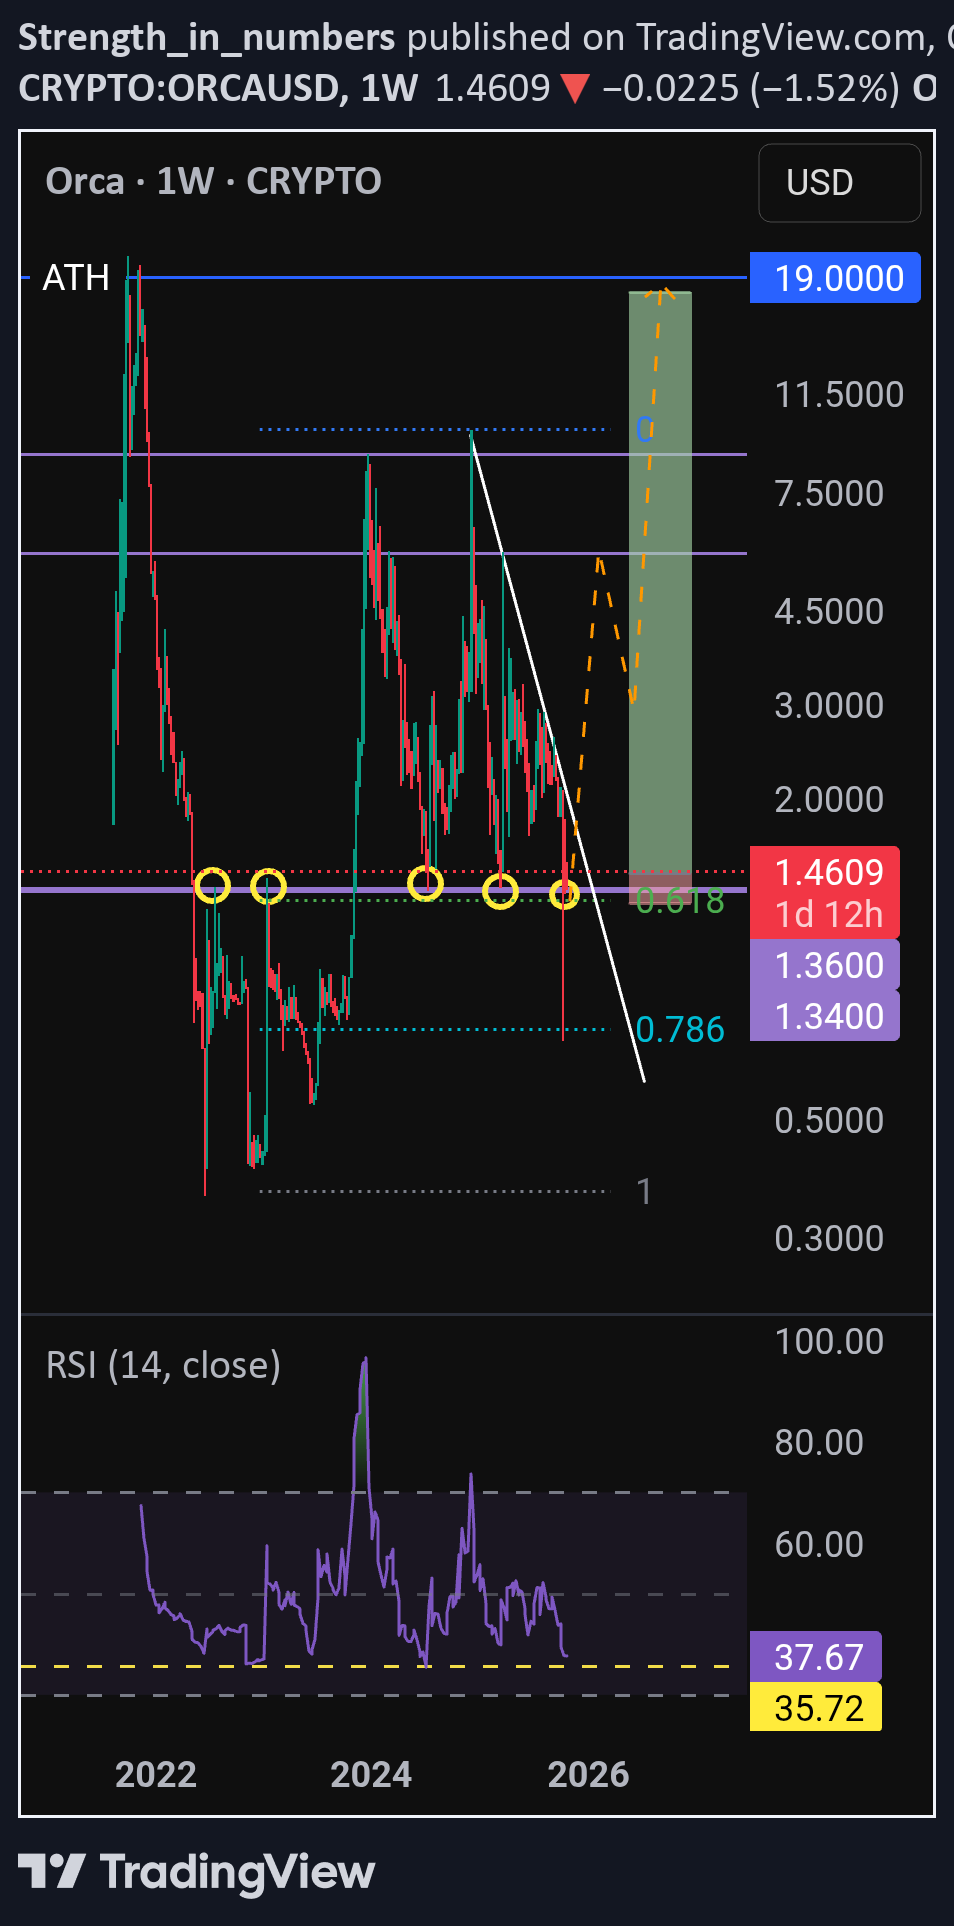
Orca has historically reacted to the 1.34 - 1.36 zone (which is also the 618) ATH = 19.00 A breakout of the downtrend (white line could be bullish for p.a.) Barriers / resistance points @ 5 and 8. Orca would need to break above these levels in order to reach the ATH. Assuming ATH as TP this is 1,120% uplift fron currently position.
Strength_in_numbers
پتانسیل نهفته کادنا (KDA): کف قیمتی رسید؟ (تحلیل تکنیکال قوی)
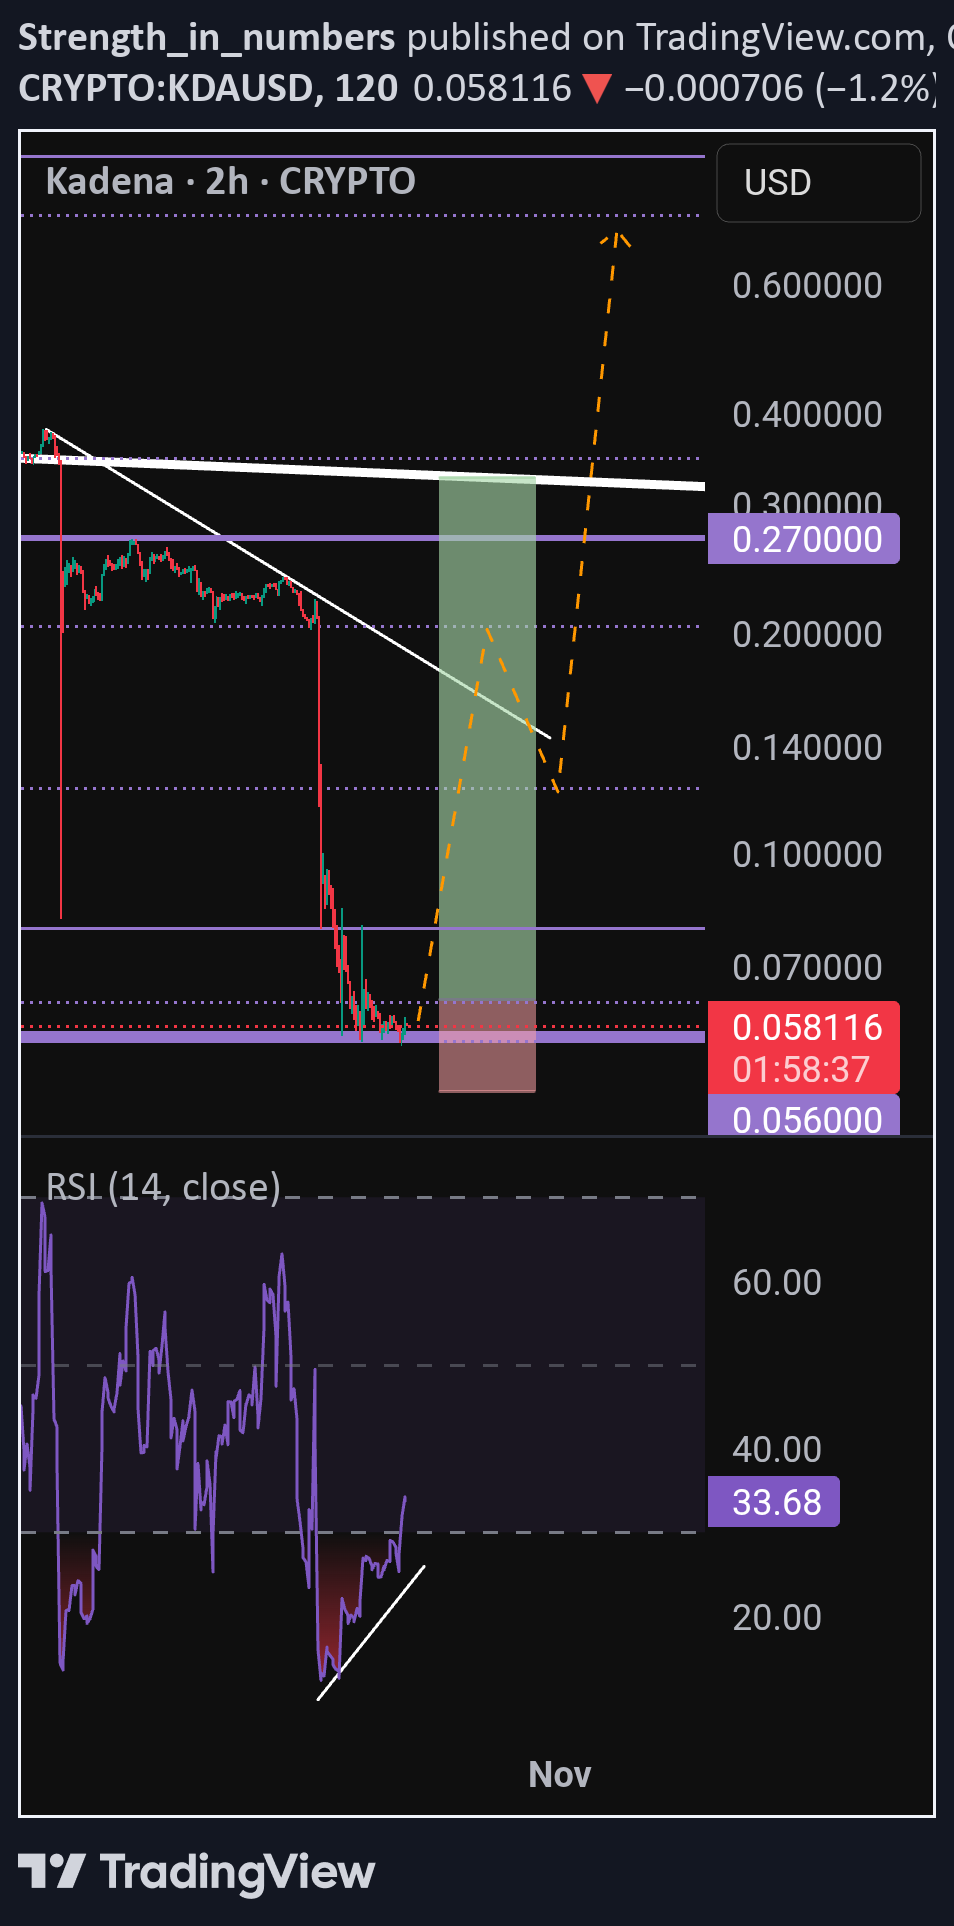
Kadena has recently ceased operations with some exchanges delisting KDA from their platform. HOWEVER from a technical standpoint we are seeing a bottom 0.05 - 0.06: this is a new ATL for KDA. The RSI is oversold on every time frame including the daily and weekly TF. Seeing increased strength on the 2H. Putting news events to one side, the technicals suggest that a long position could be favourable here. Breaks below 0.05 would invalidate this thesis.
Strength_in_numbers
بیت کوین به کجا میرود؟ راز رسیدن به ۱۴۴ هزار دلار و هدف نهایی ۲۴۰ هزار!

What would a bullish setup on Bitcoin currently look like: A re-test of the 102-103K price range. Breakout of downtrend(s) Bullish divergence An entry between 101k and 105k would make sense. A huge amount of liquidity was grabbed in last Fridays "crash" - around $10B in liquidations. Everyone is scared now. All the youtubers are saying that price is just going to keep going down. Fear and Greed index currently in the "fear" zone. Immediate price target @ 144k But I believe we will see a "blow off top" at the backend of Q4 of around 240k.
Strength_in_numbers
BTC - THE FINAL MOVE

Huge liquidity spot between 106.5K - 108.2K We are also approaching the end of the weekly/monthly candle. Currently we are in a downtrend however seeing signs in the RSI that a move up is on the horizon (bullish div.) Based on historical halving events Bitcoin achieved a new ATH in Nov or Dec of 2013, 2017 and 2021 Put all this information together. I think that the whales are going to grab the liquidity Zone as we move into October and the next 3 months are going to mega bullish for the crypto market. Anything over the 124.5K mark would cement a parabolic run to the upside ending at the back end of Q4 2025.
Strength_in_numbers
BTC - one last liquidity grab before moving up??
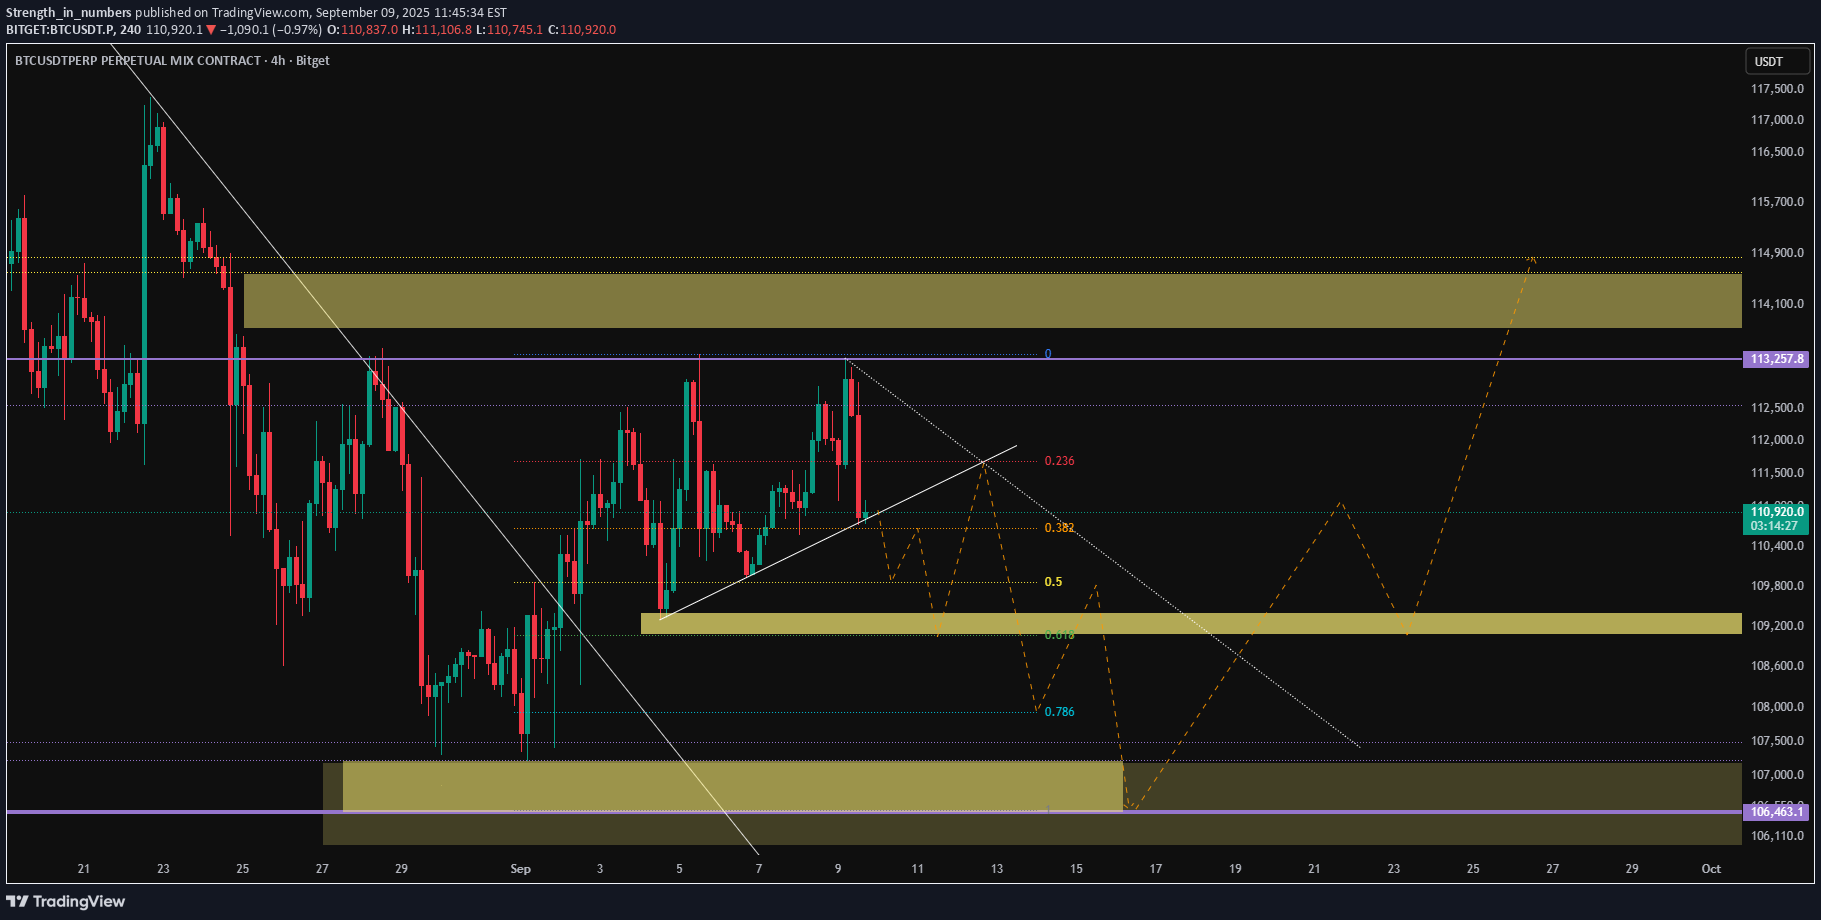
The yellow boxes represent a liquidity rich zone. BTC is start to break the White uptrend BTC is also failing to break above the 113K level (3 touches suggests that whales are creating liquidity in the market) I think that BTC will drive down aggressively towards the back-end of the week to grab the liquidity @ 106,500 Orange dashed lines are a projected flightpath Fib levels are assumptive of the 106,500 being achieved and not actual. I think that this this will be the final move down for BTC, before moving up for a short squeeze @ 113K and ending the year in a parabolic run.
Strength_in_numbers
BTC - breadcrumbs

Observing bullish div. (Double divergence) Huge liquidity Zone 106,400 - 107,100 sat below. Appears that BTC is reacting to the fibs. Currently bouncing off 618 Prediction: I think that BTC is leaving the lower liq zone as a snack for later. Rally into the week +3%. However think we will run into resistance @ 110K which is the weekly high x 3 / low x 1, the 0.5 fib, a liquidity zone and would touch a macro uptrend. Then start to move down to grab said liquidity but ultimately moving down to 786 @ 103K mid-september. Think this will act as a long squeeze for traders expecting new ATHs. Then parabolic rally into late Q4.
Strength_in_numbers
BTC - kaput?

Bearish div. on the Weekly RSI in play (triple divergence). Bitcoin appears to react to the 69 on the RSI. Observe p.a. Nov 2021- huge correction to the downside. Also there is a break in the uptrend (which looks out of kilter on the Weekly - but makes sense on the Daily) Where do I think price is going to next? 95K. Ethereum also tested the ATH and got rejected as Well as starting to break an uptrend. XRP and SOL still operating below ATHs. Imo the market looks bearish for the immediate future until proven otherwise. Could see sharp move down moving into September (-11% BTC, ETH to 3K) followed by a rally into year-end.
Strength_in_numbers
BTC - kaput?

Bearish div. on the Weekly RSI in play (triple divergence). Bitcoin appears to react to the 69 on the RSI. Observe p.a. Nov 2021 - huge correction to the downside. Also there is a break in the uptrend (which looks out of kilter on the Weekly tf but makes sense on the Daily) Where do I think price is going to next? 95K. Dont ask me where that target came from. Ok it came to me in a dream 😴 Ethereum also tested the ATH and got rejected as well as starting to break an uptrend. XRP and SOL still operating below ATHs. Imo the market looks bearish for the immediate future until proven otherwise. Could see a sharp move down moving into September (-11% BTC, ETH to 3K) followed by a rally into year-end.
Strength_in_numbers
ETH - possible correction?

Bearish div. on the daily TF Observing an uptrend which has been in play since June. If this is broken a correction could be the next move for Ethereum. We've also recently tested the ATH. History has taught us that once price tests the ATH and move down is usually the next move to occur (e.g. SOL, XRP, BNB etc). A correction to 3K could make sense 📉 (0.618 fib) Else price break back above the ATH which would trigger a parabolic move to the upside. Keep your eye on the trendline 👀
Disclaimer
Any content and materials included in Sahmeto's website and official communication channels are a compilation of personal opinions and analyses and are not binding. They do not constitute any recommendation for buying, selling, entering or exiting the stock market and cryptocurrency market. Also, all news and analyses included in the website and channels are merely republished information from official and unofficial domestic and foreign sources, and it is obvious that users of the said content are responsible for following up and ensuring the authenticity and accuracy of the materials. Therefore, while disclaiming responsibility, it is declared that the responsibility for any decision-making, action, and potential profit and loss in the capital market and cryptocurrency market lies with the trader.