
Strangely-accurate
@t_Strangely-accurate

What symbols does the trader recommend buying?
Purchase History
پیام های تریدر
Filter
Strangely-accurate
تسلا و بیت کوین: آیا الگوی تکرارشونده جدیدی در بازار مالی کشف شده است؟
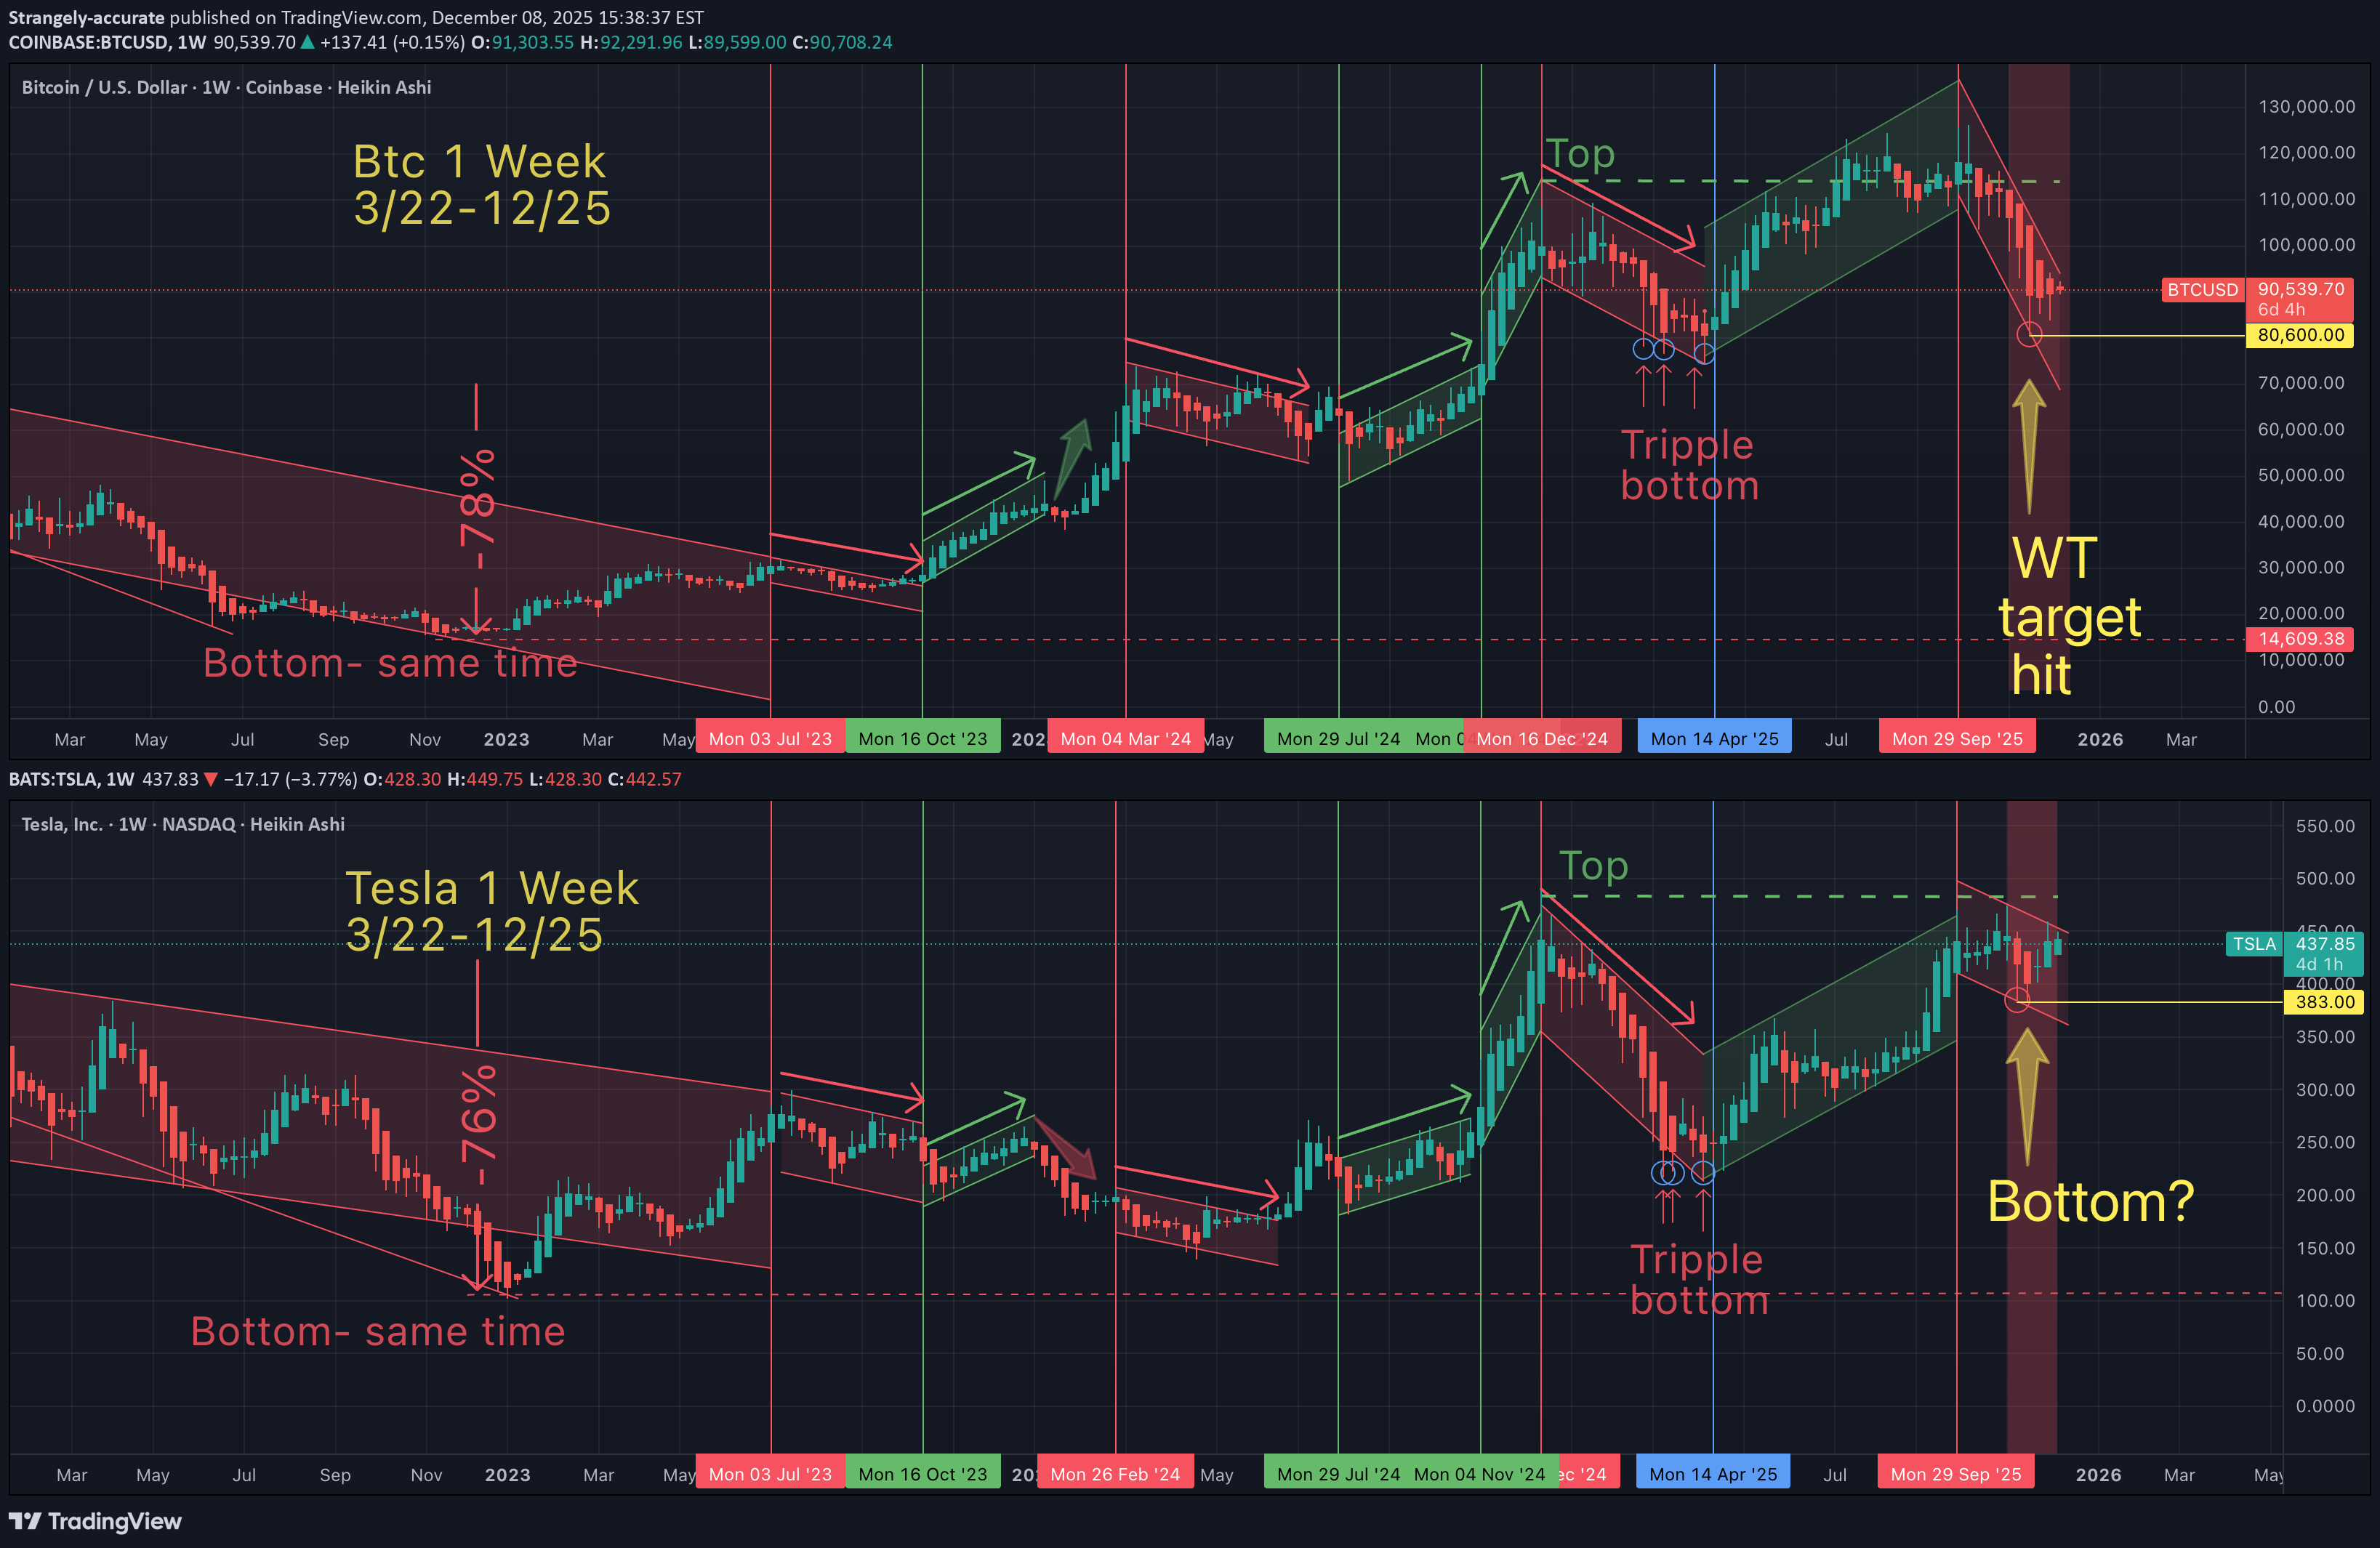
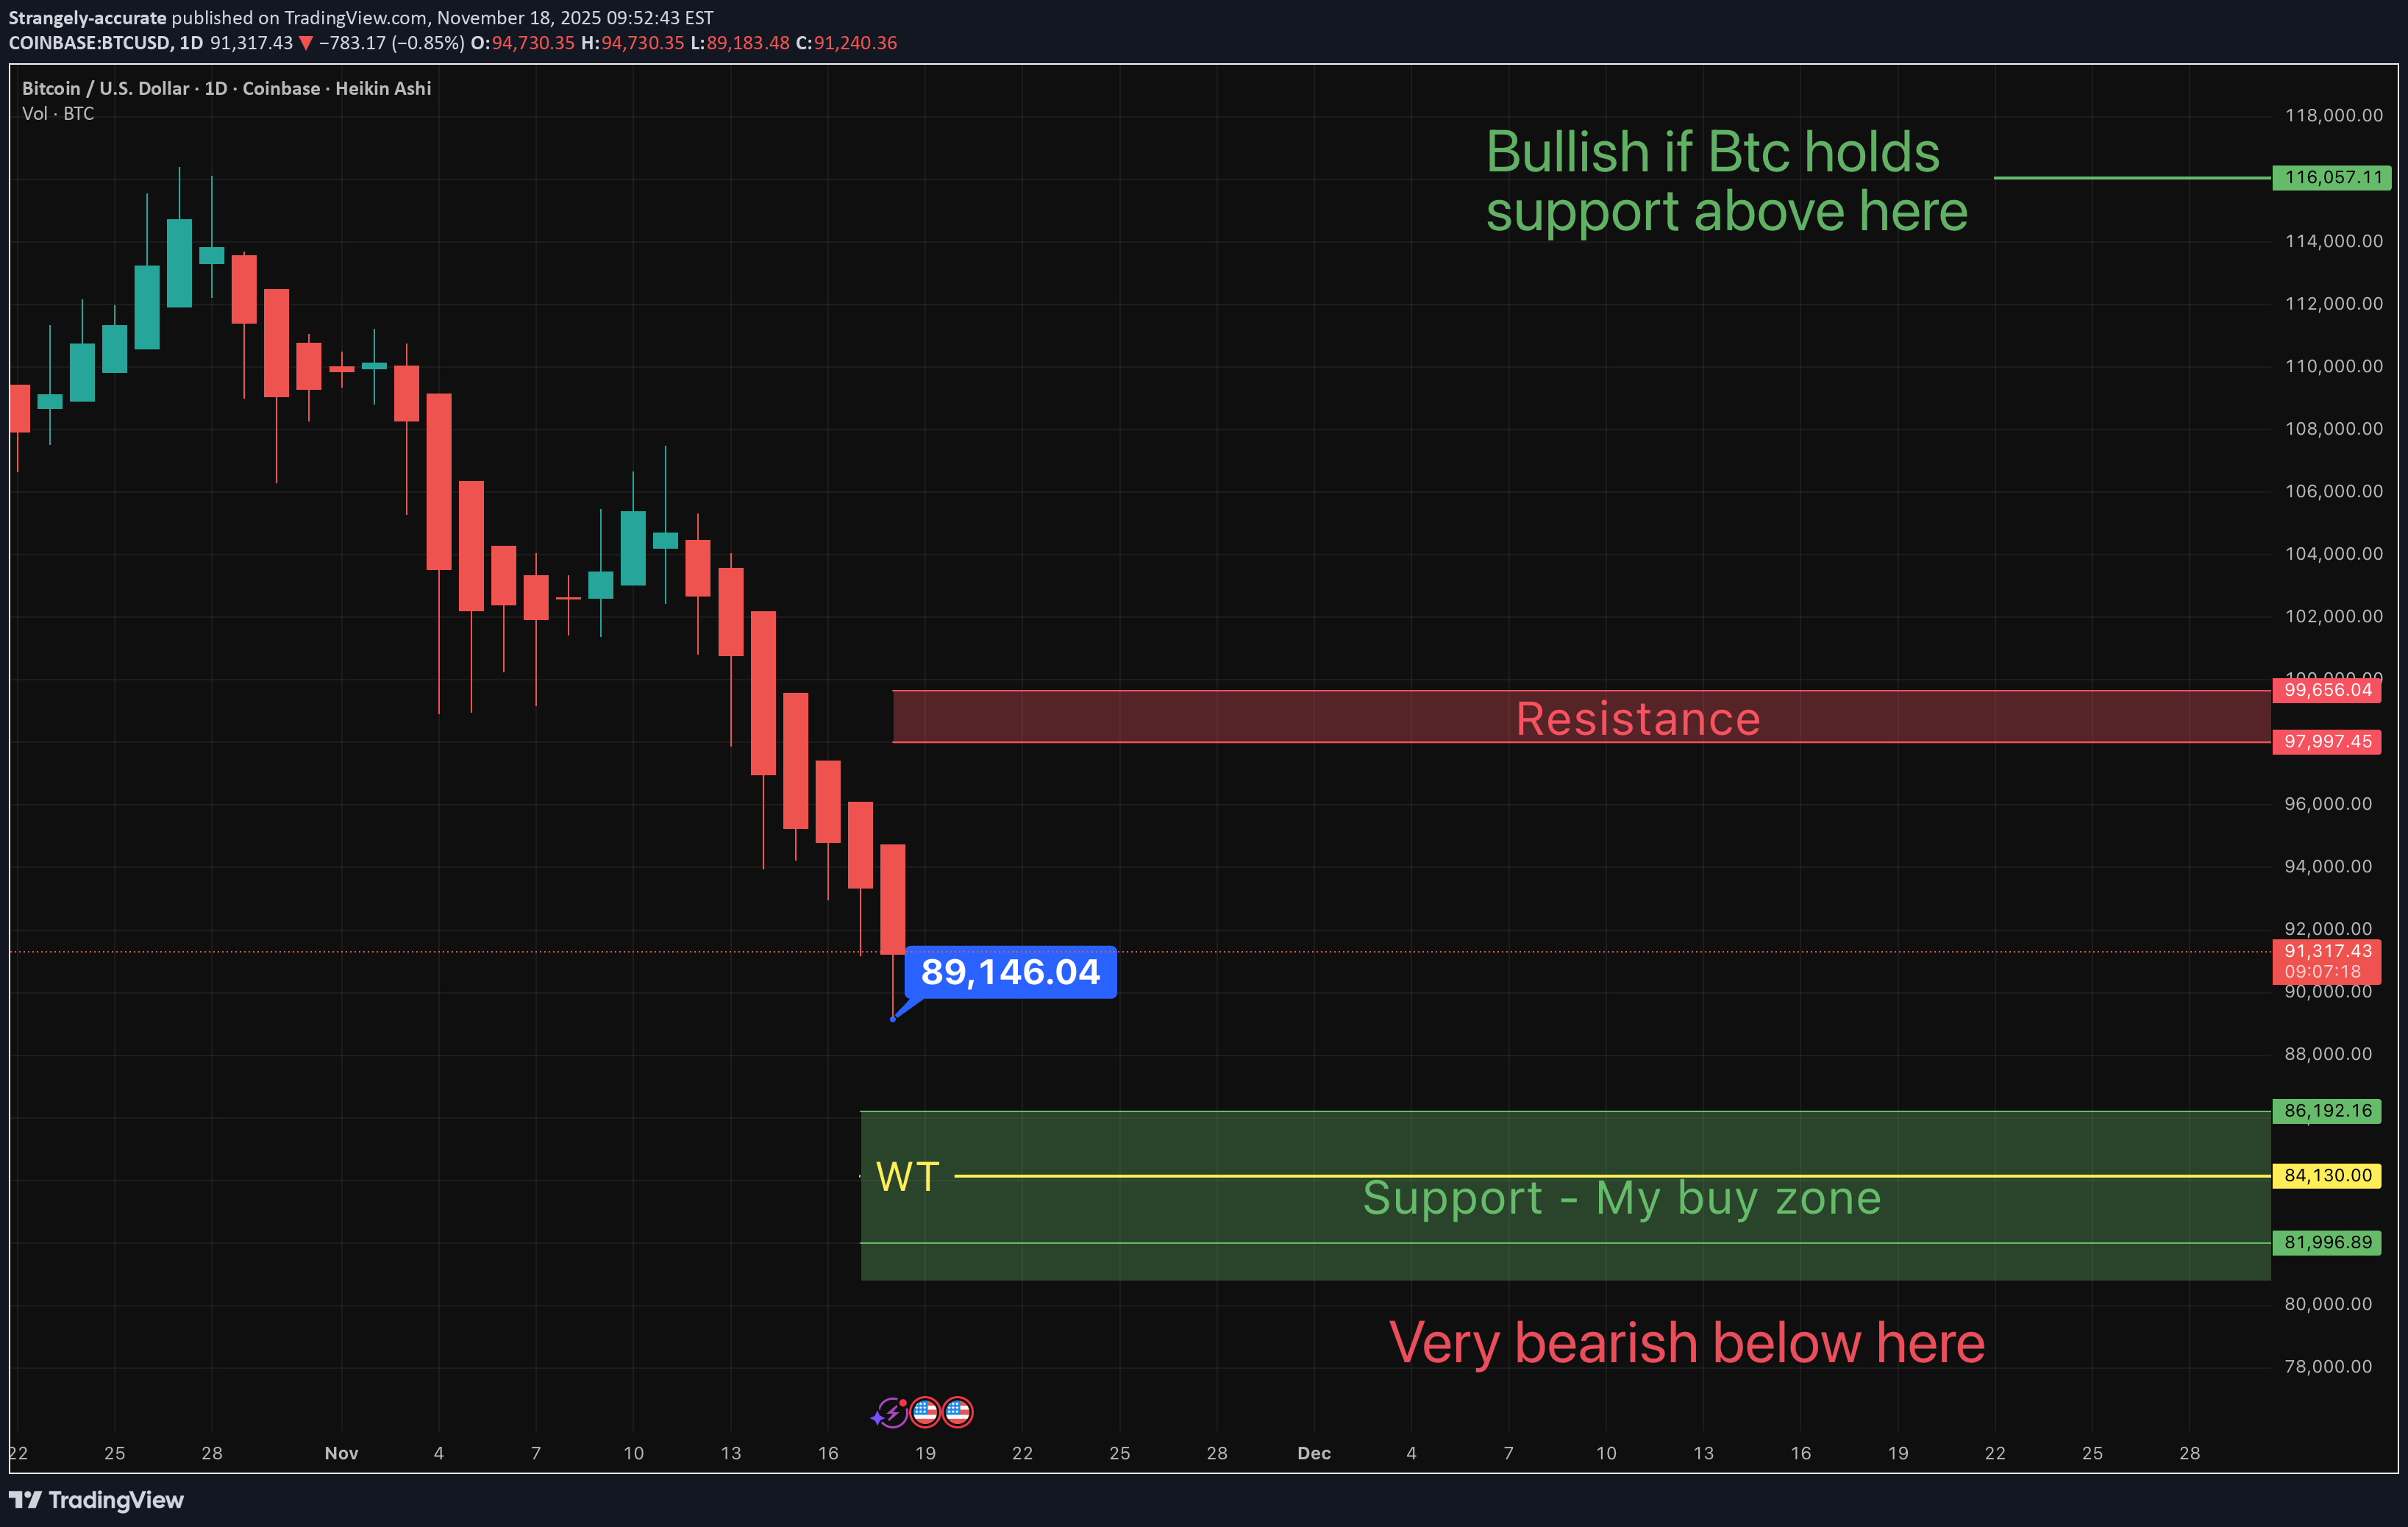
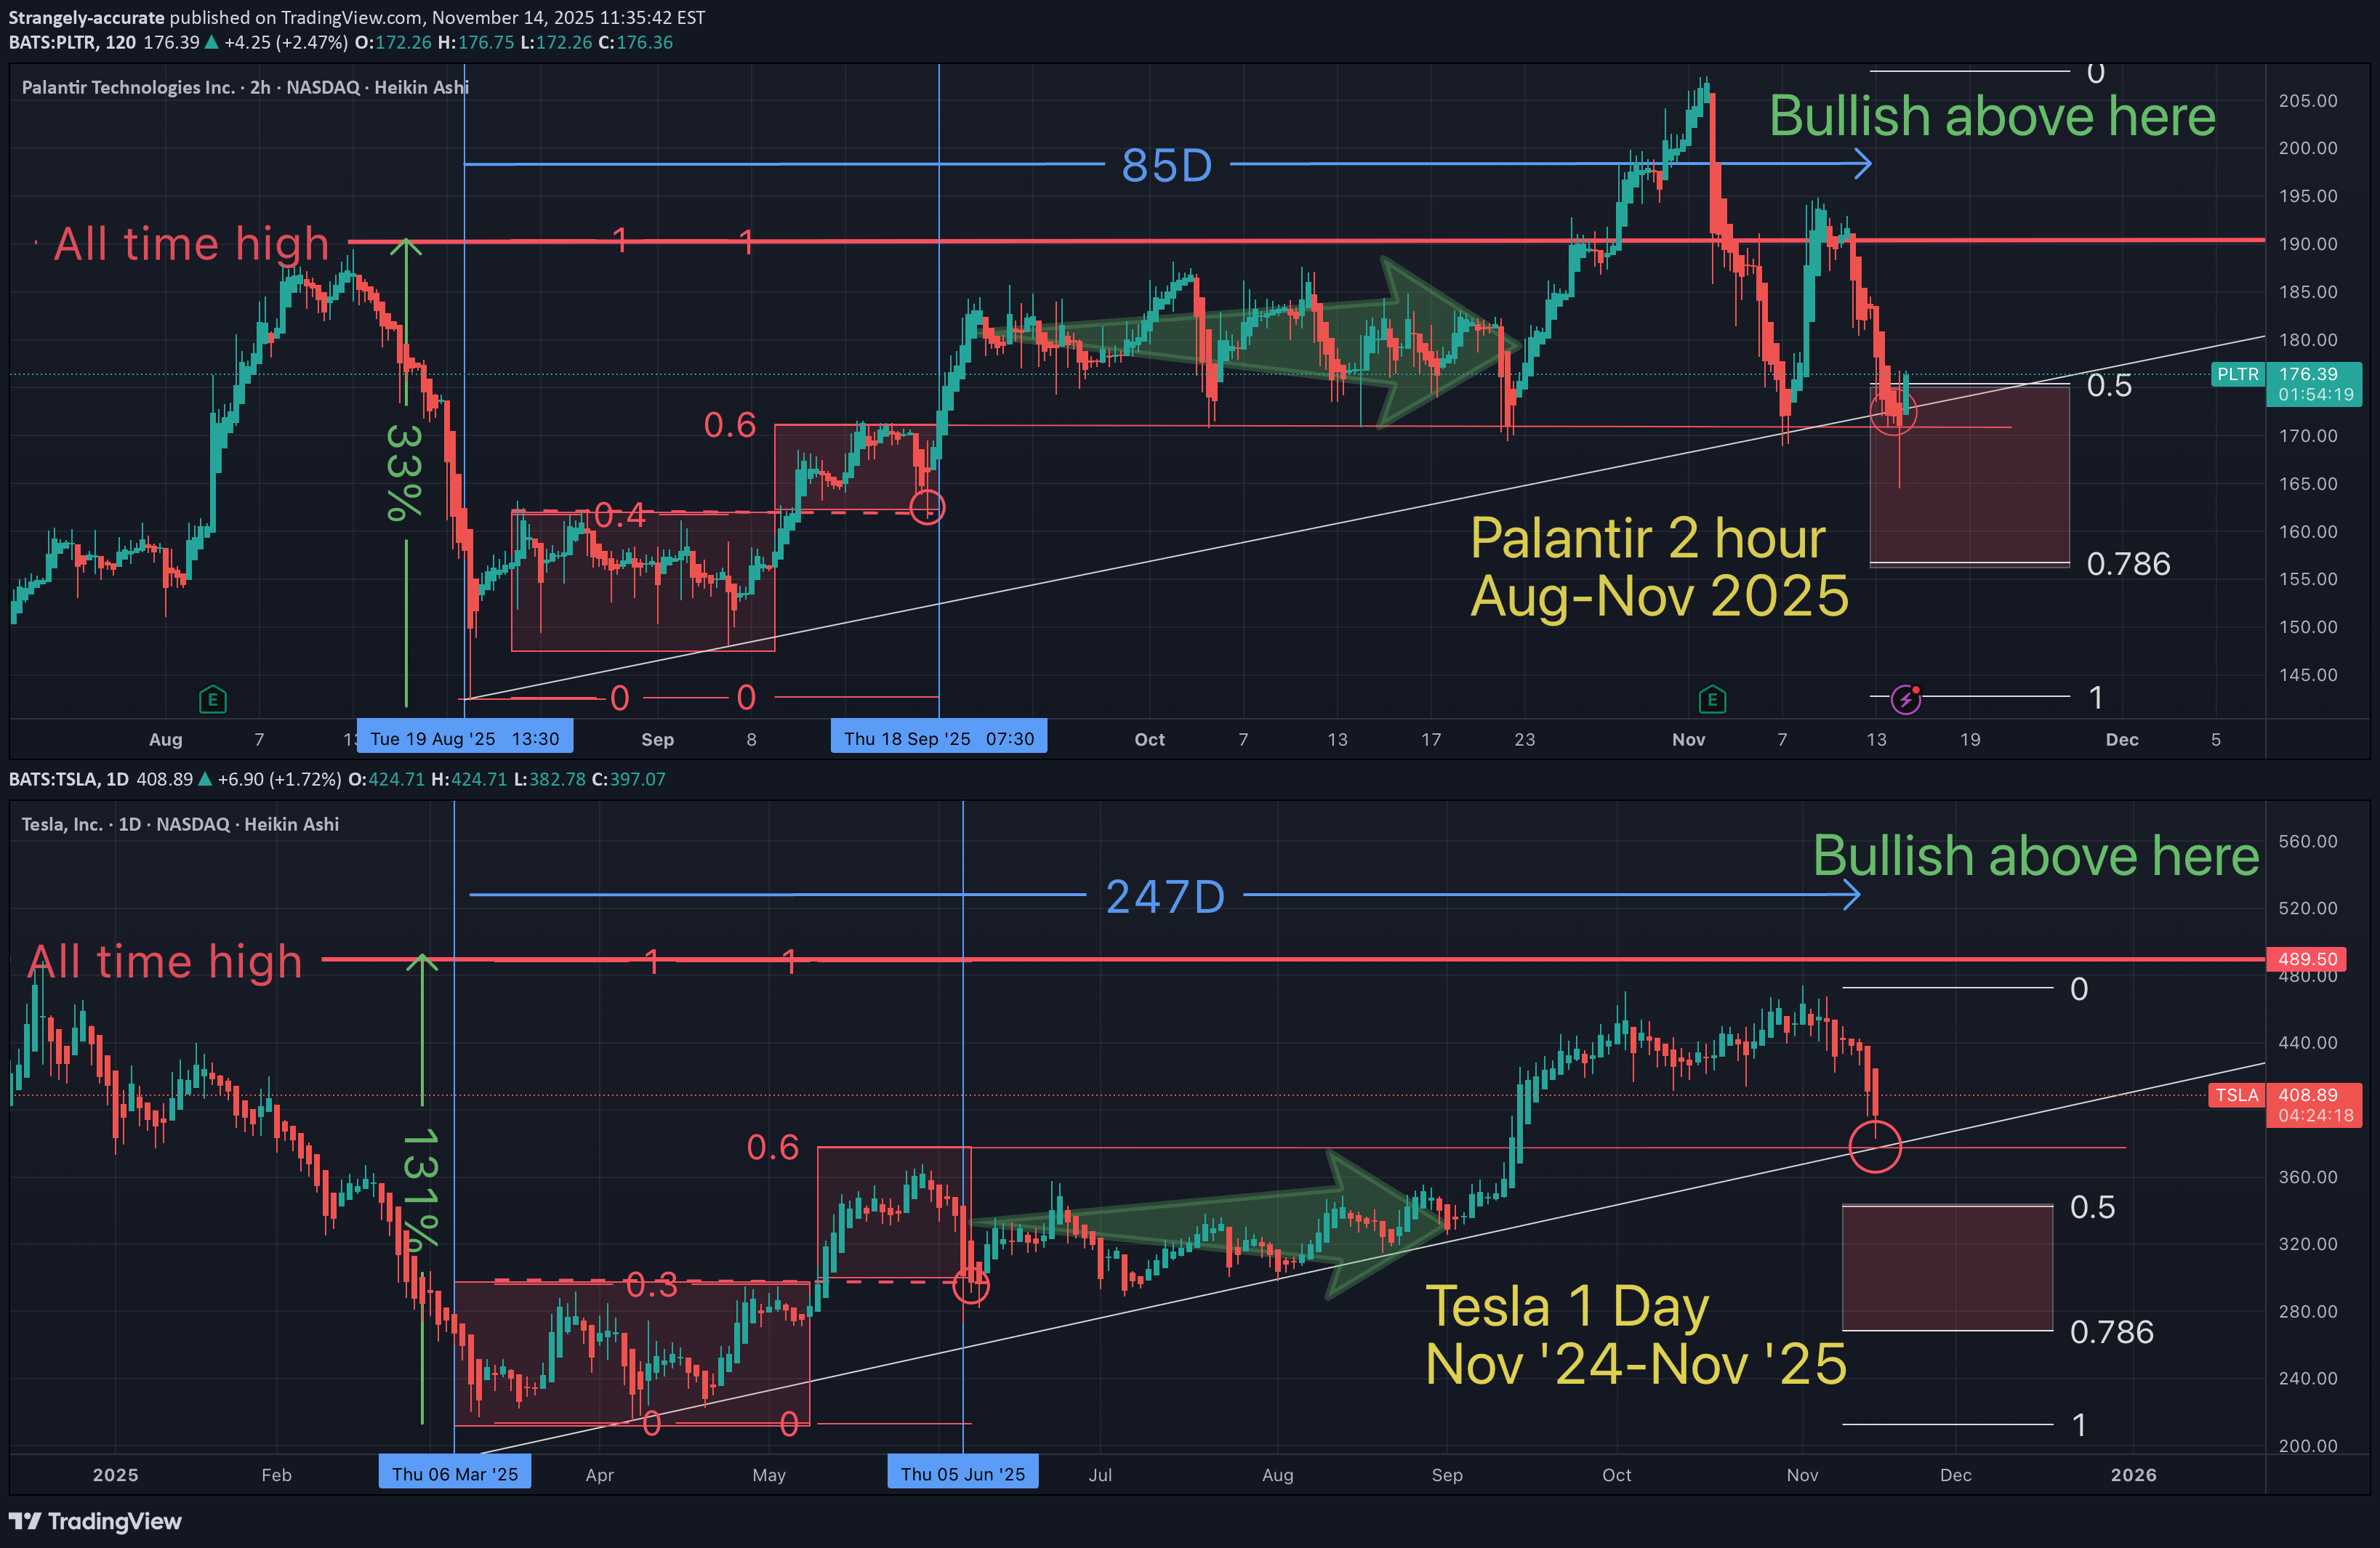
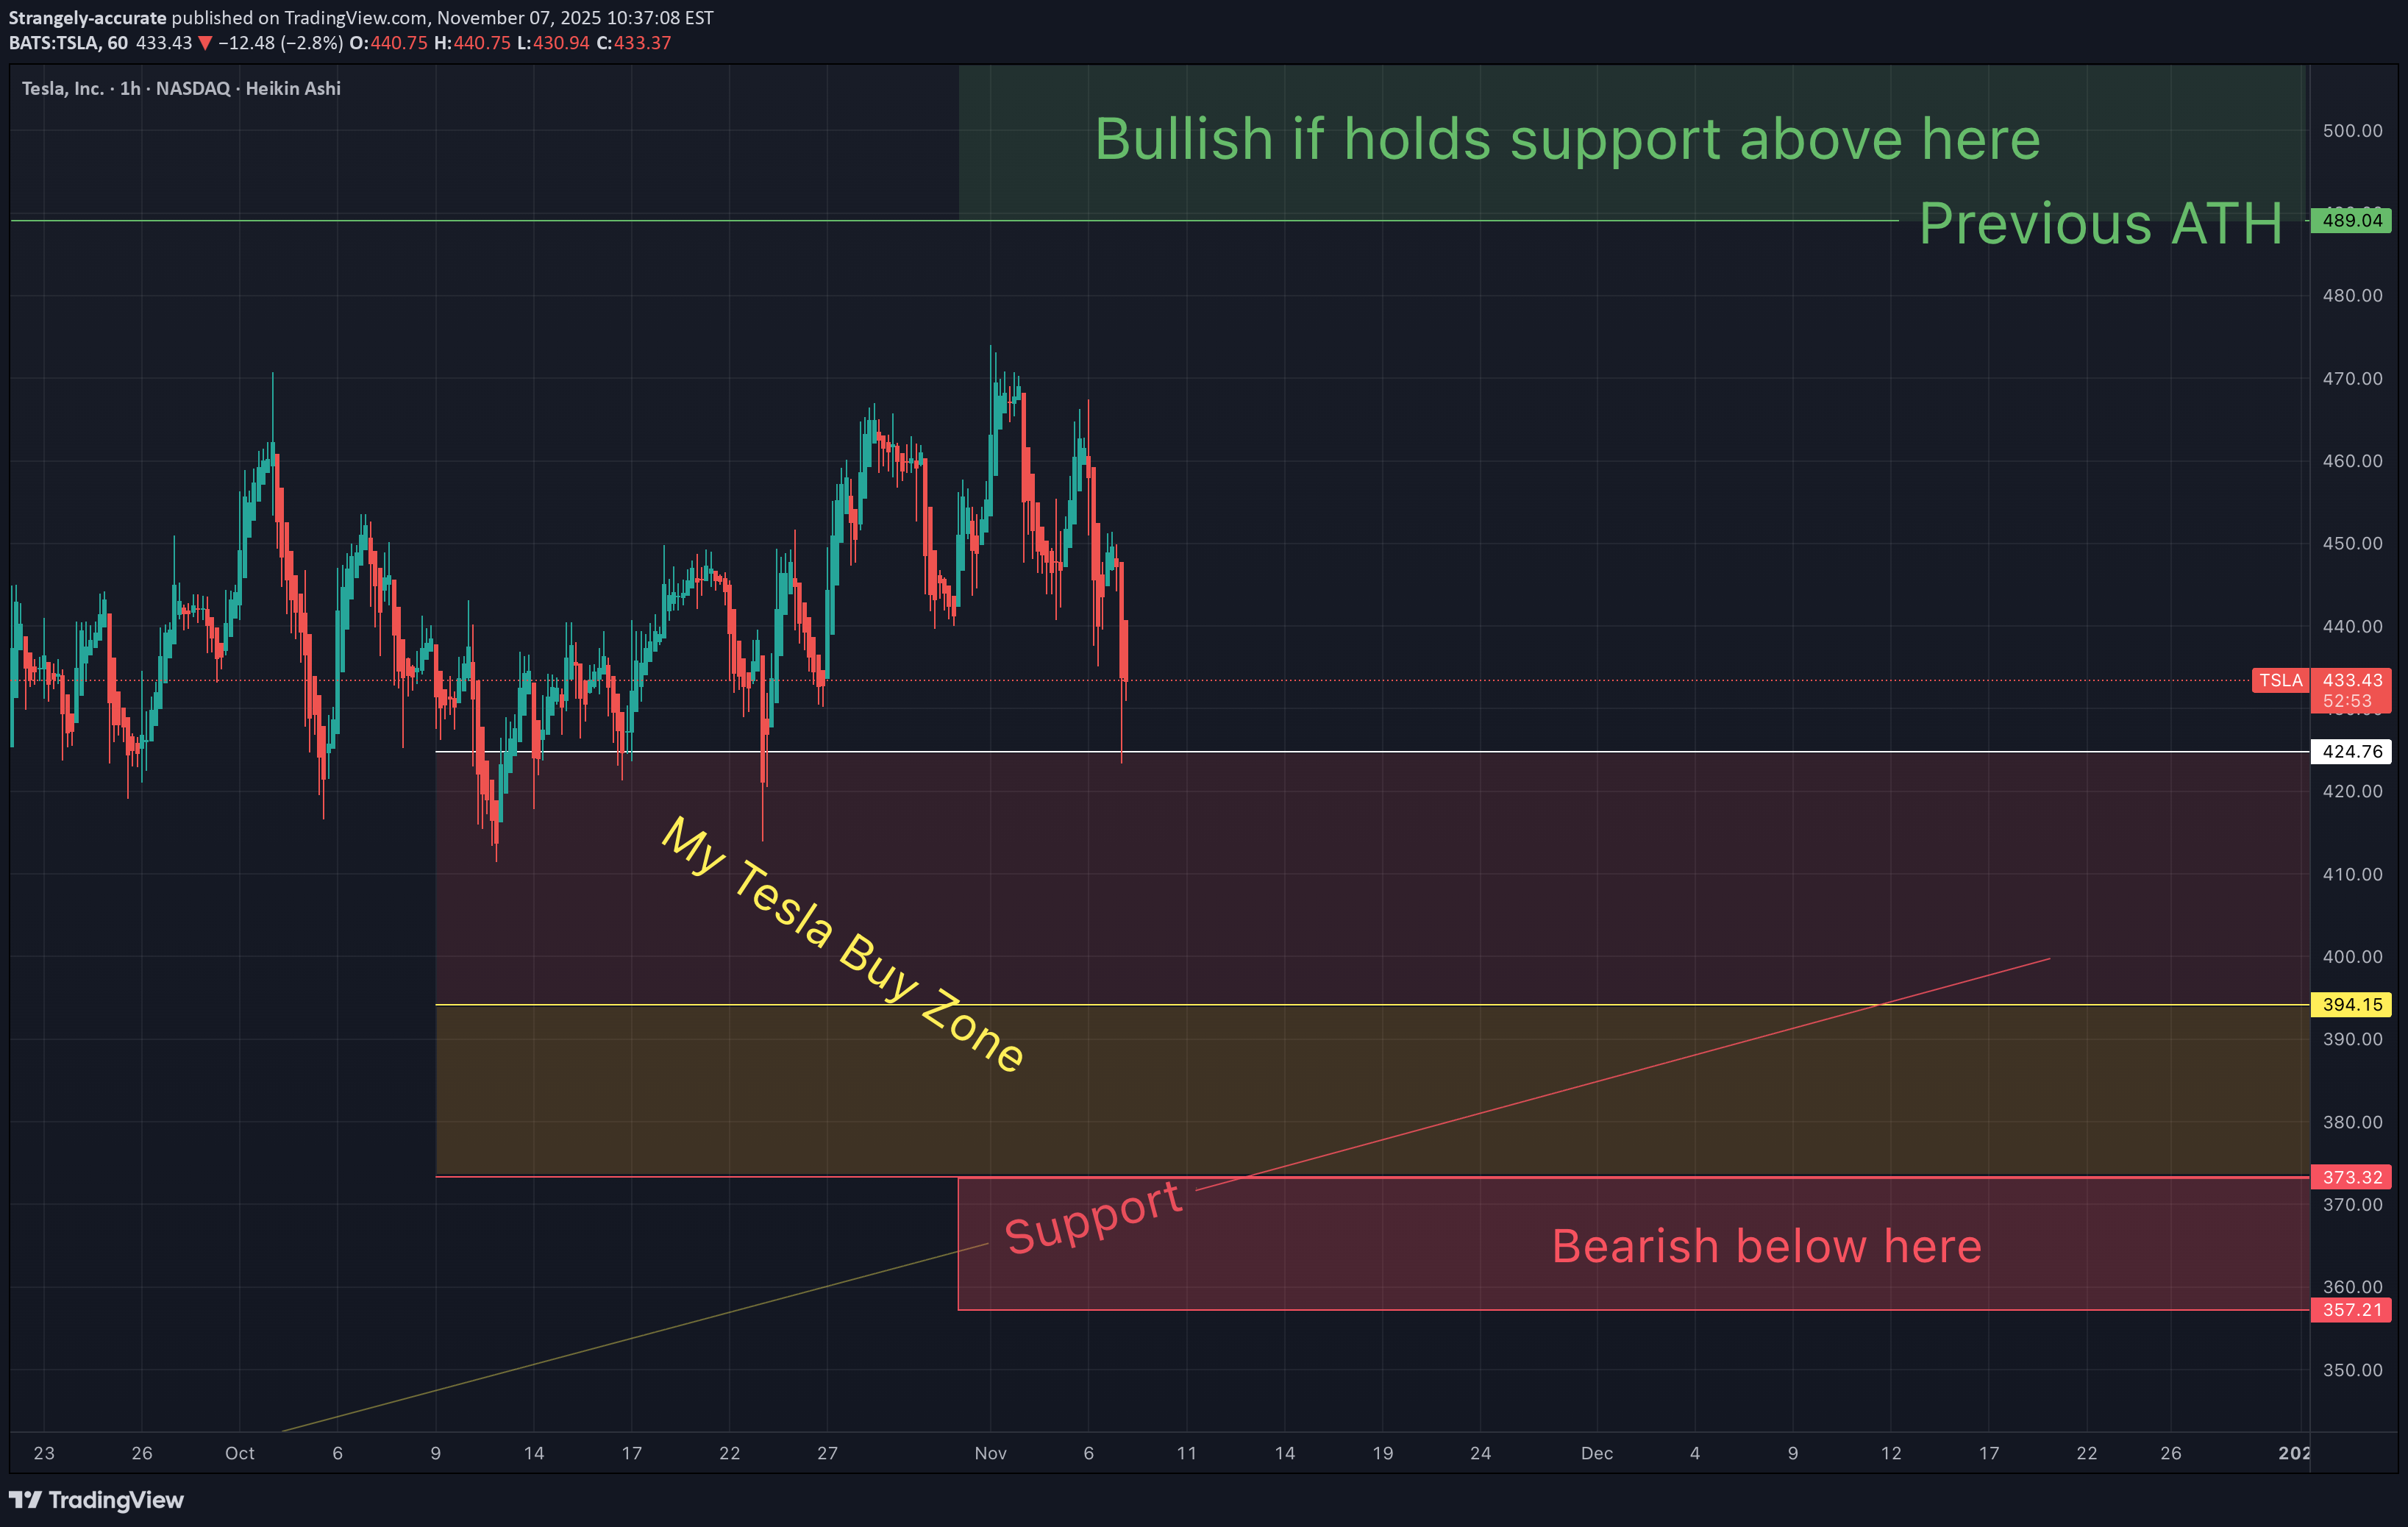
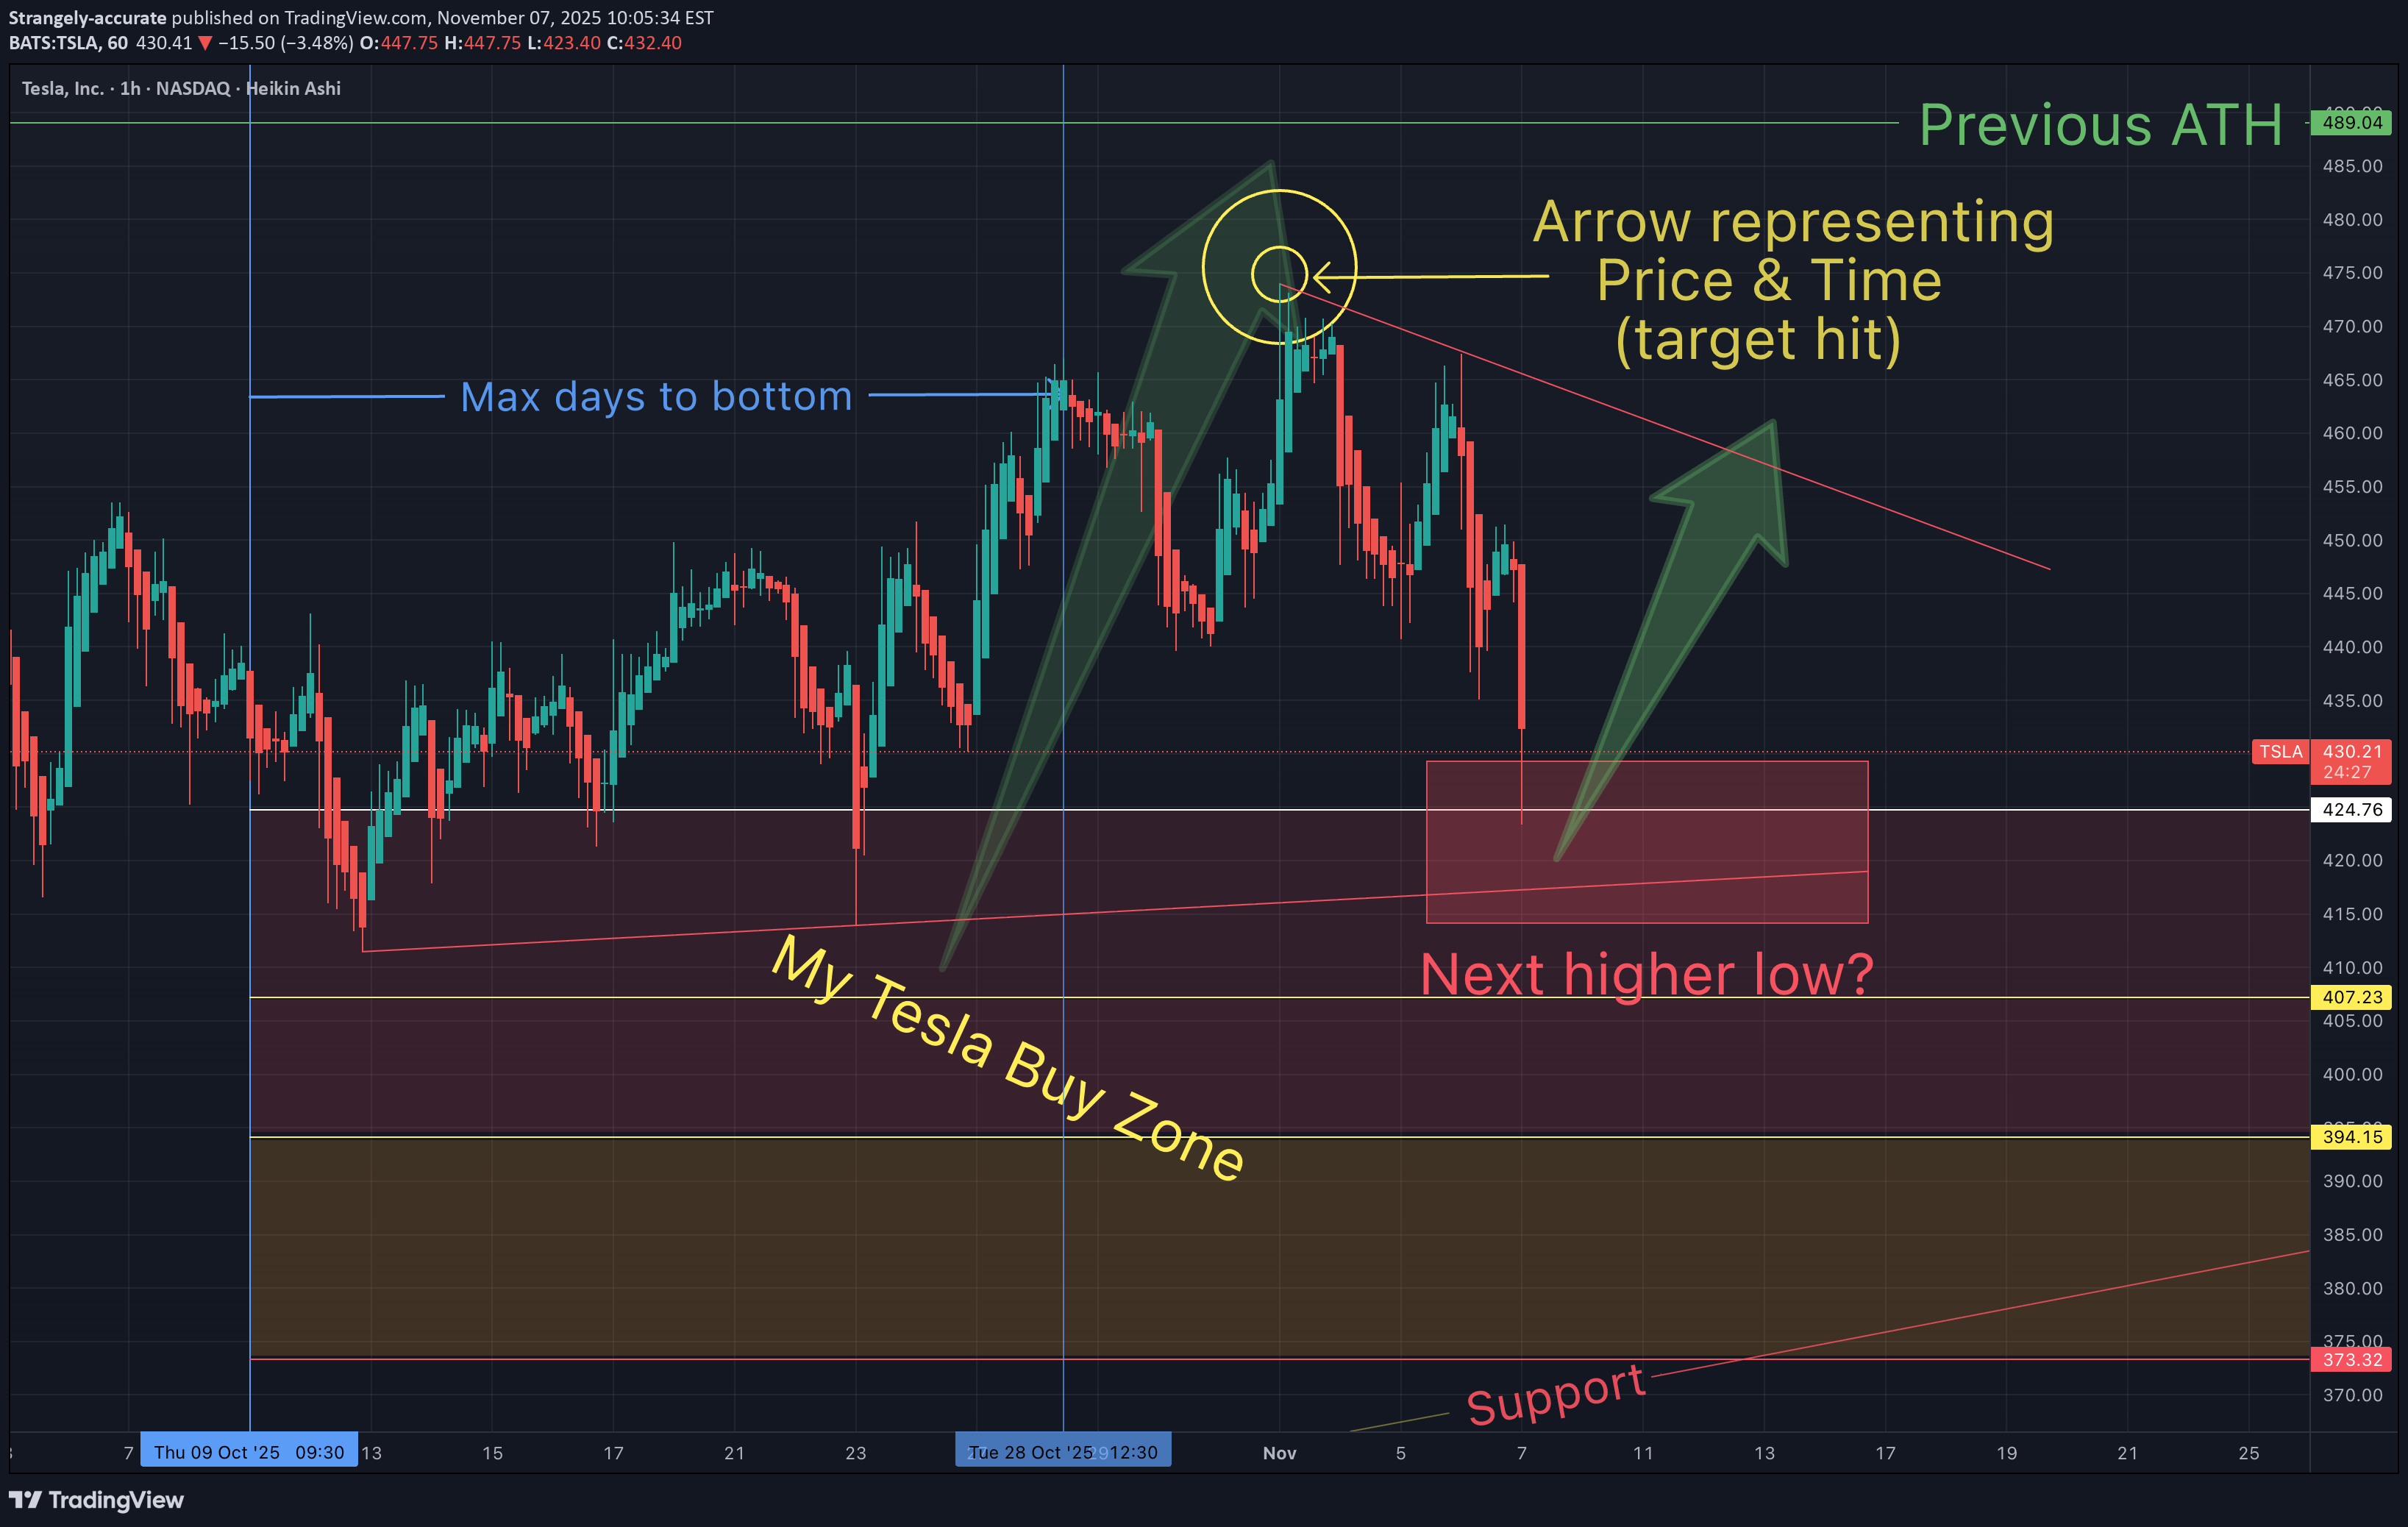
What does it mean that 2 completely unrelarted assets are moving simultaneously? Several of you have asked me how we can capitalize on fractals. So after 50 days of tracking Tesla vs palantir, we learned how one asset can be a leading indicator for the other (pls refer to previous charts). That pattern was identical for over 2 months, except that fractal suggested that Tesla would also break to new all time highs. That hasn't happened yet, but I believe today's Btc vs Telsa chart (above) confirms last week's low as the anticipated Btc bottom ($80K-$84K). This Btc bottom confirmation (of a highly correlated assest), adds further conflunce to my ongoing Tesla buy zone charts that have called for a max bottom of $373. Note: So far Tesla's retrace came within 2% of that target on Nov 14. Today, Tesla is up 16% from that target low. So is this further confluence that Tesla has reached it's bottom? But back to the original question. If these charts are graphs, with "coordinates" x and Y...and linear equations seem to govern how "price action respects trandlines"...then can any of you math nerds out there explain how price action follows strangley predictable trendlines. More importantly, please explain how two completely indepent assests can have this same trendline phenomenom simulateneously...for months ("a fractal")? May the (universal mathematical) truth be with you. Cue in song: "Wake Up" - By Rage Against The MachineThis is the previously mentioned Btc "WT" target
Strangely-accurate
چگونه سقوط بیت کوین تا 80 هزار دلار را پیشبینی کردم؟ راز تحلیل تکنیکال دقیق!
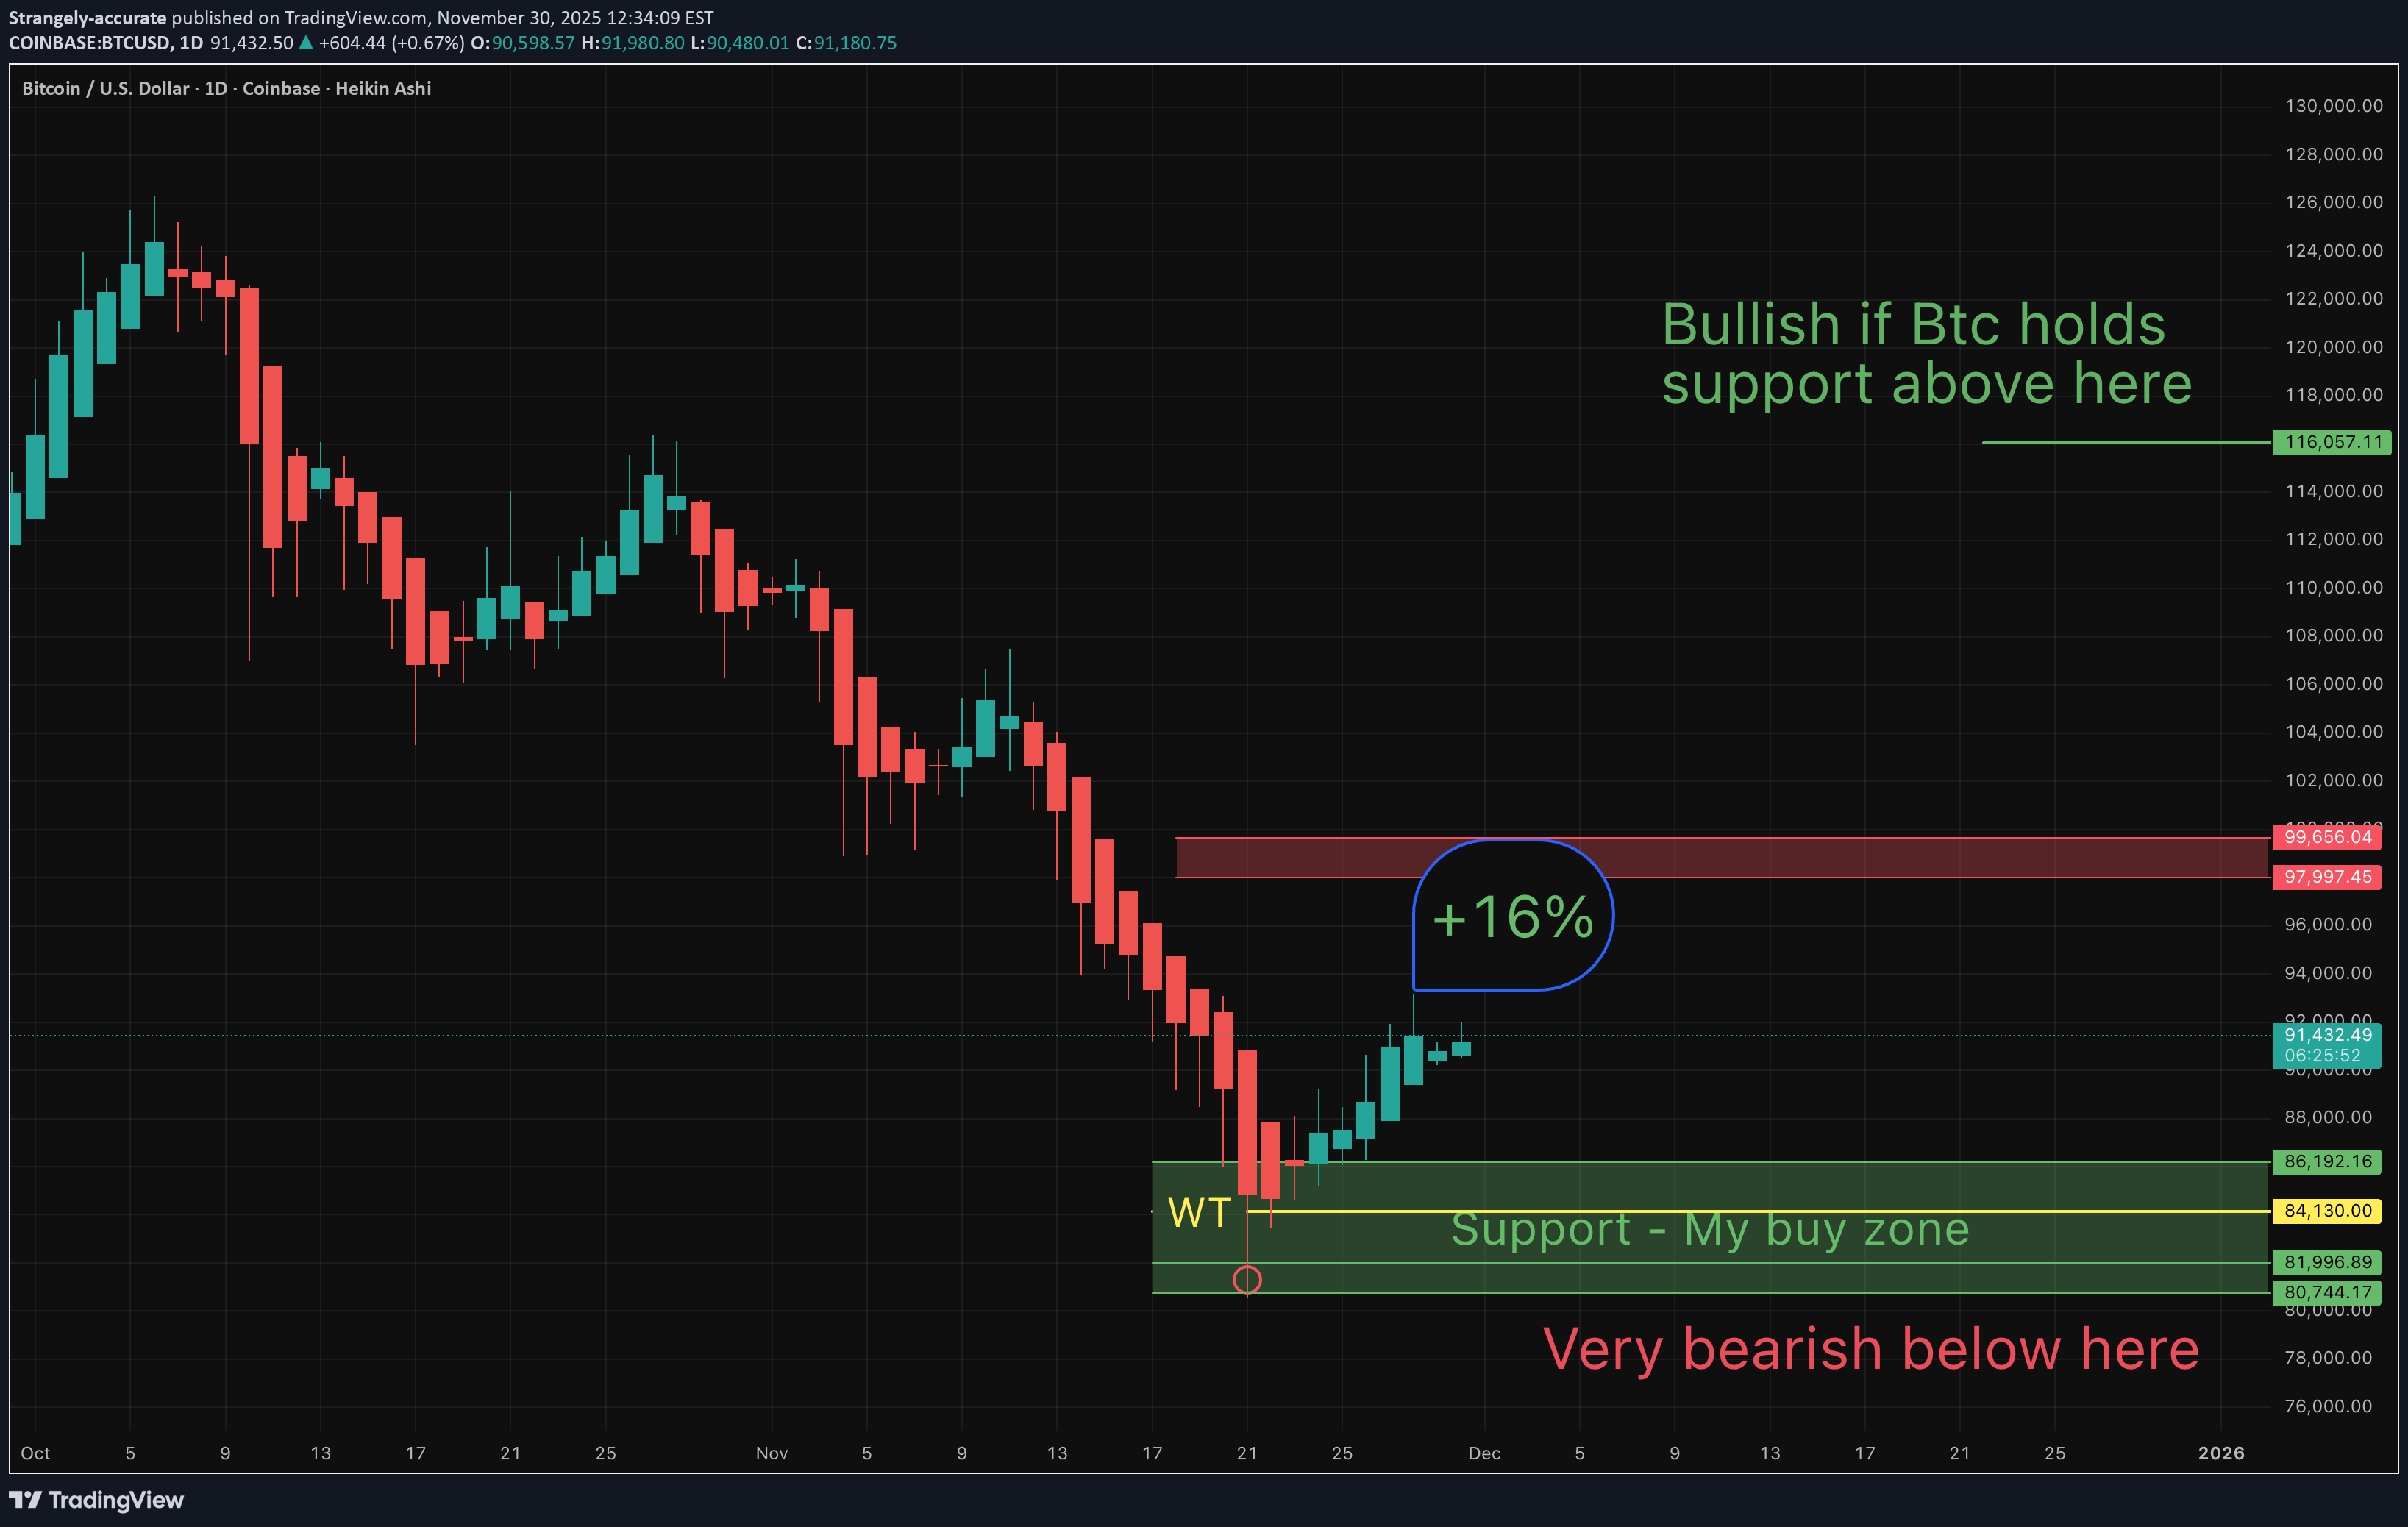
Followers of my charts know that "strangely accurate" calls have been made throughout Btc's recent 3 months worth of price action. I anticipated the previous low at $107K and since September I have repeatedly expressed concerns about a dump to a lower low (see Sept-Oct Btc charts). In September, the "3 Red Week Down Rule" warned us that this lower low was coming (T1). Once 107K was broken, I cautioned that if the next level down didn't hold (96K-103K), that Btc would go straight to 80K-85K. On Oct 23rd I wrote: "Btc bounce incoming off support? If not, and support is broken... long way down to 84K. Too soon for concern, but Btc is currently bottom feeding off my lowest support". I later offered confluence with a confirmed WT at 84K,200, which confirmed (for me), a big bounce from this 80K-ish zone. So far my bottom "ALL IN" zone held (T2- 80K-84K). Btc is currently 92K -up 16%, since bouncing off my buy zone. I don't point this out for my ego. This is confirmation to all the non-believers...TA works! Also, I keep my own win rate stats, as should everyone. I'm transparent about my trades and my win rates. How else would anyone know if they should follower an "influencer" if they don't have published charts (where you can keep track of their stats). Once again, congrats to all that have made gains while following my charts. "May the trends be with you"
Strangely-accurate
چگونه بیت کوین را تا کف قیمت ۸۴ هزار دلار پیشبینی کردم؟ (راز تحلیل دقیق)
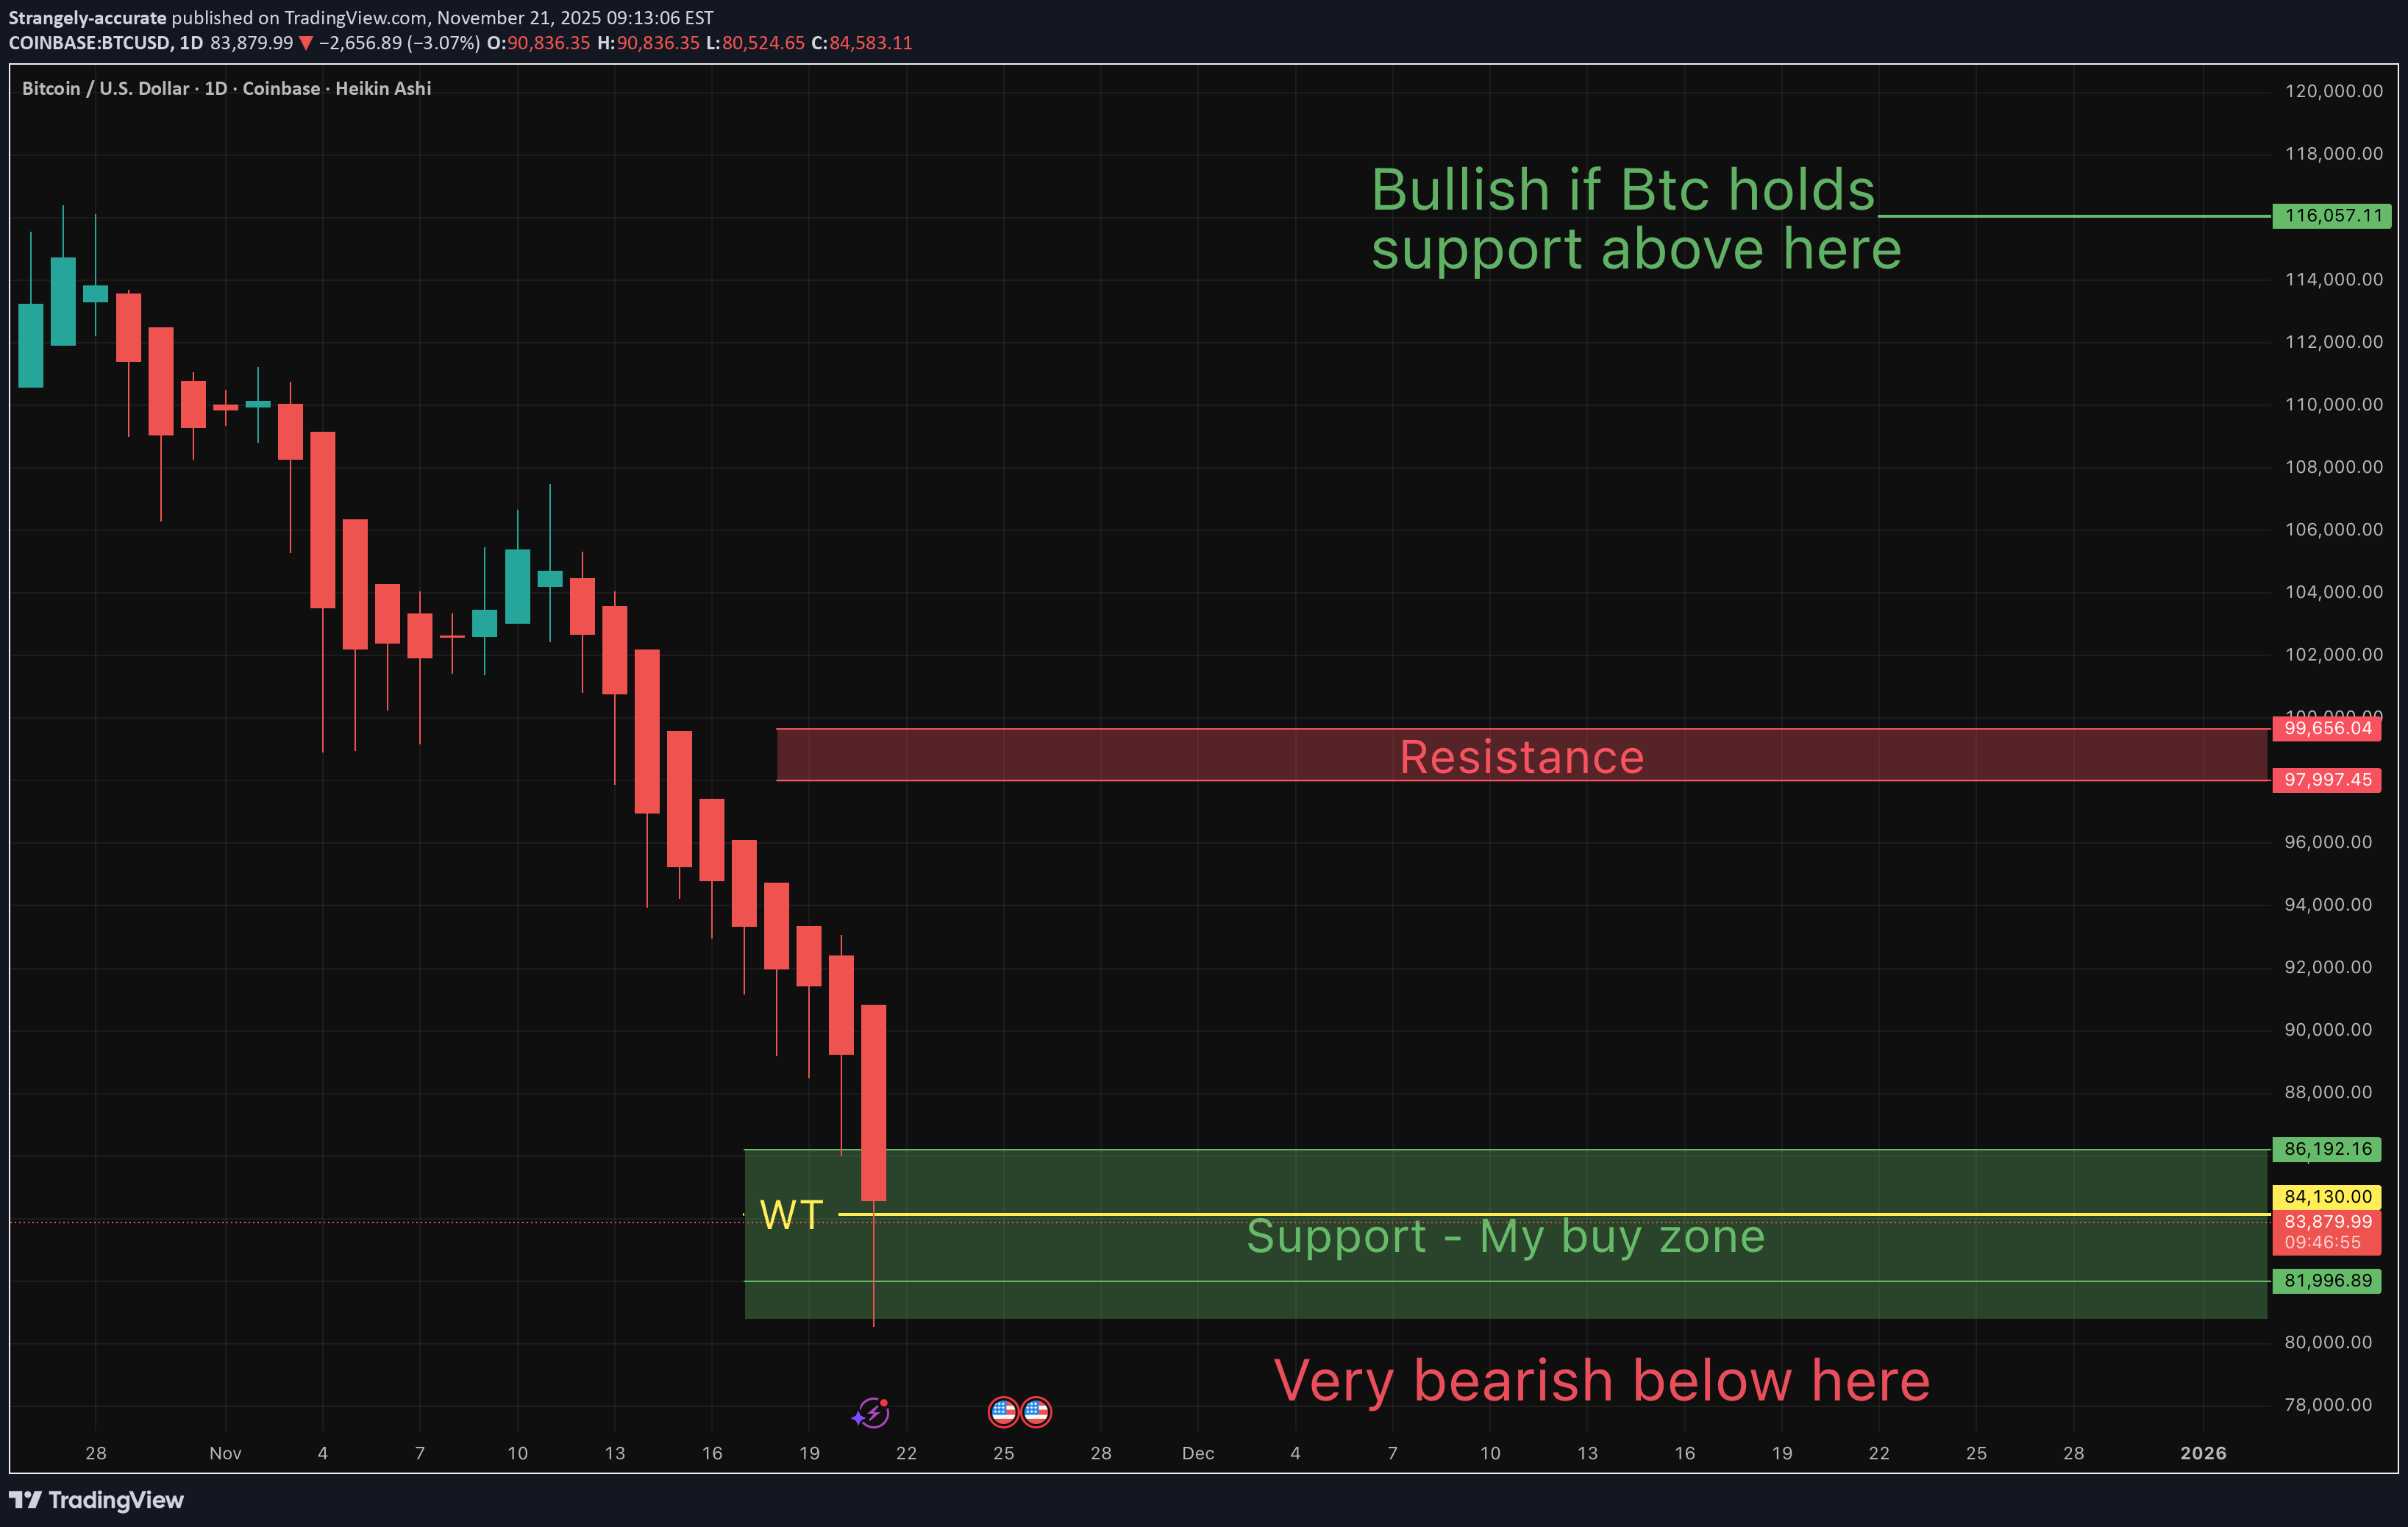
On Oct 23rd I wrote: "Btc bounce incoming off support? If not, and support is broken... long way down to 84K. Too soon for concern, but Btc is currently bottom feeding off my lowest support". Followers of my charts would know that "strangely accurate" calls have been made throughout Btc's recent months worth of price action. I anticipated the previous low (at $107K) and since September I have repeatedly expressed my concens about a dump to a lower low (see Sept-Oct Btc charts). The "3 Red Week Down Rule" warned us that this lower low was coming. I simultaneously, posted charts warning that the altcoin market will be subject to the this "3 Red Week Down Rule" 2 days ago I reminded my followers of my "All In" target at 84,200K (WT target). Today Btc has hit the WT ($84,200) as anticipated, and is resting in my buy zone (currently at $84K). You will ask yourself, "how did he know Btc would do that"? Congrats to those of you who have made significant gains...following along my journey. May the truth be with you!
Strangely-accurate
چگونه پیشبینی سقوط بیت کوین به ۸۴ هزار دلار ممکن شد؟ (راز تحلیلهای دقیق)

On Oct 23rd I wrote: "Btc bounce incoming off support? If not, and support is broken... long way down to 85K. Too soon for concern, but Btc is currently bottom feeding off my lowest support". "Followers of my charts would Know that "strangely accurate" calls have been made throughout Btc's recent months worth of price action. I anticipated the previous low (at $107K) and expressed my concens about a dump to a lower low. I don't knew how low and how long Btc stays in this lower range. What I do know is that the "3 Red Week Down Rule" warned us that this lower low was coming. So now is a way better time to concider this asset, than at the recent top, when everyone was overly bullish!" 2 days ago I reminded my followers of my "All In" target at 84,200K (WT target). Today Btc has hit the WT ($84,200) as anticipated, and is resting in my buy zone (currently at $84K). Congrats to those of you who followed along my journey. May the truth be with you!
Strangely-accurate
احتمال انفجار بیت کوین: سناریوهای بعدی پس از رسیدن به کف قیمت!
Just a Btc thought experiment. It's good to anticipate price action so you know if and when we need to invalidate our trading idea. Those that follow, may remember I sold all my crypto (at the top), when I was repeatedly saying the crypto market will soon have a lower low...because of the "3 Red Week Down Rule". Now that Btc hit the lower low, I believe Btc is in for a bounce soon. Maybe Btc bounces now, and then lower to $84K. Or maybe one last flash down to $84K now. Idk, my cystal ball is still in the shop. Either way, I believe Btc (and some alts) have or are the process of bottoming, and preparing for a bounce. Btw I have been waiting for this $84K Btc "WT" target for months. Going back into the market in this region is a good idea (with proper risk management). Although to be honest, I have shifted my attention to stocks in recent weeks as you may have noticed. Recent price action in the crypto market, should explain why I stopped following it. But now it's time to pay attention, that Btc's recent low was within 5% of my $84K target. May the trends be with you
Strangely-accurate
پیشبینی سقوط بیت کوین: هدف بعدی 84 هزار دلار و جهش بزرگ به 99 هزار دلار!
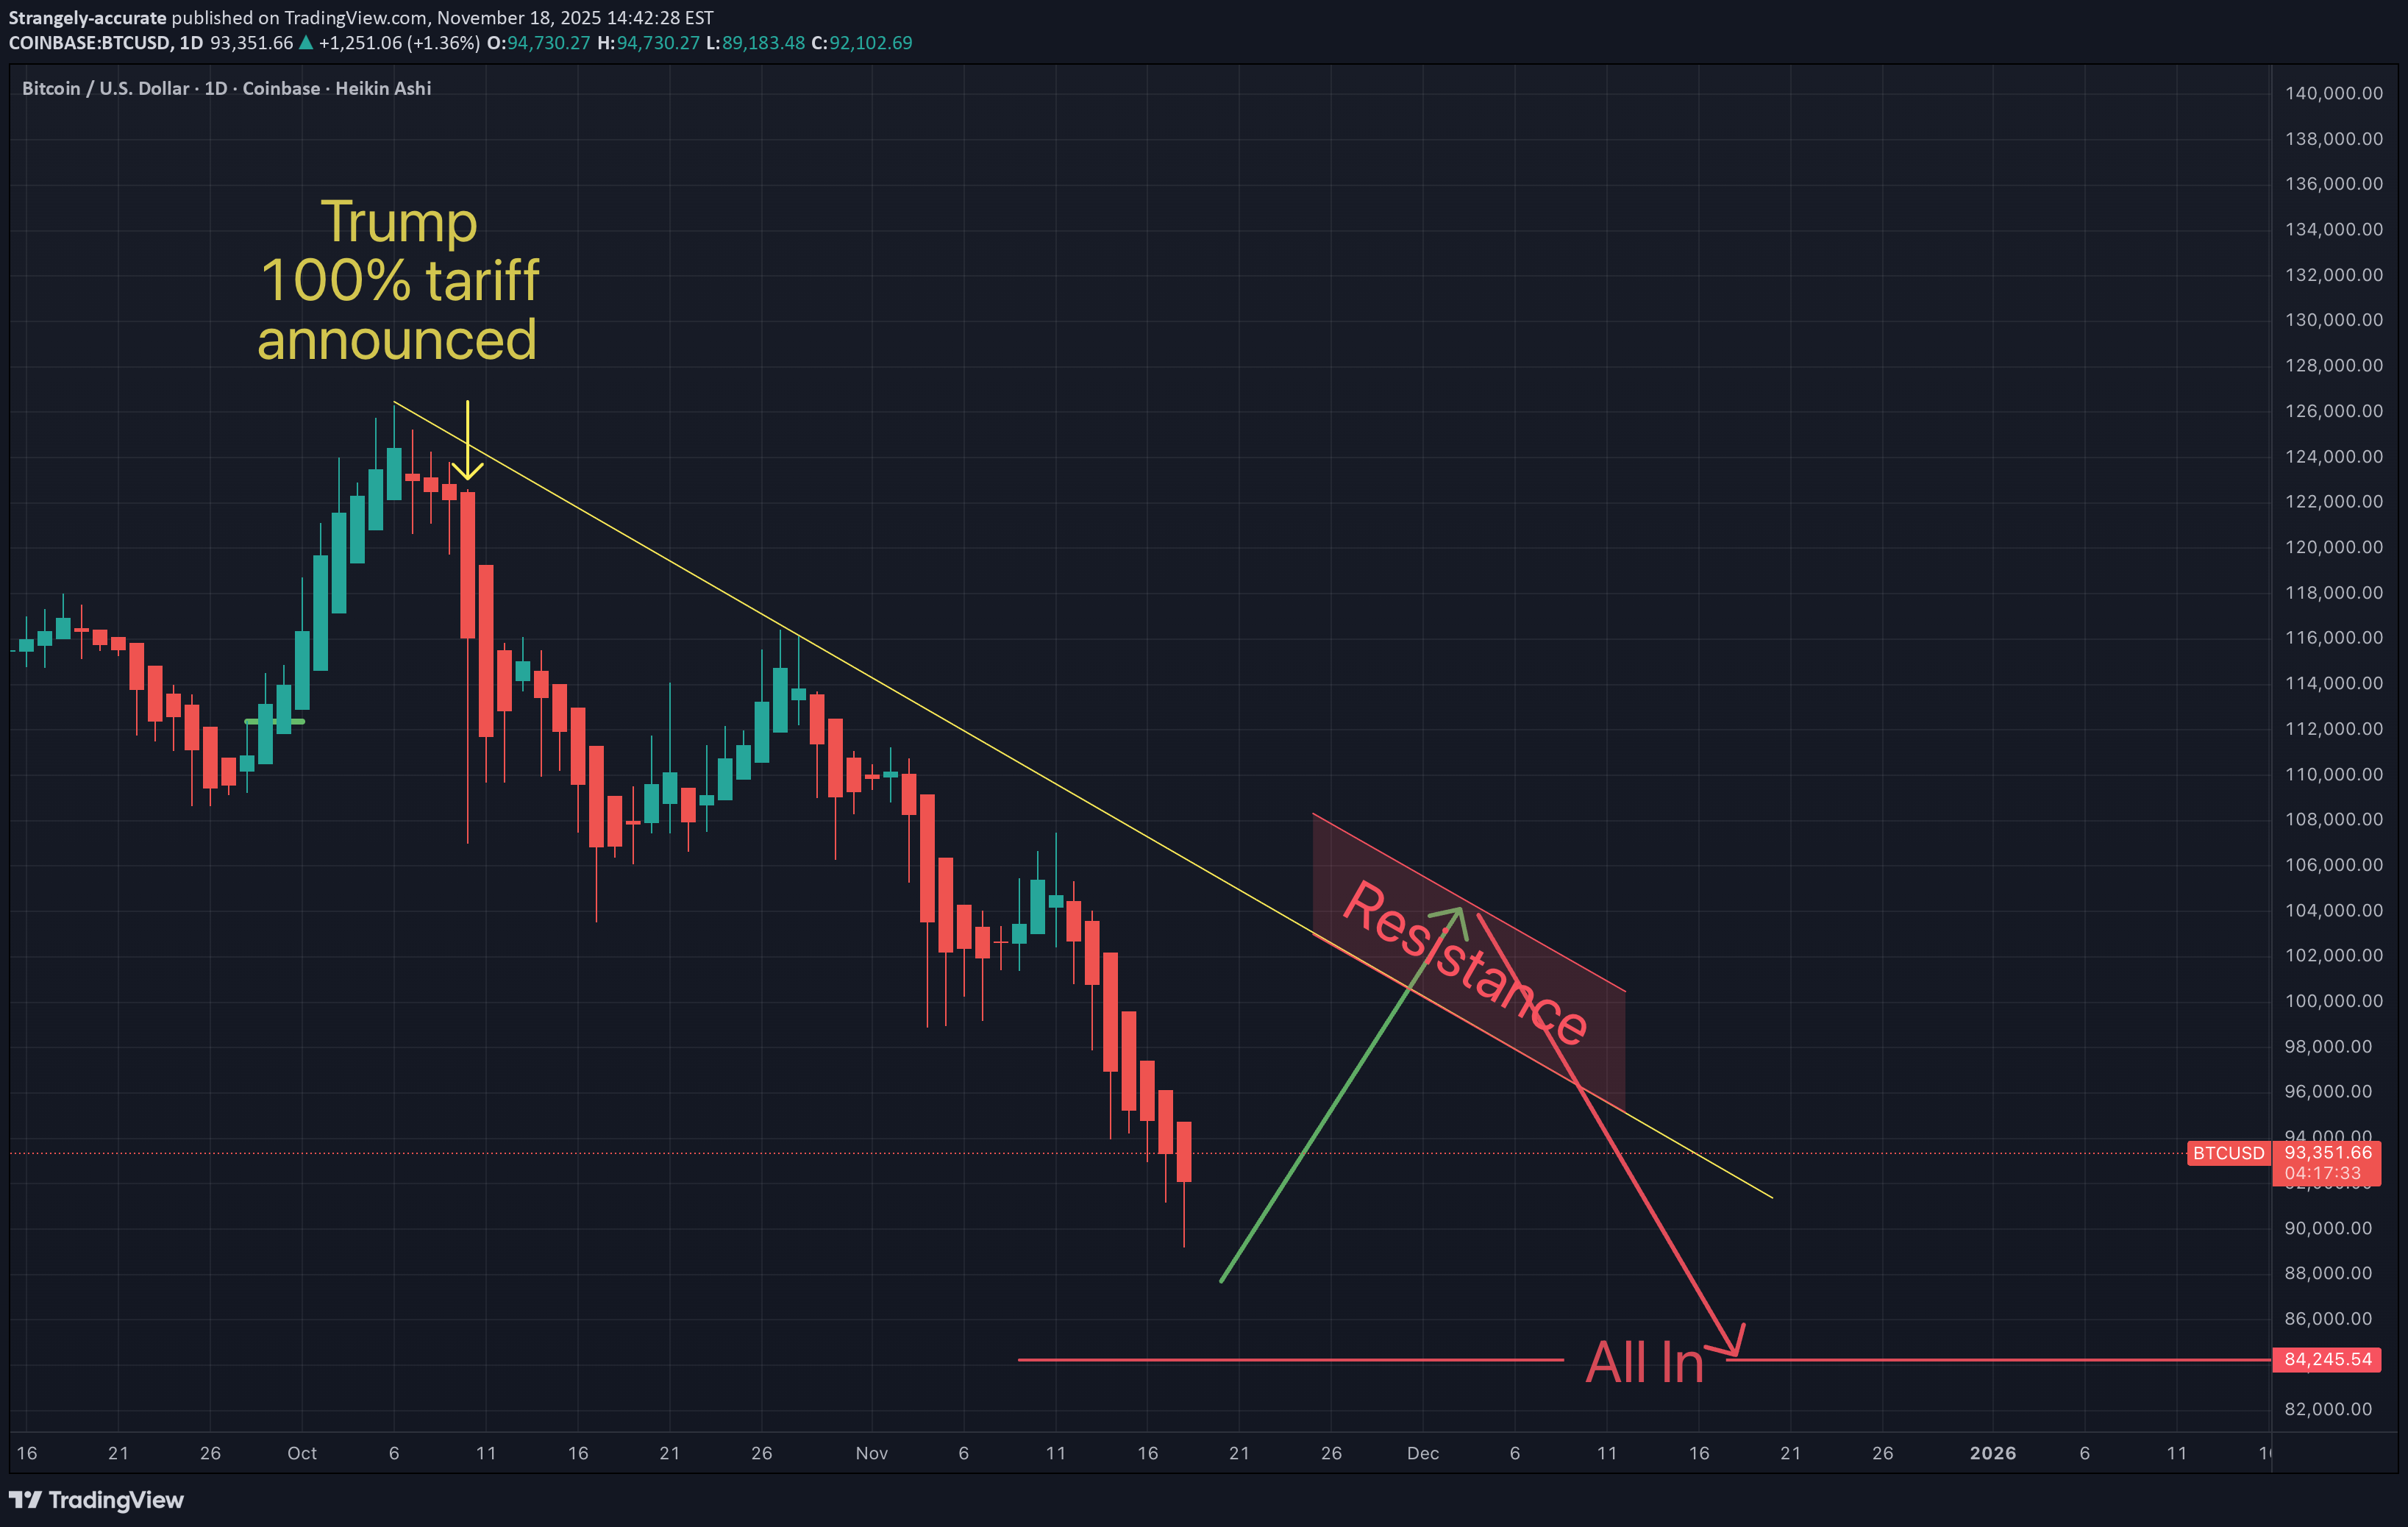
On Oct 23rd I suggested that if Btc broke below $96K, it would drop to $84K. $96 just broke 4 days ago, and Btc already hit $89K. For those that were in doubt...$84K is starting to look pretty reasonable now. Btw $84,200 is a WT target and I usually go in heavy on those. If the pattern holds true to form, then I anticipate a big bounce from around $84K, back up to at least $99K. May the trends be with you
Strangely-accurate
تزلزل تسلا و پالانتیر: آیا این دو غول تکنولوژی زیر یک کنترل هستند؟
They're at it again. Folks this is a good horse race. Strangely accurate how they follow each other. Are we in a simulation? May the truth be with you.
Strangely-accurate
نمودار کلیدی تسلا قبل از اوج تاریخی: آیا صعود به قله جدید در راه است؟
ATH NEXT! If I'm wrong, then I have "strict invalidations" with minimal loses...because of "proper risk management". If I'm right then I'm taking an extended vacation. May the trends be with you.
Strangely-accurate
تسلا در مسیر اوج تاریخی؛ تحلیل نهایی قبل از جهش بزرگ!
On Oct 21st I said I was adding to my positions (price at the time below): Some of my target hit. We may even go lower. What do you think?
Strangely-accurate
همبستگی عجیب تسلا و پالانتیر: راز ریاضی حرکت همزمان این دو سهم چیست؟
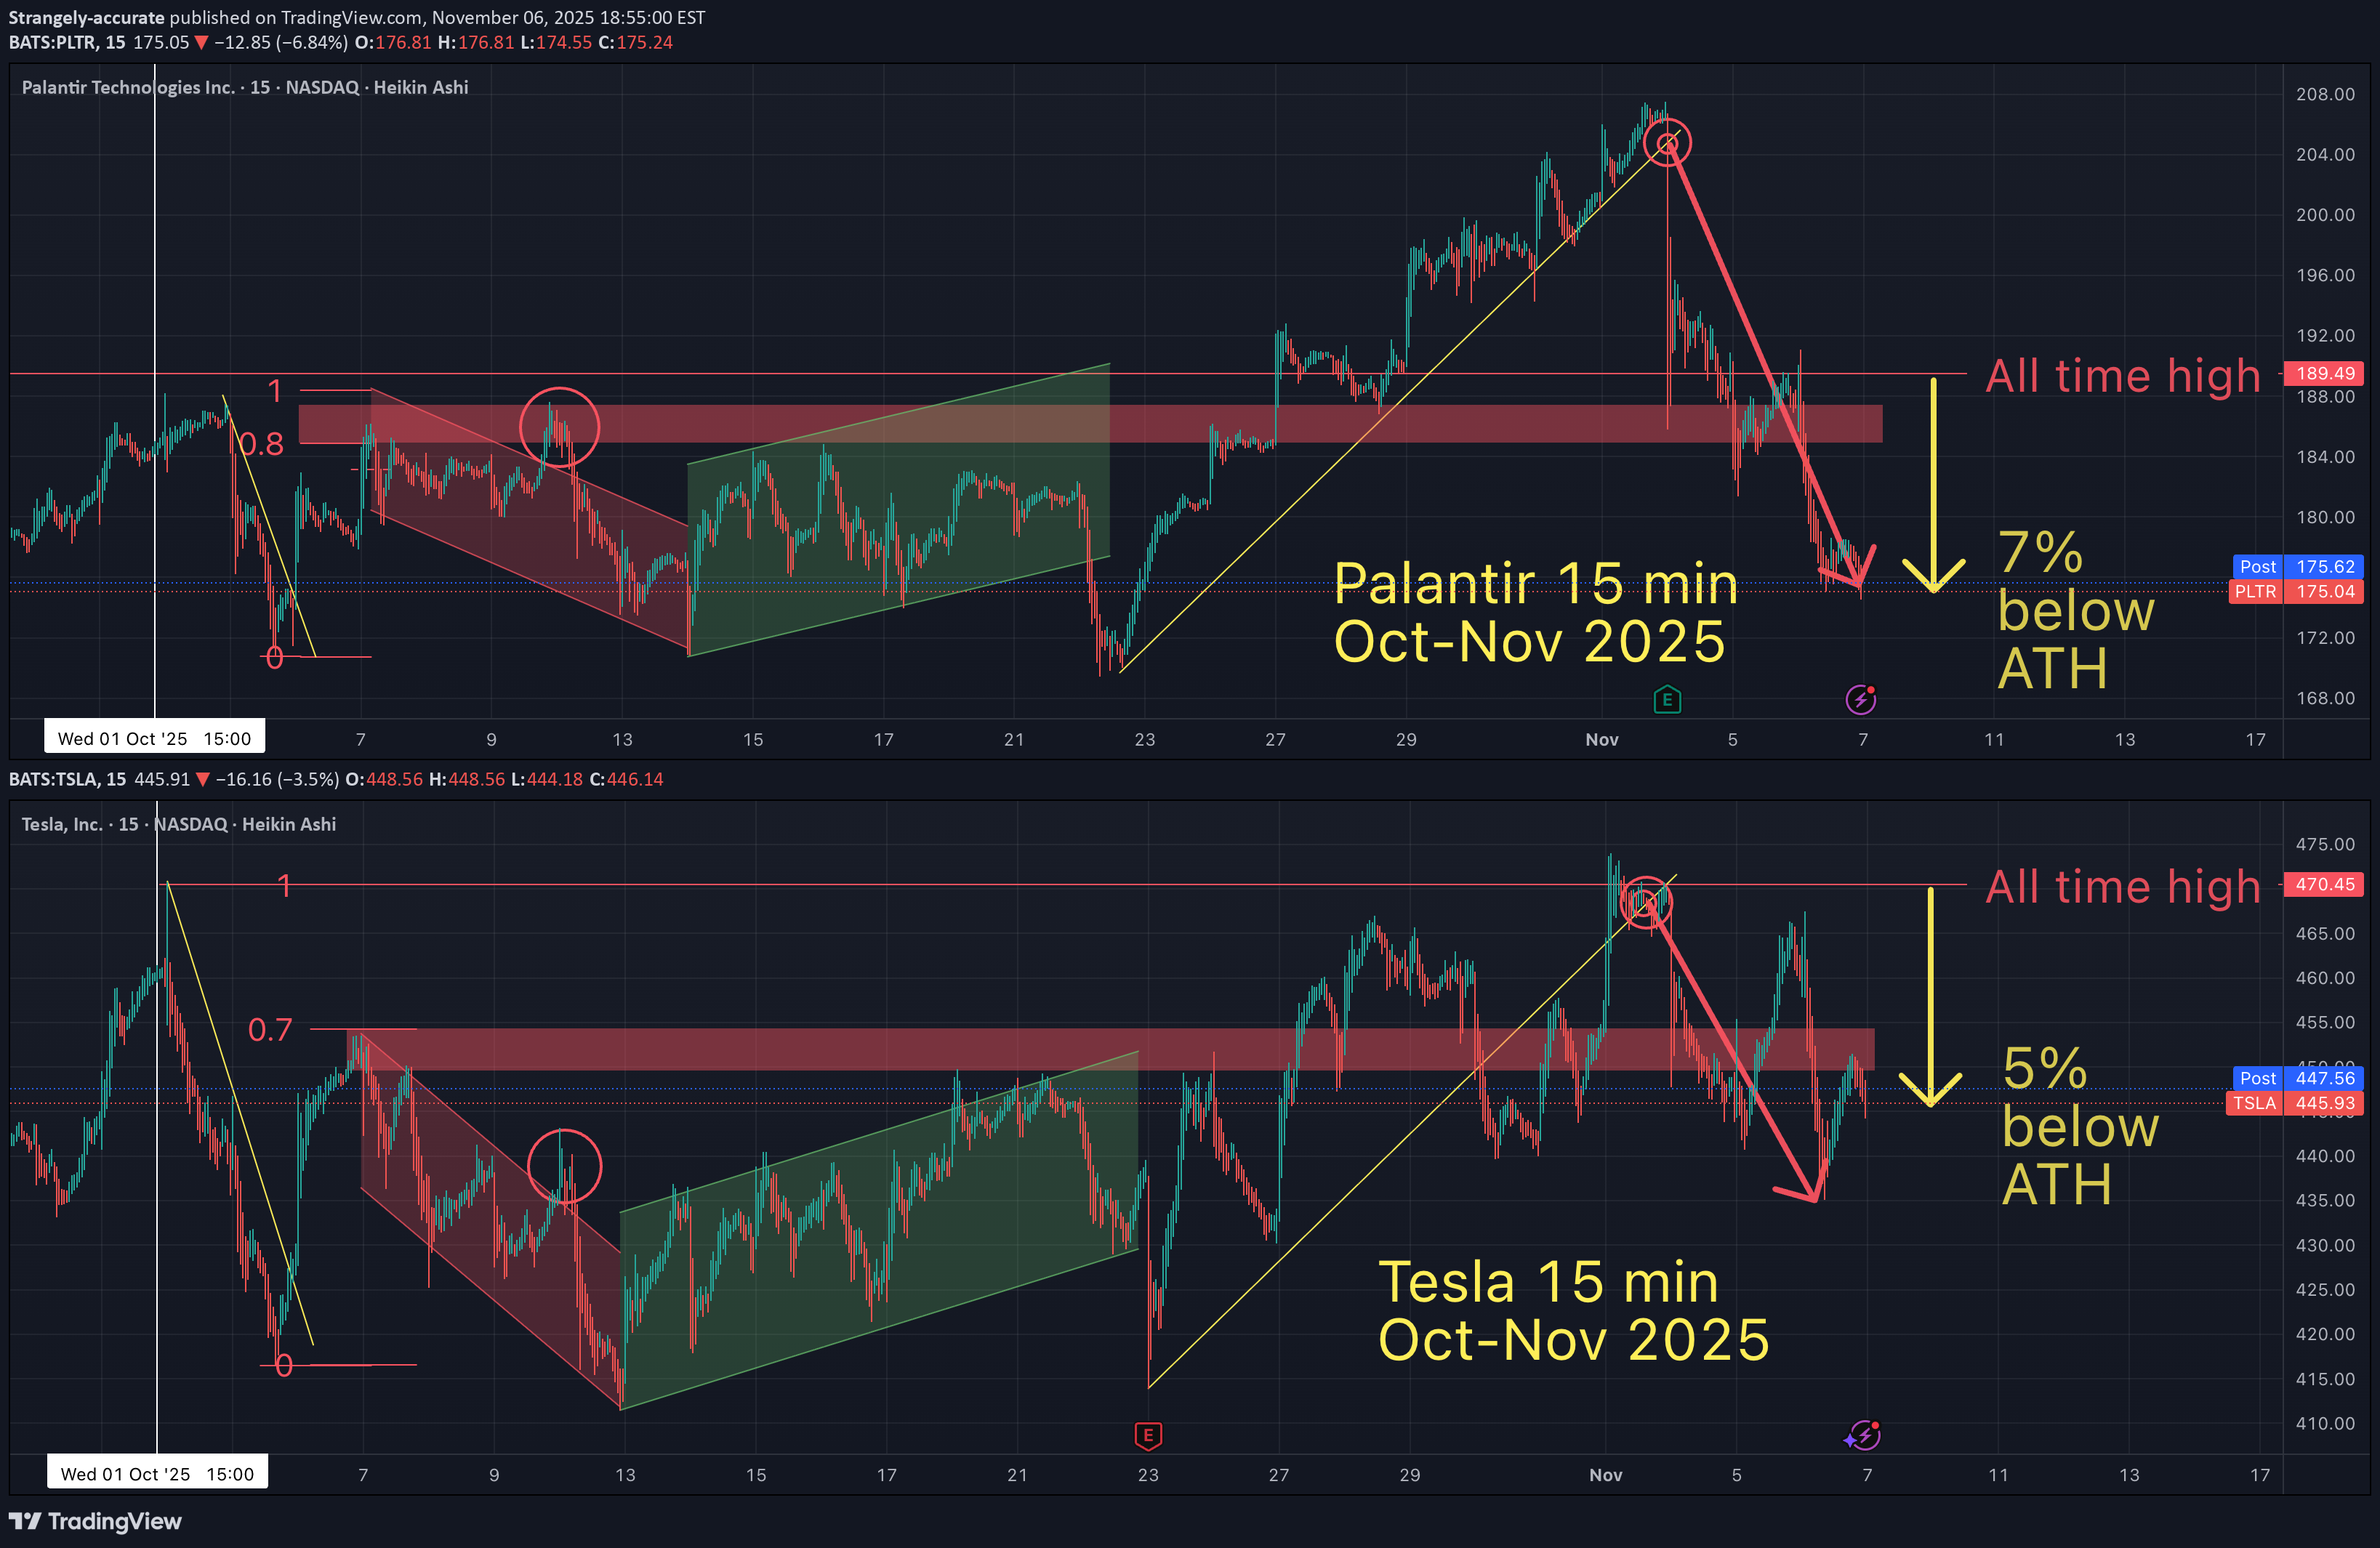
Millions of people ...buying Trillions of dollars of assets ...at random times ...on random days but somehow these 2 assets move together on the x-axis & the y-axis?? Cansomeone explain this to me mathematically? May the Truth be with you.
Disclaimer
Any content and materials included in Sahmeto's website and official communication channels are a compilation of personal opinions and analyses and are not binding. They do not constitute any recommendation for buying, selling, entering or exiting the stock market and cryptocurrency market. Also, all news and analyses included in the website and channels are merely republished information from official and unofficial domestic and foreign sources, and it is obvious that users of the said content are responsible for following up and ensuring the authenticity and accuracy of the materials. Therefore, while disclaiming responsibility, it is declared that the responsibility for any decision-making, action, and potential profit and loss in the capital market and cryptocurrency market lies with the trader.