Technical analysis by Strangely-accurate about Symbol BTC on 12/8/2025

Strangely-accurate
تسلا و بیت کوین: آیا الگوی تکرارشونده جدیدی در بازار مالی کشف شده است؟
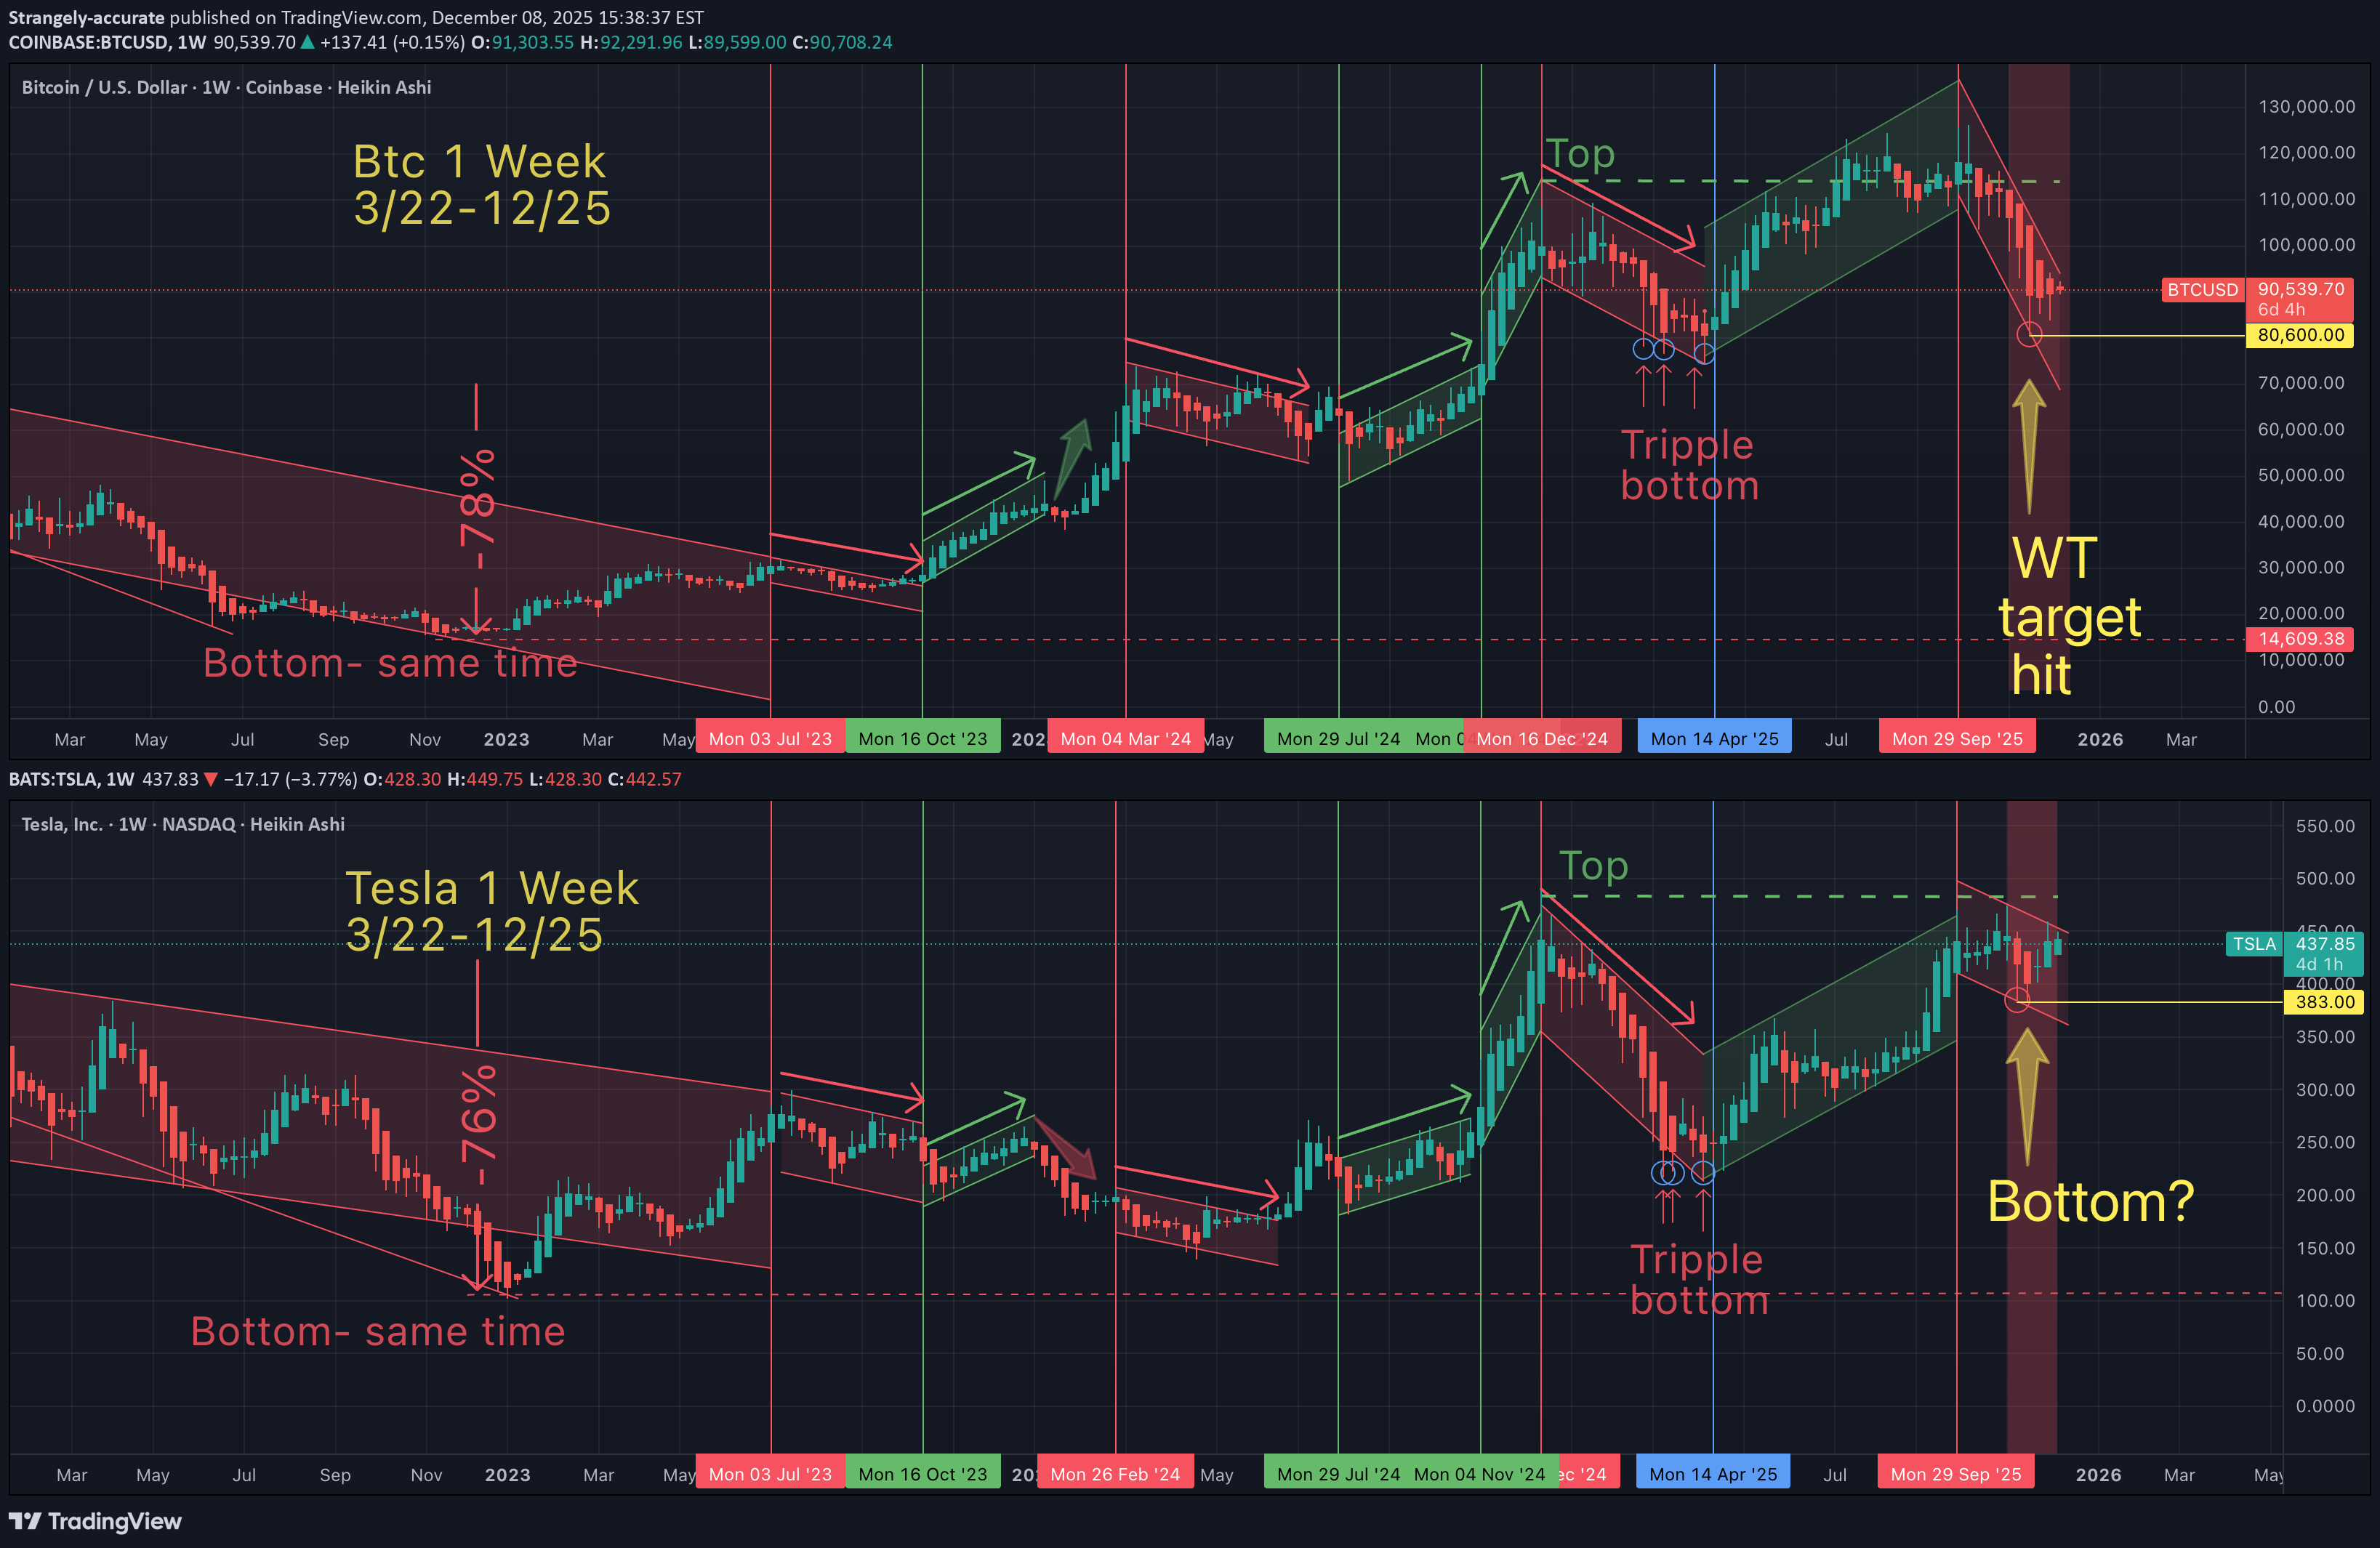
What does it mean that 2 completely unrelarted assets are moving simultaneously? Several of you have asked me how we can capitalize on fractals. So after 50 days of tracking Tesla vs palantir, we learned how one asset can be a leading indicator for the other (pls refer to previous charts). That pattern was identical for over 2 months, except that fractal suggested that Tesla would also break to new all time highs. That hasn't happened yet, but I believe today's Btc vs Telsa chart (above) confirms last week's low as the anticipated Btc bottom ($80K-$84K). This Btc bottom confirmation (of a highly correlated assest), adds further conflunce to my ongoing Tesla buy zone charts that have called for a max bottom of $373. Note: So far Tesla's retrace came within 2% of that target on Nov 14. Today, Tesla is up 16% from that target low. So is this further confluence that Tesla has reached it's bottom? But back to the original question. If these charts are graphs, with "coordinates" x and Y...and linear equations seem to govern how "price action respects trandlines"...then can any of you math nerds out there explain how price action follows strangley predictable trendlines. More importantly, please explain how two completely indepent assests can have this same trendline phenomenom simulateneously...for months ("a fractal")? May the (universal mathematical) truth be with you. Cue in song: "Wake Up" - By Rage Against The MachineThis is the previously mentioned Btc "WT" target