
SpaceCatZ
@t_SpaceCatZ

What symbols does the trader recommend buying?
Purchase History
پیام های تریدر
Filter
SpaceCatZ
$SAGA / UsdT Prediction

Hello traders, The chart resembles the pattern of an inverse head and shoulders. This formation is significant because it illustrates the shifting dynamics in the market, allowing us to anticipate the next trending phase. The critical levels to watch are $1.74, $2.05, $2.83, and $3.42. If these levels are surpassed, the price could move to the next level. Otherwise, we may need to retest the previous critical level to find support. If everything goes well, the sky is blue and the grass is green, then we can reach our final destination! I will keep you updated on this chart as we progress.
SpaceCatZ
$Degen Prediction! Daily Chart
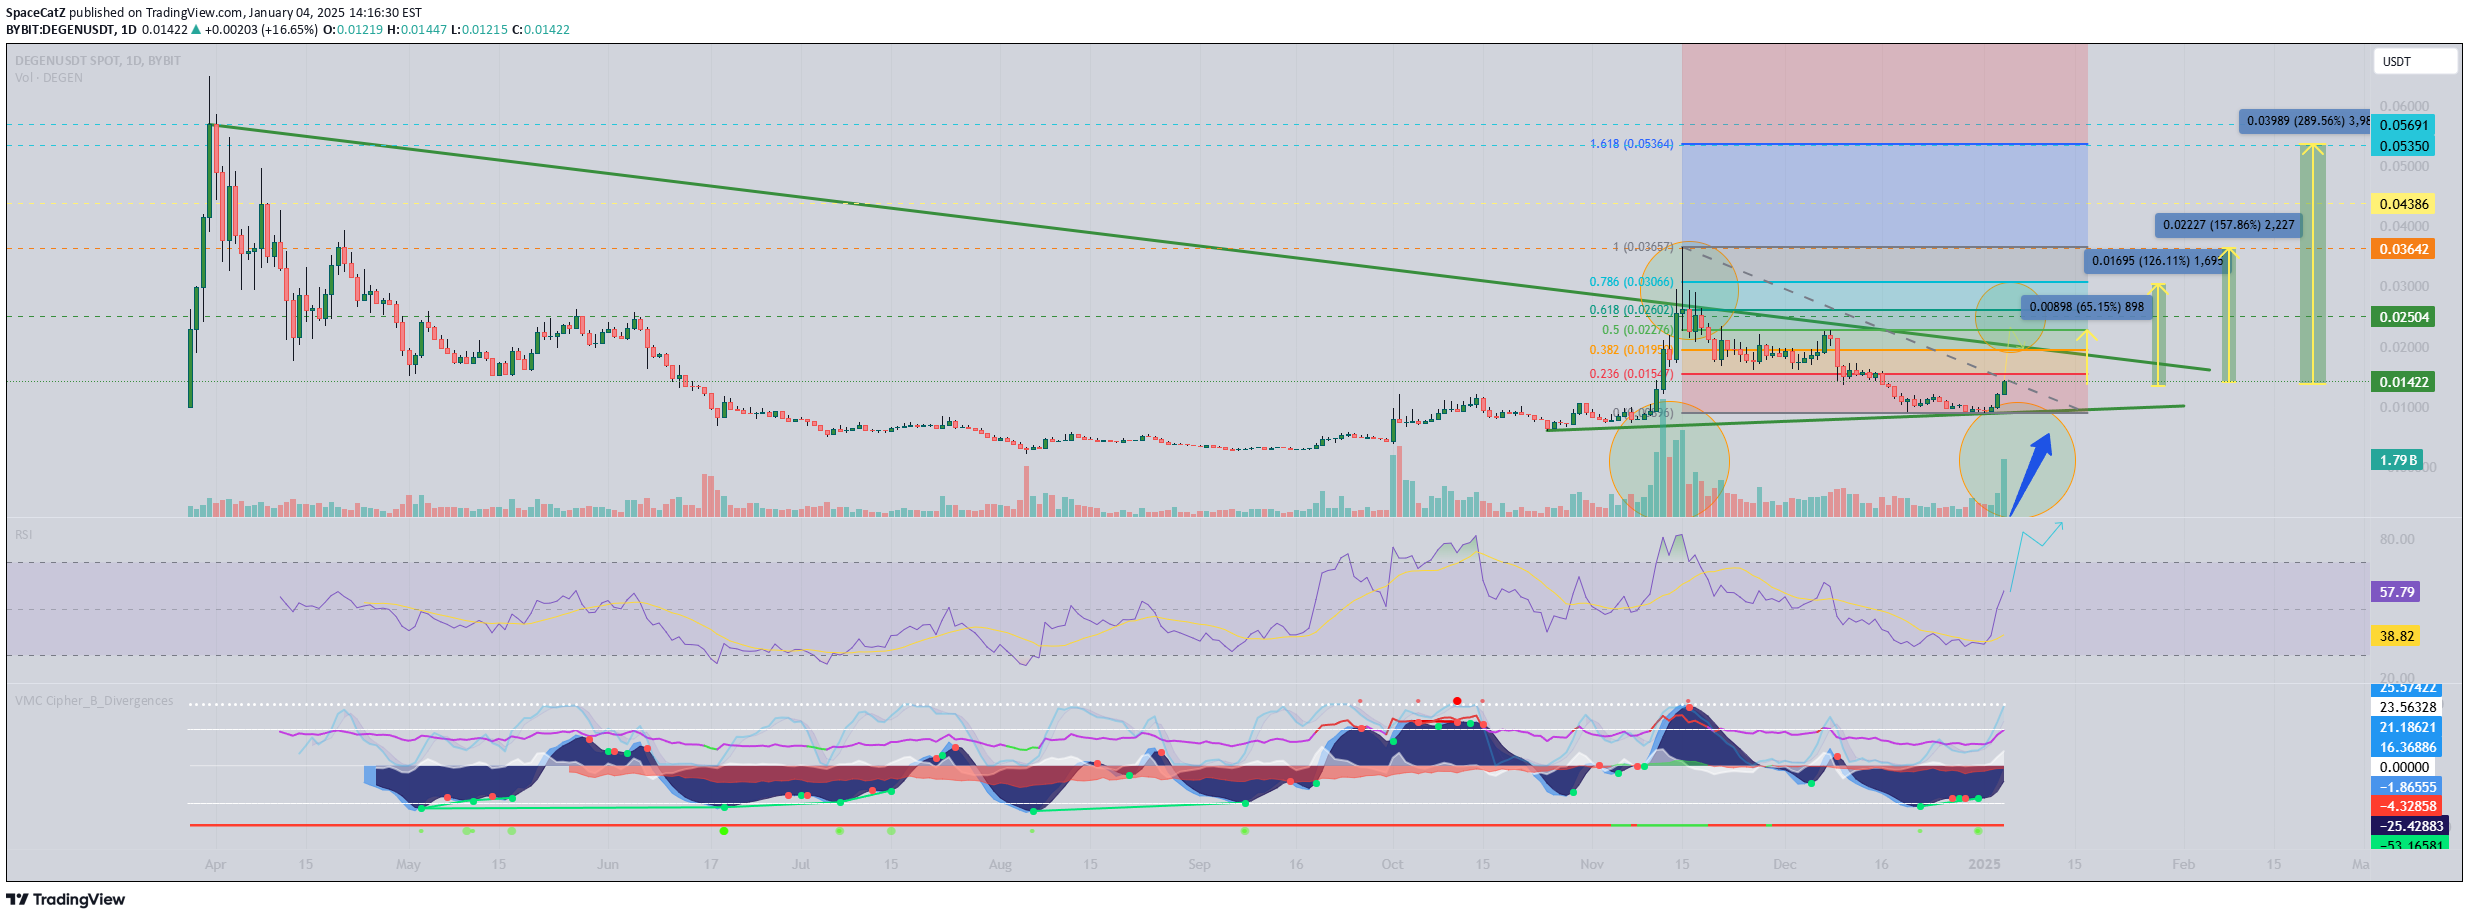
Hello Traders, I've been closely tracking the Degen chart since May of last year, and I’m excited about the recent developments. After a period of low volume last November, we're now seeing a significant uptick over the past few days. When I analyzed the chart, the price was at $0.0136, and the volume was surging. I'm anticipating at least a 60% gain! The key decision point lies in the $0.020 to $0.023 range. If we can break through this crucial zone, there’s potential for the price to reach $0.030 or even higher. Currently, the RSI sits at a robust 57 points on the daily chart, indicating ample room for growth. With moving averages showing a strong bullish trend and oscillators remaining neutral, the outlook is promising! I see a good opportunity but make sure to do your research!Important note: If you plan to enter this action midway, wait for a pullback on the 4-hour chart for a safer entry. It may not be significant, but still worth considering!!A minor pullback has occurred on the 4-hour chart, bringing the price down to just below $0.014. This may or may not be sufficient for the current trend. Predicting an extremely bullish setup for a rebound is challenging, as prices have been operating at an RSI of 80+ for an extended period on the 4-hour chart. Currently, we could either pull back to the low to mid $0.13 range or rise to about $0.016-$0.018, where we might consolidate for a while. At least, this situation provides safer entry opportunities below $0.014, but these may not last long! !!!EXTREMELY BULLISH CHART!!!Good news! $Degen has consolidated around $0,014 range and appears to be preparing for another strong move. The RSI on the 4-hour chart is still above 70 basis points. When a coin becomes extremely bullish, this is a very positive sign. Now, moving above $0.016 should be an achievable target.
SpaceCatZ
$Steem prediction on weekly ch. Possible Cup and Handle pattern!

Hello Traders, I have been observing a solid Cup and Handle pattern on the weekly chart. As a general rule, cup and handle patterns are considered bullish price formations. Pay close attention to the $0.30 level. If we can close the weekly candle above this level, it will confirm the pattern. The target for a Cup and Handle formation is calculated by adding the height of the cup to the breakout point of the handle. In this case, I estimate the cup's height to be around $0.15, so when we add that to the $0.30 target, we get a projected price of $0.45 in the near future, if the Cup and Handle pattern plays out as expected. Previous sample prediction with a similar pattern!We reached the $0.36 level, but unfortunately, some criminal groups online, primarily from Chinese communities, exchange secret messages before collectively opening short positions. Although we are above the $0.30 level, we did not close the weekly candle above it. Therefore, the Cup and Handle formation is not yet confirmed.
SpaceCatZ
$SCRT / USDT Prediction

Hello Traders, This is another bold prediction. I've tried to explain everything on the chart itself. The first target is the $0.78 level. If this level can be surpassed, we should see the $1 mark reached quickly. If we break through the $1 level with significant volume, additional levels on the chart will likely follow. This coin is not very suitable for high leverage trading because it moves too quickly in either direction. If you're planning to invest in this coin in the future, it's important to determine your entry and exit points in advance.
SpaceCatZ
$Zen Prediction!

Hello Traders, First of all before Everything else I am not recommending you to open a new position because it is very risky but at the same time If we are in Mega rally phase , this could go up by quite a bit like the last time. So you are warned about the very big risk! Big risk = Big reward or Big loss, Could be either. During the mega rally, price action doesn't allow safe and easy entry point! Weekly and daily volume reached historical highs, and institutional interest is peaking about this coin. In the past we have seen mega rallies with this coin and it was a Big one , I don't see any reason why we shouldn't repeat the similar cycle as before. Previous rally presented 3 RSI peaks above 80. So far Zen only produced 1 peak. I am not saying we are but even If we are going to $150 levels at some point , we will have a large pullback at some random point. One can't be sure about exact timing. It could be now or after reaching $50 or $70 or $85 hard to say. That is why buying at this point risky!! Since it is hot topic at this moment , I will update this chart regularly!
SpaceCatZ
$BAT Prediction on weekly frame

Hello Traders, I have been watching Basic Attention Token for a while. So far it has been a bit underperformer. However on the weekly time frame , incrementally increasing volume along with technical values signaling for a possible rally! Technical points Weekly chart * Rsi is 52 perfectly sitting in the neutral zone ,starting to curve up * 3 major indicators flashing (RSI,OBV,VWMACD) * 11 Moving averages out of 14 producing strong buy signal * Oscillators producing buy signal * Upside potential 5x greater than downside * Grayscale investors very interested in this product! * 385mil USD mid-market cap coin .All of the Coins are already in circulation . No more unlocks or mining. * Great product that producing high revenue.(Check Brave browser! My personal opinion is their product better than $2.4trillion usd company Google's browser) * Offered by the Big exchanges Binance, Coinbase etc. * Great team. You can also view every individual that works there by their name. Nothing is secret! Possible Targets are outlined on the chart! I am personally expecting big rally. We could possibly see $1 or more at some point. Please do your own research! And don't get stuck by the shorter time frames! Make sure to have a Great Christmas and new year!
SpaceCatZ
$XVG Prediction! Daily chart..

Hello Traders, As of Late market showing sending mixed signals while BTC correcting. Altcoin market wide correction took place last couple of weeks and most coins deeply corrected! One can't be sure weather correction is fully completed or not but last few days some altcoins holding their grounds well while BTC correcting including XVG. On a daily chart $0.0018-$0.002 seems grenade proof support. Most importantly daily candle doesn't seem like want to close below $0.002 level. When I placed Fib retracement lines , it is clear that price action following the main retracement points as it is clearly marked on the chart. Moving Averages clearly bullish on daily timeframe while oscillators remain neutral. My favorite Chipher_B_divergence indicator flashing low green Dot! RSI indicator in the neutral zone which could mean that lots of room to go either direction. We also have Symmetrical Triangle .As the price moves toward the apex, it will inevitably breach the upper trendline for a breakout and uptrend on rising. Traders should watch for a volume spike and at least two closes beyond the trendline to confirm the break is valid and not a head fake. I am personally very bullish on this chart and will update this chart as we move along. We do have a different outcomes that could take a place next few months. I applied 7 different line arrows to simulate the possible price actions. Timeline is arbitrary. It could take shorter or longer time to achieve!Correction** I meant to type $0.00118-$0.00120 seems grenade proof support! Most importantly daily candle doesn't seem like want to close below $0.0012 level.We reached quickly to $0.00139 range but we are still not out of triangle yet. If we don't take $0.0145 and stay above on daily candle, We may or may not need to visit $0.012 levels. I still don't trust btc yet. Going up and down 10k in a hurry!we had a good run towards $0.015 level but could not stay up there before daily candle closing. Volume wasn't up par with the previous rallies. Now we may or may not need to test the previous support of $0.00118-0.0012 level, If it holds, we will try again otherwise one step down towards $0.001 levels. Time will tell us.
SpaceCatZ
$KAIA / USDT Short Term prediction! Massive potential
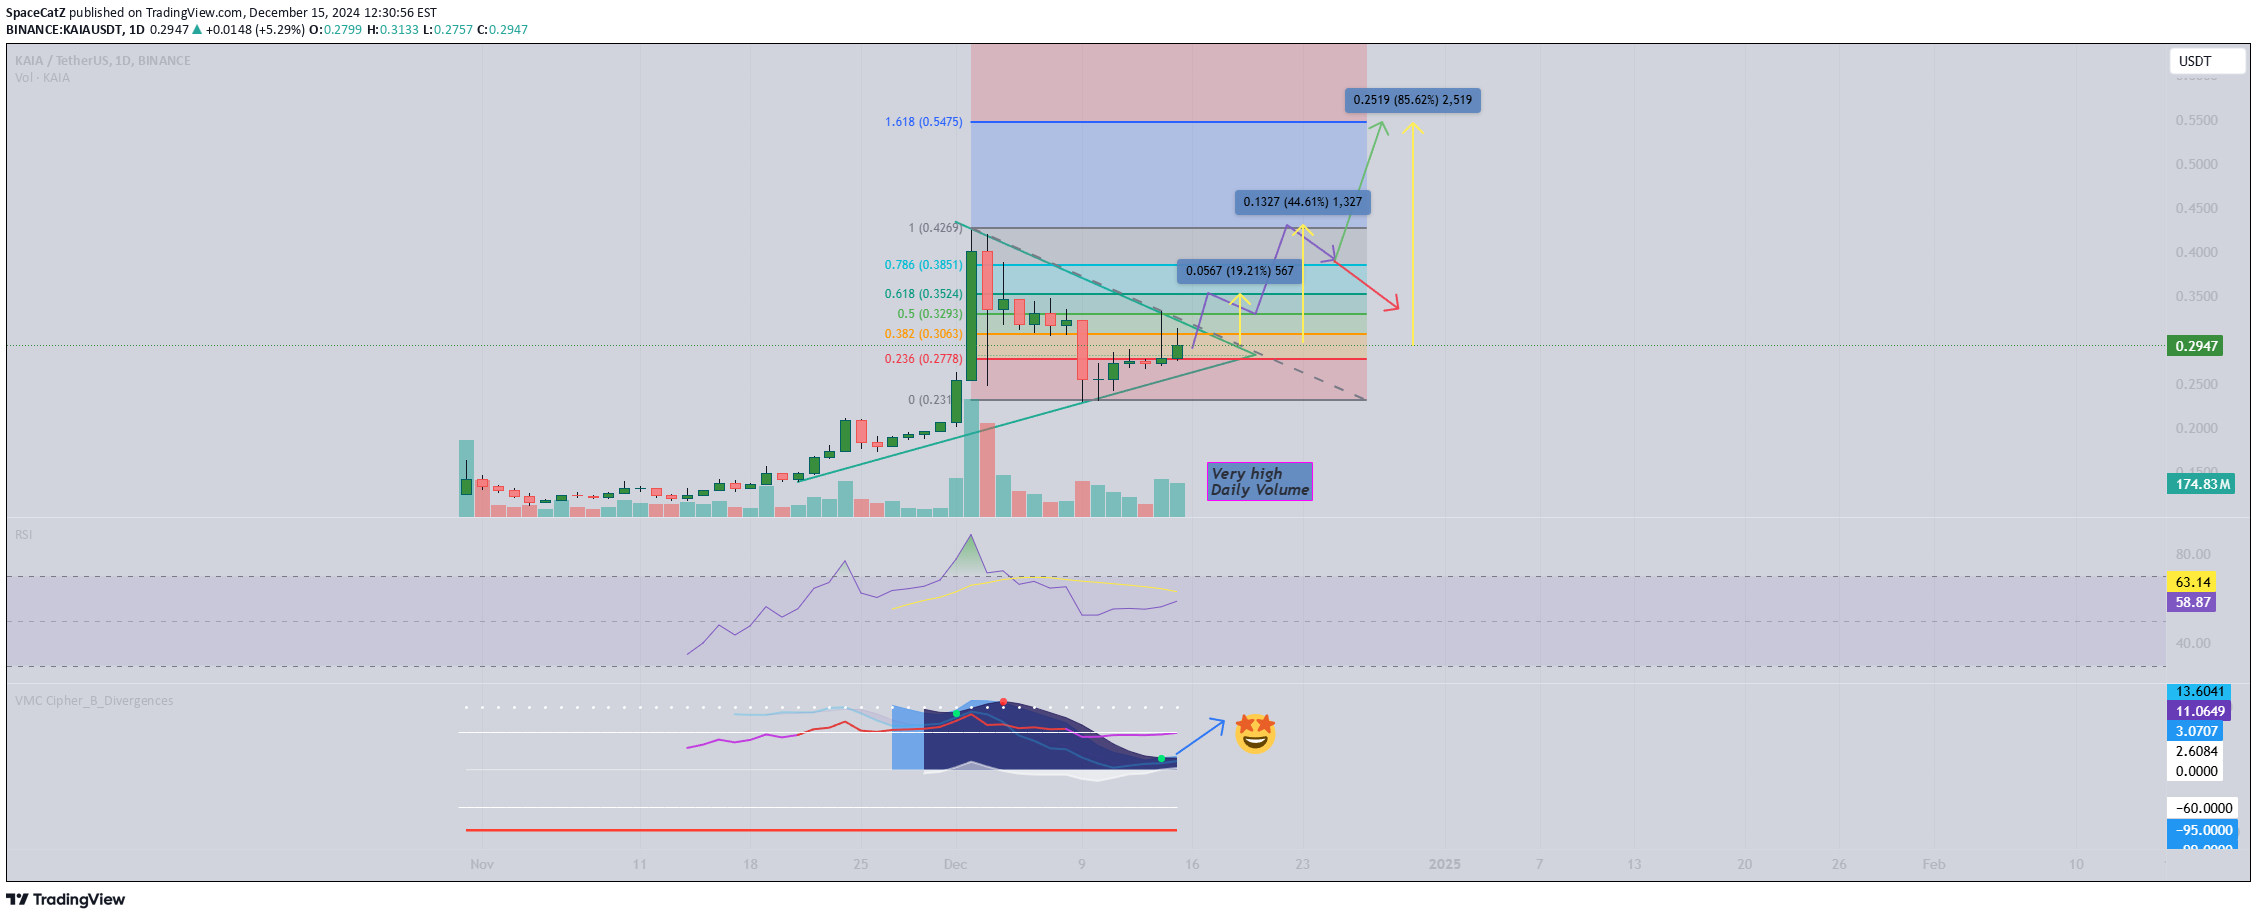
Hello Traders, This is a fairly large market cap coin with a massive short term potential. You need to do some research to understand the true potential yourself. I was writing about the HBAR same way back in last summer and as of late it went up 10x. So near term within 4 weeks period we have 20%-85%+ gain potential but the conditions must be right. Volume is quite high and 5 major indicator flashing and pointing out for long possibilities. Upon breaking out of the upper side of the triangle, we may experience sudden major move with or without pullback! If it does pull back a bit more first which is a lot lower possibility given this momentum, it should go back up more violently! *** No alt coins can survive Major BTC crash! So one need to watch the overall market patterns. *** Below $0.26 this idea may not happen on the short term!We are almost below the triangle. Short term idea may or may not work on this coin. *********MAJOR WARNING************!!!! I found another Issue with this coin. They are censoring their X(twitter page). If they don't like your non offensive negative comment they flag it and censor it instantly so others can't see it! So they are not to be Trusted at this point!!! I was not aware of this while I was writing this idea. SO NO LONGER RECOMMENDING!
SpaceCatZ
$NEIRO Might be getting ready for 40%+ short term push!
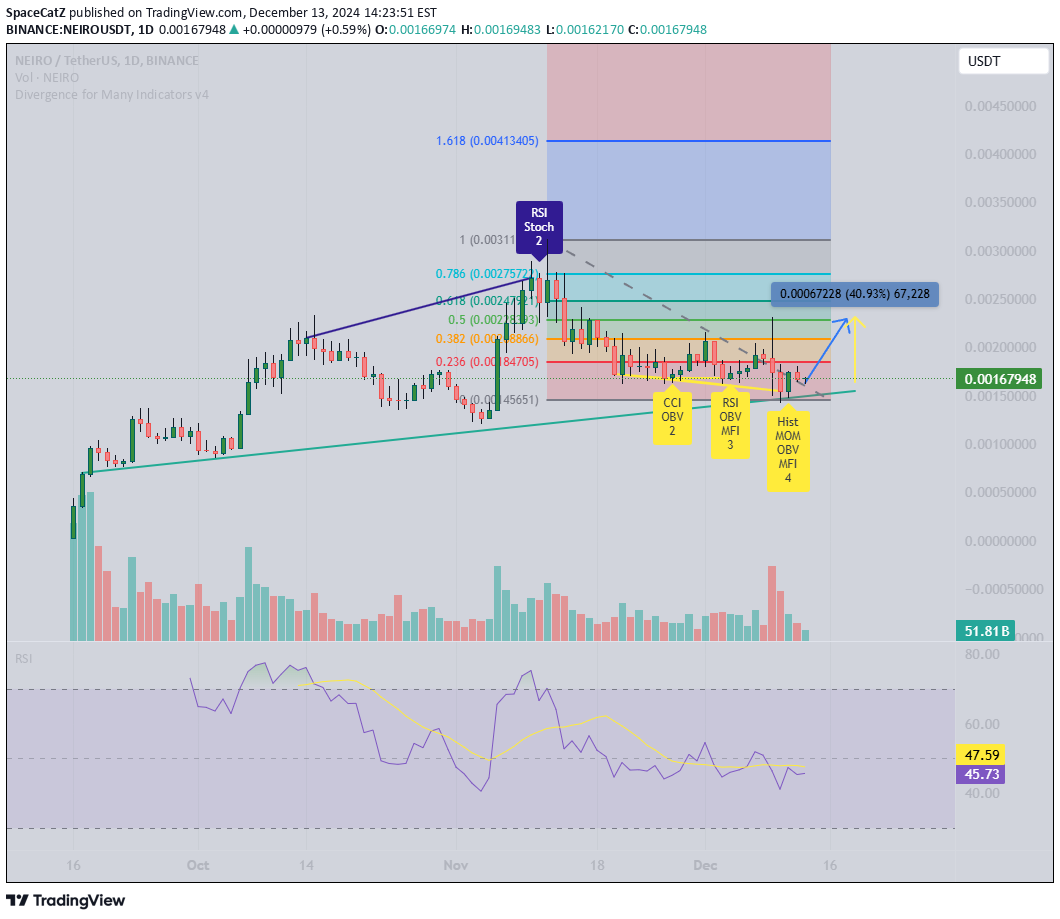
Hello Traders. As you probably know I don't like to publish short term setups due to the fact that many things can happen such as fuds, Btc crash etc. As per Nerio's daily chart, massive accumulation phase seems to be taken place for a month. 4 Major indicator signals also agreeing the accumulation phase nearing end (Hist,MOM,OBV,MFI). Many combined signals including decreasing volume while correcting pointing out for possible a rally! I will update this chart as we move along!As I said I don't like publish short term targets. BTC crashed and took most of the altcoin with it! All this dog, cat, rabbit whatever they call themselves crashed as well. I posted this idea solely based on the chart. I though it was accumulation phase but it seems like it was distribution phase. Anyhow they couldn't get me in this trade. I was on high alert just because of BTC but they got quite a few people. When market turns bullish this will go up as nothing happened.If BTc can break past 99k-100k range and build momentum sometime. We may see serious rally with this coin . I mean something along 2x+ Keep an eye on this one for sure!Started to move as expected! If Neiro can close the daily candle above $0.0012 range , we may see quick jump towards $0.002 range. Similar jumps happened twice last cycle so I am assuming it is possible again with large daily volume! Chipher_B indicator showing lower green dot so very powerful Signal!
SpaceCatZ
$Alpha / Usdt Bullish Prediction ===> Possible 4x-8x returns

Hello traders, Another beautiful chart Infront of us. Stella is nearly $100mil UsD market cap coin which considered smaller cap nearing medium cap range. When we zoom out the weekly chart , it is fairly easy to see something big brewing. Weekly Volume increasing gradually, it is pointing out that investor confidence is increasing as it progresses. I am expecting good 4x to 8x return by looking at fib levels and previous infliction points on the chart. First stop should be quicker $0.27-0.3 range then longer term $0.6 then possibly $1 target! Btc dominance is going down and USDT dominance dropping rapidly which further confirms for major altcoin season. Most largest cap altcoins gained 2-3x already , next will be smaller market cap alt coins. make sure to do your own research! I will update this chart as we move along. This is not short term prediction so it will take some time!
Disclaimer
Any content and materials included in Sahmeto's website and official communication channels are a compilation of personal opinions and analyses and are not binding. They do not constitute any recommendation for buying, selling, entering or exiting the stock market and cryptocurrency market. Also, all news and analyses included in the website and channels are merely republished information from official and unofficial domestic and foreign sources, and it is obvious that users of the said content are responsible for following up and ensuring the authenticity and accuracy of the materials. Therefore, while disclaiming responsibility, it is declared that the responsibility for any decision-making, action, and potential profit and loss in the capital market and cryptocurrency market lies with the trader.