
Soheilnaderi_crypto
@t_Soheilnaderi_crypto

What symbols does the trader recommend buying?
Purchase History
پیام های تریدر
Filter
Soheilnaderi_crypto
لینک (LINK) آماده انفجار؟ تحلیل تکنیکال قویترین آلتکوین بازار!
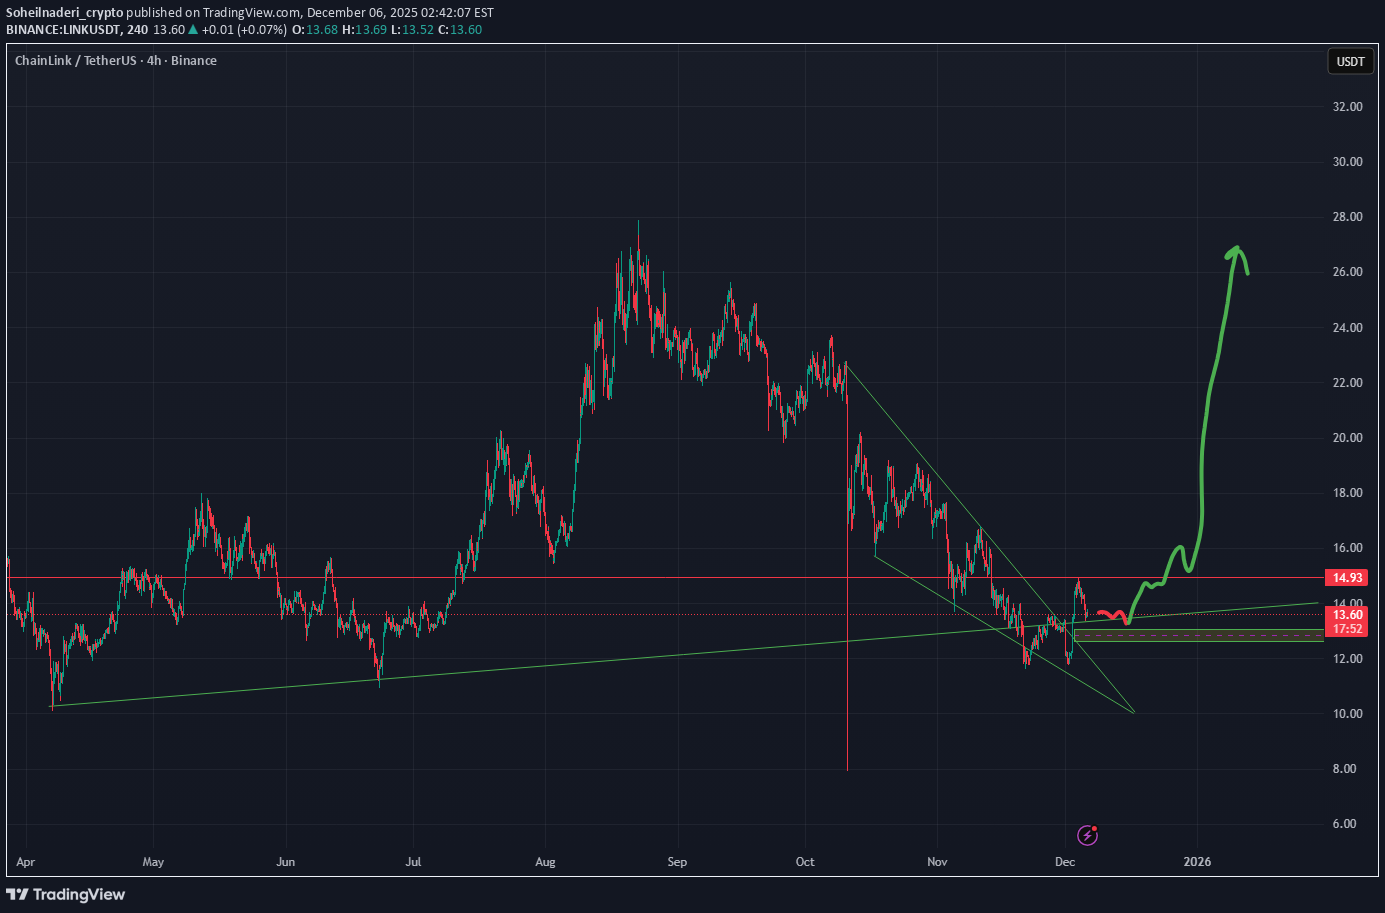
LINKUSDT SPOT Given the current market conditions, Chainlink (LINK) stands out as one of the strongest altcoins from a structural perspective. Its chart is clean, orderly, and technically one of the most attractive setups in the market right now. The price action suggests that LINK is in a smart accumulation phase, with consistent buyer interest showing up every time price tests key support levels. This structure indicates that market makers are actively building a multi-layered base, and if LINK manages to break through its major resistance zone, the asset has the potential to trigger a strong upward move and shift the entire mid-term trend. Even though my drawing on the chart isn’t perfect, the analytical logic behind the structure is accurate. LINK is showing a pattern that often appears before a directional expansion — a controlled pullback followed by a steady, measured climb, similar to a well-structured channel or trendline extension. In summary: LINK is one of the few altcoins with a technically healthy setup, and with a minor correction followed by a breakout, it could enter a meaningful bullish phase.
Soheilnaderi_crypto
تحلیل تکنیکال اتریوم (ETH/USDT): مسیر بلندمدت و نقاط حیاتی بازگشت قیمت

ETHUSDT The green lines are the area that can hit and bounce back up. This could be the direction Ethereum is going in the long term, but be aware that a lot of novelties are needed.
Soheilnaderi_crypto
تحلیل تکنیکال اتریوم (ETH): سطوح کلیدی حمایت و سناریوی صعودی پیش رو!

Ethereum / Technical Outlook ETH is currently trading around the 4,000 USD zone. The blue line marks a major structural support area, where price has previously shown strong demand. The green zones represent ideal spot accumulation levels based on recent market structure and volume reaction. If Ethereum maintains a weekly close above these areas, it supports a continuation of the bullish scenario. A confirmed weekly close below the green support zones would technically invalidate this setup and suggest a deeper correction. ⚠️ Disclaimer: This chart represents a personal technical study for educational purposes only. It does not constitute financial or investment advice. Always conduct your own research before making trading decisions. For continuous updates and technical studies, follow the Telegram channel linked in the profile.
Soheilnaderi_crypto
تحلیل هفتگی اتریوم (ETH/USDT): سطوح خرید طلایی بلندمدت زیر ۴۰۰۰ دلار!

ETHUSDT Ethereum Analysis | Weekly Timeframe (Long-Term View) Current Price: Around $4,000 On the weekly chart, the blue zone has acted as a strong support area, and an overall bullish structure can be observed on Ethereum. 🟢 Long-Term Spot Buying Zones • Zone 1: $3,590 • Zone 2: $2,600 Even in the case of an extended correction, it’s unlikely that Ethereum will sustainably drop below these key levels. 🟡 Potential Price Path The yellow lines illustrate possible routes toward higher highs. Keep in mind that reaching those upper levels may take time — think of it as a “technical sketch,” not an immediate prediction 🤣 ⚙️ Trading Notes • The green lines mark ideal spot accumulation zones. • Consider a laddered entry strategy and manage risk accordingly. • A weekly close below these zones would invalidate the bullish scenario. ⚠️ Disclaimer This is a personal technical analysis, not financial advice. Always do your own research before making any investment decisions. — For the latest updates and detailed analyses, follow the Telegram channel for regular insights.
Soheilnaderi_crypto

Soheilnaderi_crypto

Soheilnaderi_crypto
BTCUSDT

BTC USDT It appears that the market is entering a correction phase. The green lines on the chart indicate step-by-step accumulation zones for spot positions. In my view, the most critical support level for Bitcoin is around $101,000. If the price fails to hold within the orange zone and experiences further decline, the green box may present the most favorable buying opportunity. Personally, I have planned to make my primary entry at approximately $72,000, as I expect Bitcoin to retrace to that level. It is also important to note that the current wave of positive market sentiment will not last indefinitely, and with the approach of winter, negative news may take over.
Soheilnaderi_crypto

Soheilnaderi_crypto
TIAUSDT

TIAUSDT SPOT BUY NOW LONG TERM This is a personal analysis, it can and will have good growth potential.
Soheilnaderi_crypto

Disclaimer
Any content and materials included in Sahmeto's website and official communication channels are a compilation of personal opinions and analyses and are not binding. They do not constitute any recommendation for buying, selling, entering or exiting the stock market and cryptocurrency market. Also, all news and analyses included in the website and channels are merely republished information from official and unofficial domestic and foreign sources, and it is obvious that users of the said content are responsible for following up and ensuring the authenticity and accuracy of the materials. Therefore, while disclaiming responsibility, it is declared that the responsibility for any decision-making, action, and potential profit and loss in the capital market and cryptocurrency market lies with the trader.