
SivaArjun
@t_SivaArjun

What symbols does the trader recommend buying?
Purchase History
پیام های تریدر
Filter
تحلیل هوش مصنوعی بیت کوین: آیا رشد صعودی BTC/USD در راه است؟ (سطوح کلیدی ورود و خروج)
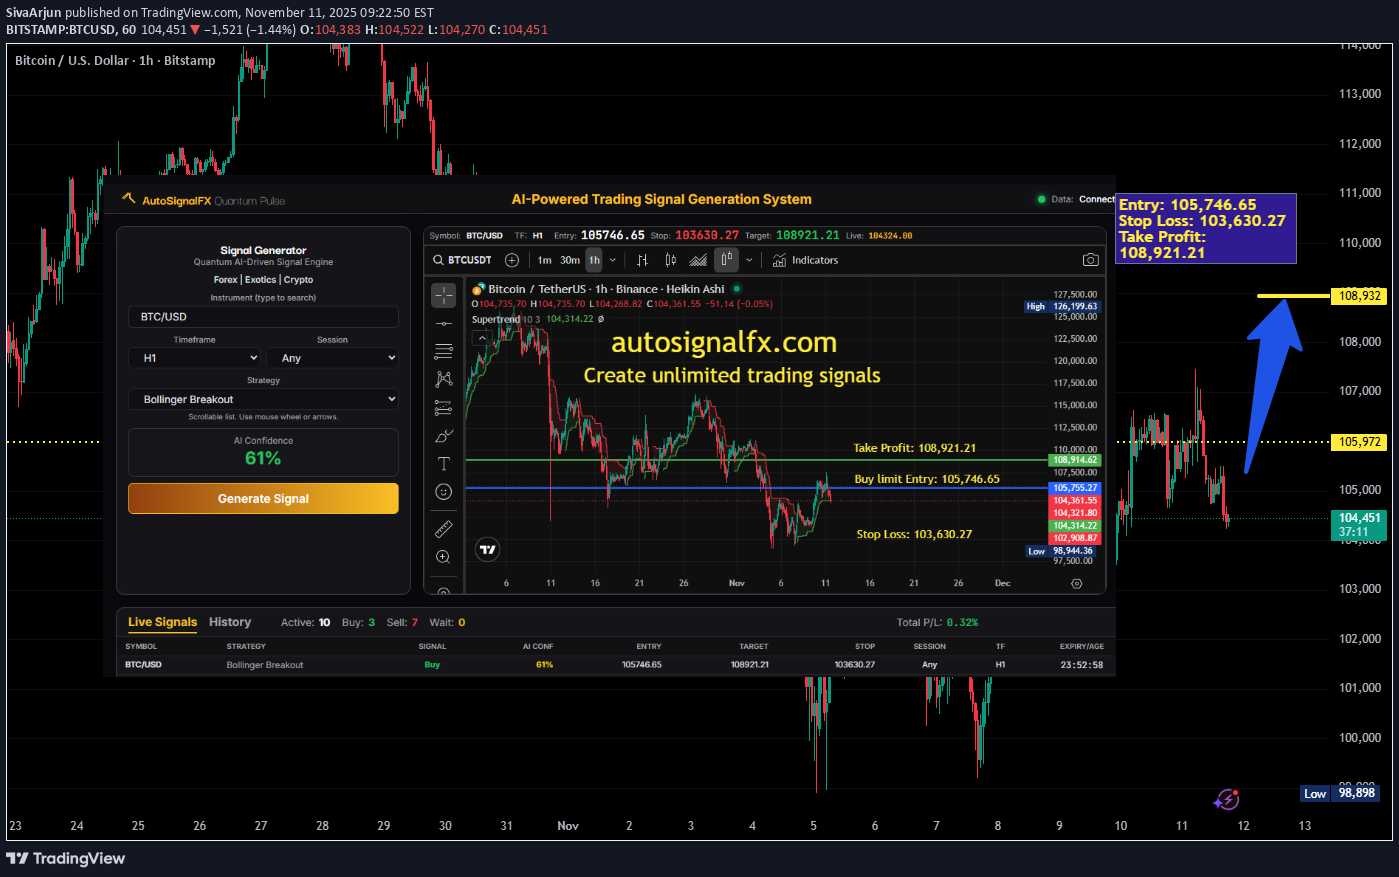
Strategy: Bollinger Breakout (Fallback) Market Bias: Cautiously Bullish Trade Rationale: Bitcoin (BTC/USD) remains in a consolidation zone but shows signs of renewed bullish momentum after defending key support near the daily pivot. Although the automated system fallback triggered under the Bollinger Breakout framework, the overall setup suggests the potential for a continuation higher as volatility rebuilds and traders reposition ahead of upcoming macro catalysts. Price action is stabilizing around the mid-Bollinger band, hinting at accumulation before a potential upside expansion. Market sentiment remains constructive despite recent profit-taking, supported by easing U.S. Treasury yields and improving risk appetite across digital assets. Technical Overview: RSI (14): 50.0 – Neutral; potential to rise into bullish territory above 55. MACD: Flat, signaling a possible crossover if momentum increases. Volatility: Moderate but building – indicative of a near-term directional move. Trend Structure: Higher low formation suggests accumulation above 103,600 zone. Trade Parameters: Entry: 105,746.65 Stop Loss: 103,630.27 Take Profit: 108,921.21 Target Summary: The primary target lies at 108,900, coinciding with the upper Bollinger boundary and a prior intraday resistance zone. A decisive breakout above this level could extend the rally toward 110,500–111,200, confirming renewed bullish control. Conversely, failure to hold above 103,600 would neutralize the setup and expose BTC/USD to a corrective pullback toward the 101,500–100,800 range.
طلا دوباره صعودی شد: راز جهش قیمت و رسیدن به اهداف 4200 و 4400 دلار چیست؟
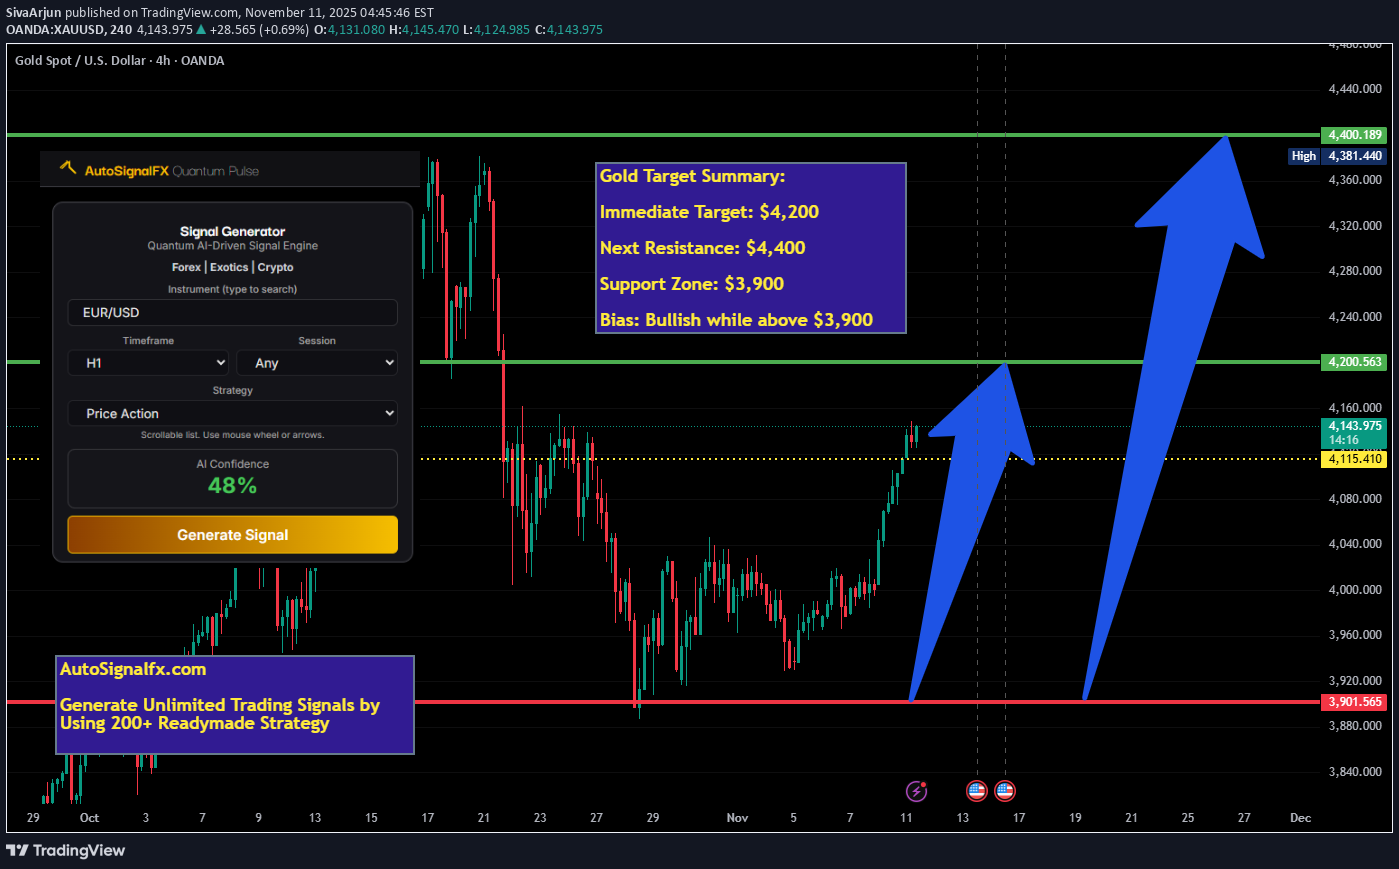
Gold’s latest breakout signals a shift in market psychology rather than a simple technical rebound. Traders are rotating back into duration-sensitive hedges as real yields soften and the dollar stabilizes. Monday’s strong bullish candle and a decisive close above the 20-day moving average have reignited systematic buying flows into the metal. From a technical standpoint, gold’s structure now targets the $4,200 resistance zone, followed by a potential extension toward $4,400 if momentum continues. Support remains near $3,900, which marks the level where trend followers could defend their positions on any pullback. Macro conditions continue to favor the metal: US yields have eased slightly, lowering the opportunity cost of holding non-yielding assets. The US Dollar Index remains range-bound, removing a key headwind. Global equities show defensive rotation, reinforcing gold’s appeal as a portfolio hedge. Over the coming weeks, gold’s path will depend heavily on US CPI data, upcoming Federal Reserve communications, and fiscal developments in Washington. Softer inflation or a dovish tone could drive yields lower and sustain gold’s bullish trajectory into December. However, if inflation surprises to the upside or the Fed pushes back on easing expectations, a short-term correction toward $3,900 may occur. Overall, the trend bias remains positive, but momentum is highly data-sensitive in the near term. 🎯 Summary Target: Immediate Target: $4,200 Extended Target: $4,400 Support Zone: $3,900 Bias: Bullish (as long as real yields stay contained and USD remains neutral)
صعود انفجاری ریپل (XRP): آیا ETFهای جدید قیمت را به ۵ دلار میرسانند؟
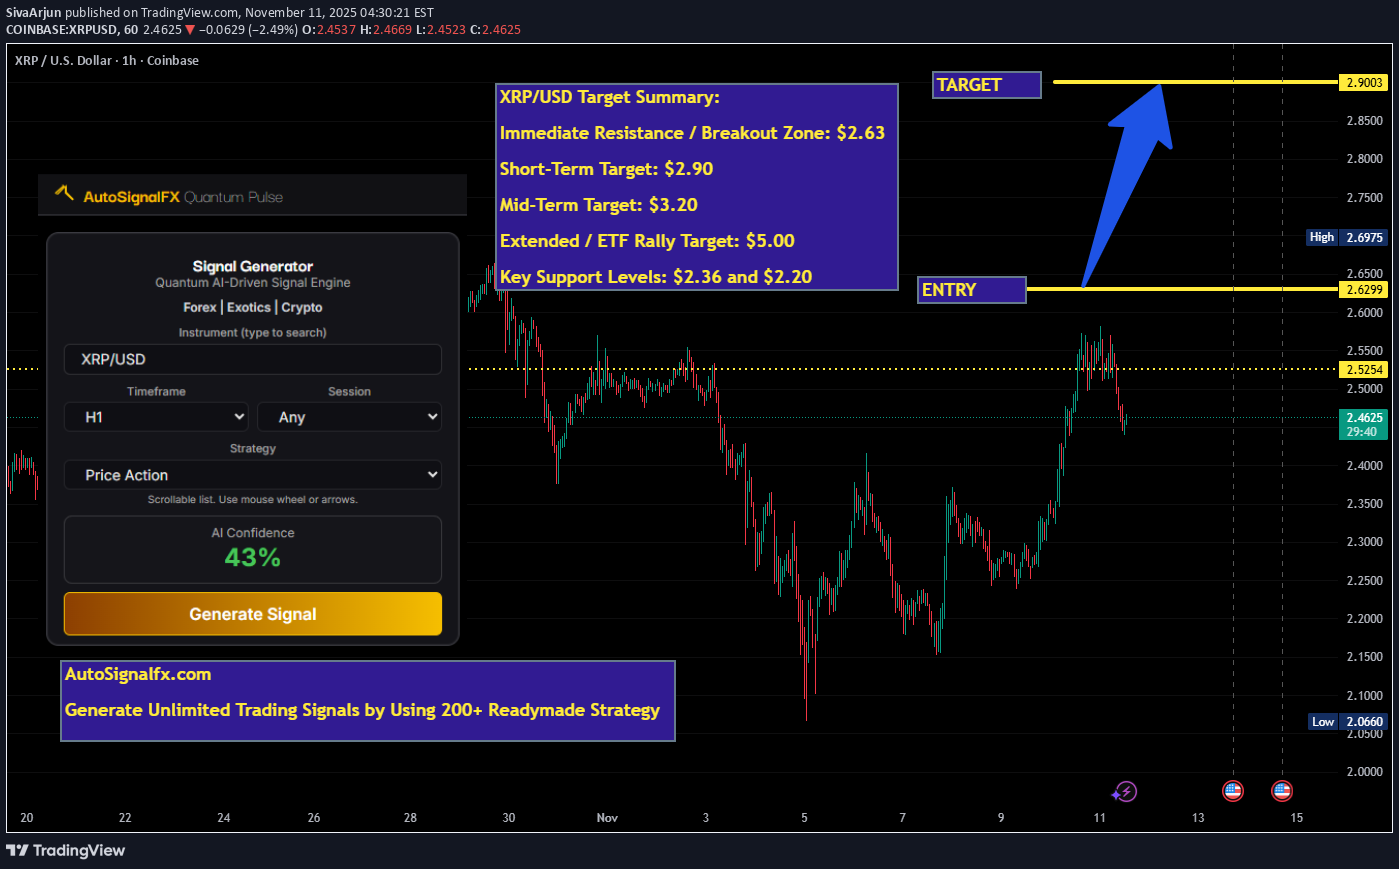
Market Overview: XRP is regaining center stage after a strong 12% intraday surge, trading within the $2.45–$2.55 range. The move comes amid renewed institutional accumulation and anticipation of four XRP spot ETFs from Bitwise, 21Shares, Canary Capital, and Franklin Templeton. These ETFs have now appeared on the DTCC platform, signaling trading readiness within weeks. Total market inflows could exceed $600–$800 million post-launch, positioning XRP for significant upside comparable to Bitcoin’s ETF surge in early 2024. Technical Structure: XRP is compressing between support at $2.20–$2.25 and resistance at $2.60–$2.63 (200-EMA). A confirmed breakout above $2.63 would open targets toward $2.90, $3.20, and $3.65 — the July high. Indicators are supportive: RSI at 46 shows headroom, OBV is rising, and on-chain data reveals consistent exchange outflows, signaling large-holder accumulation. On-Chain & Institutional Backdrop: Ledger activity and liquidity expansion remain robust — active addresses up to 29K daily, tokenized RWAs exceeding $364.9M, and Ripple’s ODL network now spanning 30+ corridors. Corporate developments such as the GTreasury acquisition and Evernorth SPAC plan further reinforce institutional adoption. Ripple’s disciplined escrow management ensures steady supply, while ETF approval probabilities under Section 8(a) increase confidence in near-term catalysts. Sentiment & Macro Context: Broader macro trends — easing inflation, a potential December Fed rate cut, and improved global liquidity — enhance risk appetite. Social and derivatives data confirm renewed interest, with open interest up 18% WoW and social volume up 34%. XRP’s volatility compression to 36% suggests a major breakout setup. TradingView Verdict: Bias: ✅ BUY (Bullish) Short-Term Support: $2.36 → $2.20 Breakout Confirmation: Above $2.63 (EMA-200) Upside Targets: Near-term: $2.90 – $3.20 Medium-term: $5.00+ (post-ETF inflow scenario) Summary: XRP remains one of the most asymmetric opportunities heading into 2026 — driven by ETF momentum, institutional liquidity growth, and strong ledger fundamentals. A decisive break above $2.63 could trigger the next expansion phase toward $3.20–$5.00.
مایکل سیلور باز هم بیت کوین خرید: ذخایر به ۶۴۱ هزار واحد رسید!
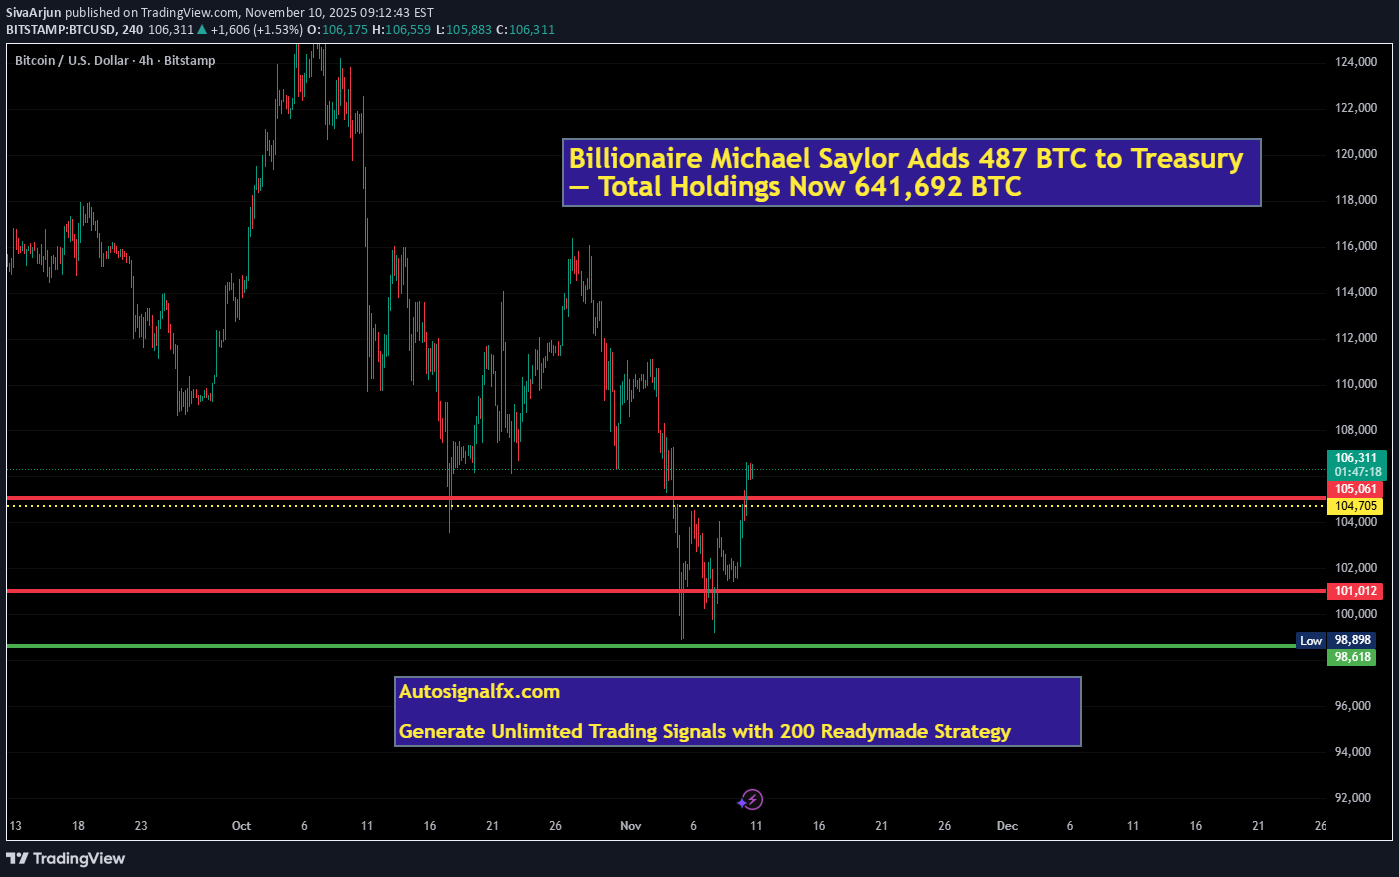
Billionaire Michael Saylor’s Bitcoin acquisition firm has expanded its holdings once again, purchasing 487 BTC for approximately $49.9 million between November 3 and November 9, 2025, at an average price of $102,557 per Bitcoin. This latest purchase brings the company’s total Bitcoin reserves to 641,692 BTC, acquired for about $47.54 billion at an average cost of $74,079 per BTC — representing a 26.1% BTC yield YTD 2025. The acquisition was financed through proceeds from preferred stock offerings (Series A: Strife, Stretch, Strike, and Stride) under its at-the-market program, avoiding dilution of common shareholders. Saylor’s firm remains the world’s largest corporate holder of Bitcoin, now valued at over $65 billion at current market prices. The company’s consistent, tranche-based accumulation strategy underscores its long-term conviction in Bitcoin as the premier digital asset for institutional capital preservation amid inflationary and monetary uncertainty. Summary Target: 📈 Bitcoin holdings: 641,692 BTC 💰 Total cost basis: ~$47.54B 🏷 Average cost: $74,079 per BTC 🎯 YTD BTC yield: +26.1% 🌐 Current valuation: >$65B Commentary: Saylor’s continued accumulation signals enduring institutional confidence in Bitcoin’s long-term potential, reinforcing its role as a cornerstone of digital asset treasury management. 📊 Market Sentiment Overview Michael Saylor’s continued large-scale purchases (487 BTC for $49.9 M) have added strong psychological support to the market. Such corporate accumulation typically boosts investor confidence, especially when it happens during volatility, signaling that major players view any dip below $100K as a buying opportunity. 🧭 Technical Outlook (as of Nov 10 2025) Immediate Support: $99,500 – $100,000 zone (key Fibonacci and psychological level) Major Resistance: $105,800 – $107,500 (last swing high and channel ceiling) Next Resistance Target: $113,000 – $115,000 (extension zone from breakout) Daily MA Trend: Price recovering above the 50-day MA; 200-day MA turning upward — bullish medium-term setup Momentum: RSI rebounding from 45 → 56, suggesting strengthening bullish momentum 📈 Short-Term Bias Bullish Above $100K — Saylor’s purchase acts as a “confidence floor.” A sustained close above $105K could trigger momentum traders to push toward $110K–$113K. ⚠️ Risk Scenario If $99,500 support fails, correction could extend toward $93,600 – $94,000 before fresh buyers step in. 🎯 Summary Target Primary Upside Target: $113,000 – $115,000 Secondary Target (mid-term): $120,000+ if momentum continues Support to Watch: $99,500 Traders View: Institutional accumulation (like Saylor’s) during uncertainty often precedes renewed uptrends. BTC/USD is showing signs of base-building above $100K, favoring a gradual bullish continuation toward $113K+ as long as the $99.5K support remains intact.
بیت کوین کان لمس کرد؟ خیز قدرتمند BTC به بالای ۱۰۶ هزار دلار و خبر مهم رگولاتوری!
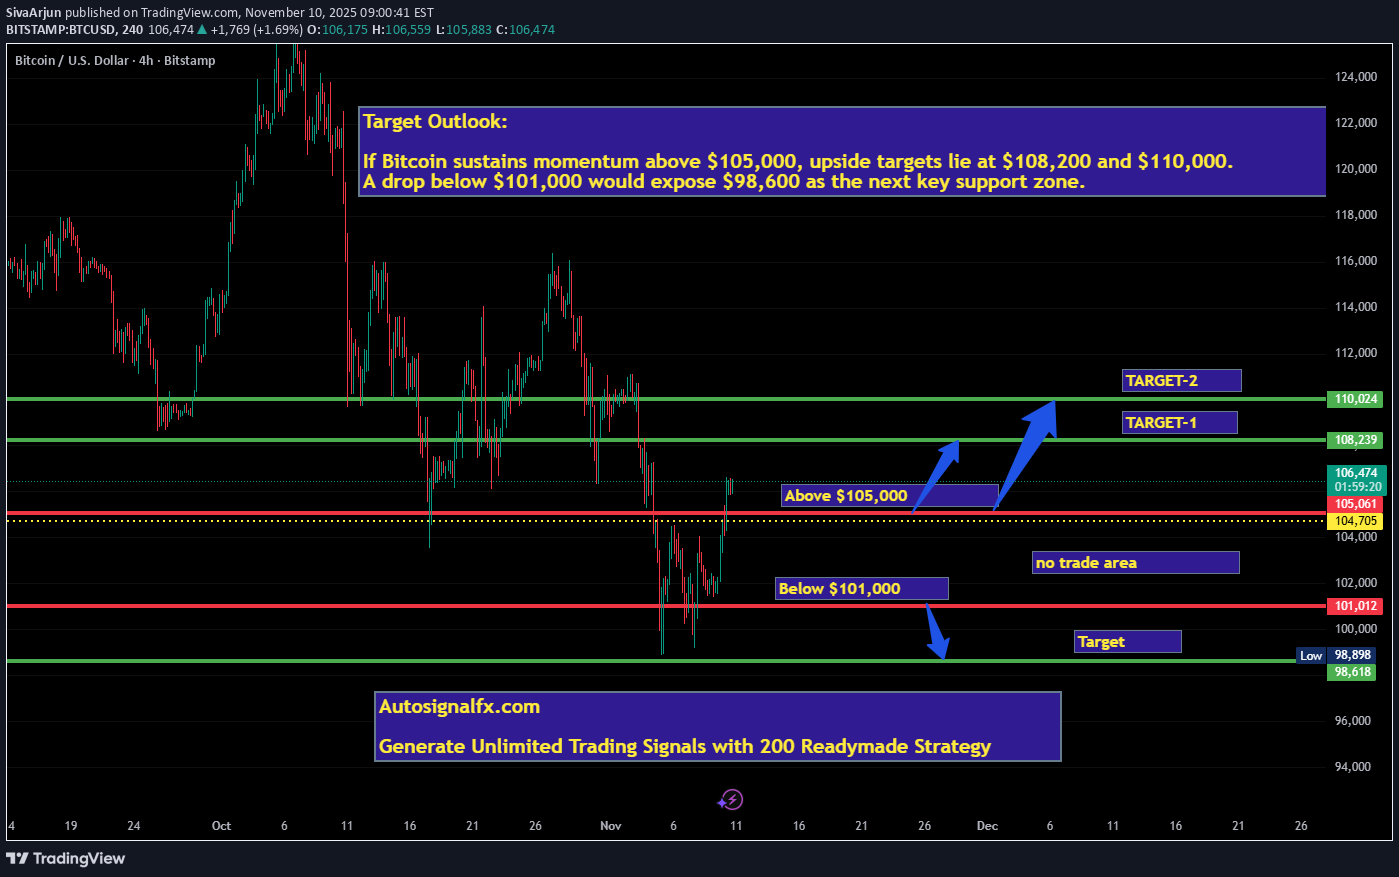
Bitcoin (BTCUSD) continues to hold firm above the $101,000 support, extending its recovery beyond $102,500 and $103,500, and reaching a session high near $106,593. This bullish rebound sparked a wave of short liquidations, with data showing higher derivatives volume as high-leverage traders faced pressure during the move. Meanwhile, CFTC Chair Caroline Pham signaled potential talks with exchanges to enable leveraged spot Bitcoin trading as early as next month — a development that could reshape U.S. crypto market dynamics. 🎯 Target Outlook: If Bitcoin sustains momentum above $105,000, upside targets lie at $108,200 and $110,000. A drop below $101,000 would expose $98,600 as the next key support zone.
جهش بزرگ بازار کریپتو: امید به محرکهای مالی، بیتکوین به کجا میرود؟
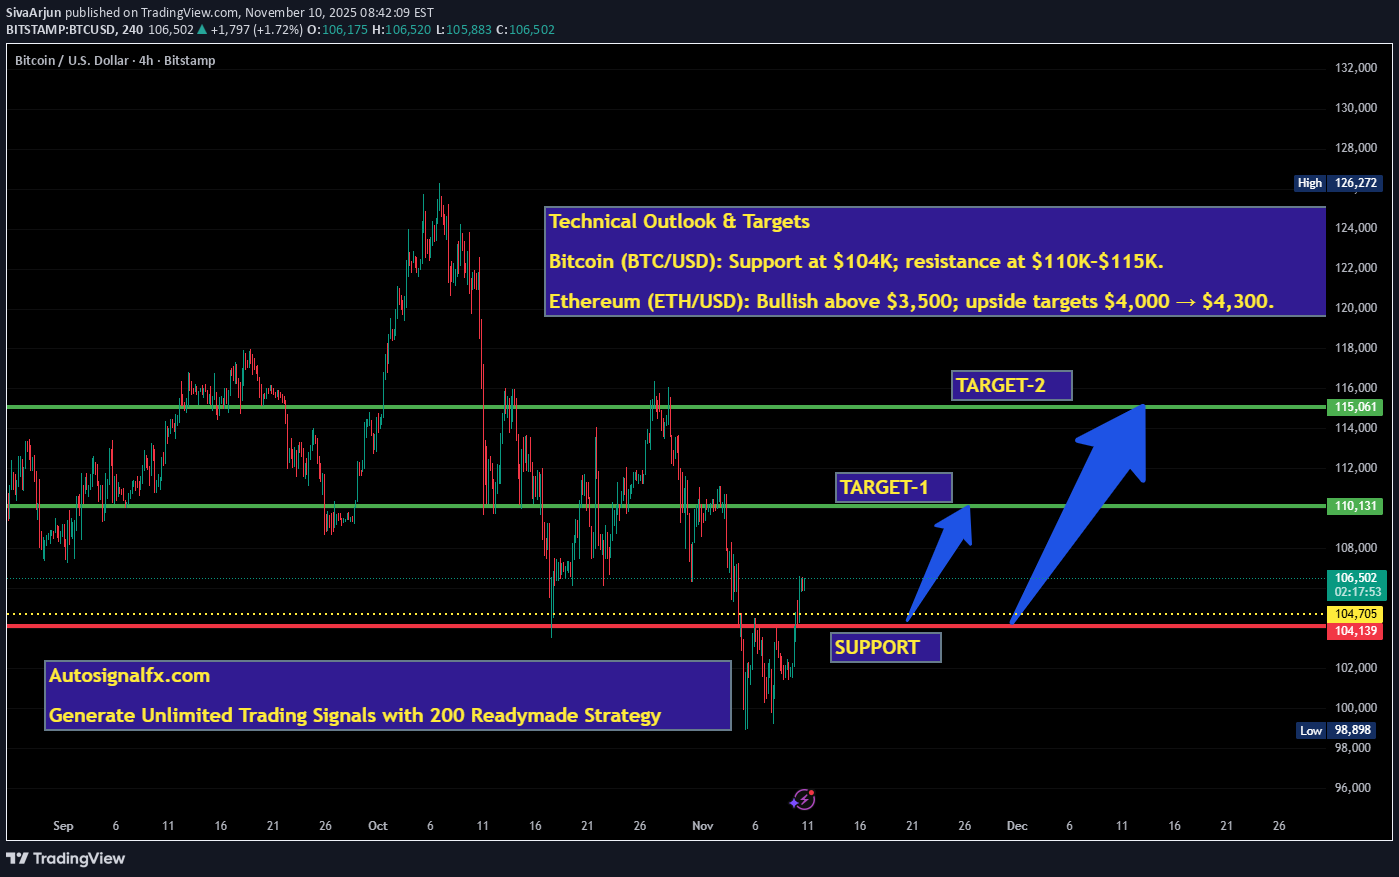
Crypto Market Rebounds on Shutdown Progress and Stimulus Hopes The cryptocurrency market surged 4.5% in the past 24 hours, fueled by optimism over a potential US government shutdown resolution and the president’s pledge to distribute $2,000 relief checks funded by tariff proceeds. The upbeat sentiment, combined with a recent 20% market correction, has triggered renewed buying interest among investors. Market Overview Bitcoin broke out of its $99K–$104K consolidation range, climbing above $106K, though it remains below both its 50-day and 200-day moving averages, where a potential death cross is forming — a sign of possible short-term pressure. In contrast, Ethereum (+5.8%) and XRP (+8%) outperformed, with ETH maintaining strength above its 200-day MA and aiming for the $4,000 target from its current level near $3,600. On-Chain and Institutional Insights After the early-October market drop, large holders reportedly sold 32,500 BTC, while retail investors bought the dip — historically a cautionary sign. Still, JPMorgan expects Bitcoin to climb toward $170,000 within 6–12 months, viewing the deleveraging phase as “largely complete.” Meanwhile, ARK Invest’s Cathie Wood adjusted her 2030 Bitcoin forecast from $1.5M to $1.2M, citing stablecoin adoption in emerging markets. According to AIMA and PwC, institutional participation continues to grow — 55% of hedge funds now hold crypto, up from 47% last year. Technical Outlook & Targets Bitcoin (BTC/USD): Support at $104K; resistance at $110K–$115K. Ethereum (ETH/USD): Bullish above $3,500; upside targets $4,000 → $4,300. 📊 Bias: Bullish short term; watch for confirmation above key moving averages.
طلا ۴۲۰۰ دلاری میشود؟ افزایش تقاضا برای پناهگاه امن در سایه ابهامات آمریکا
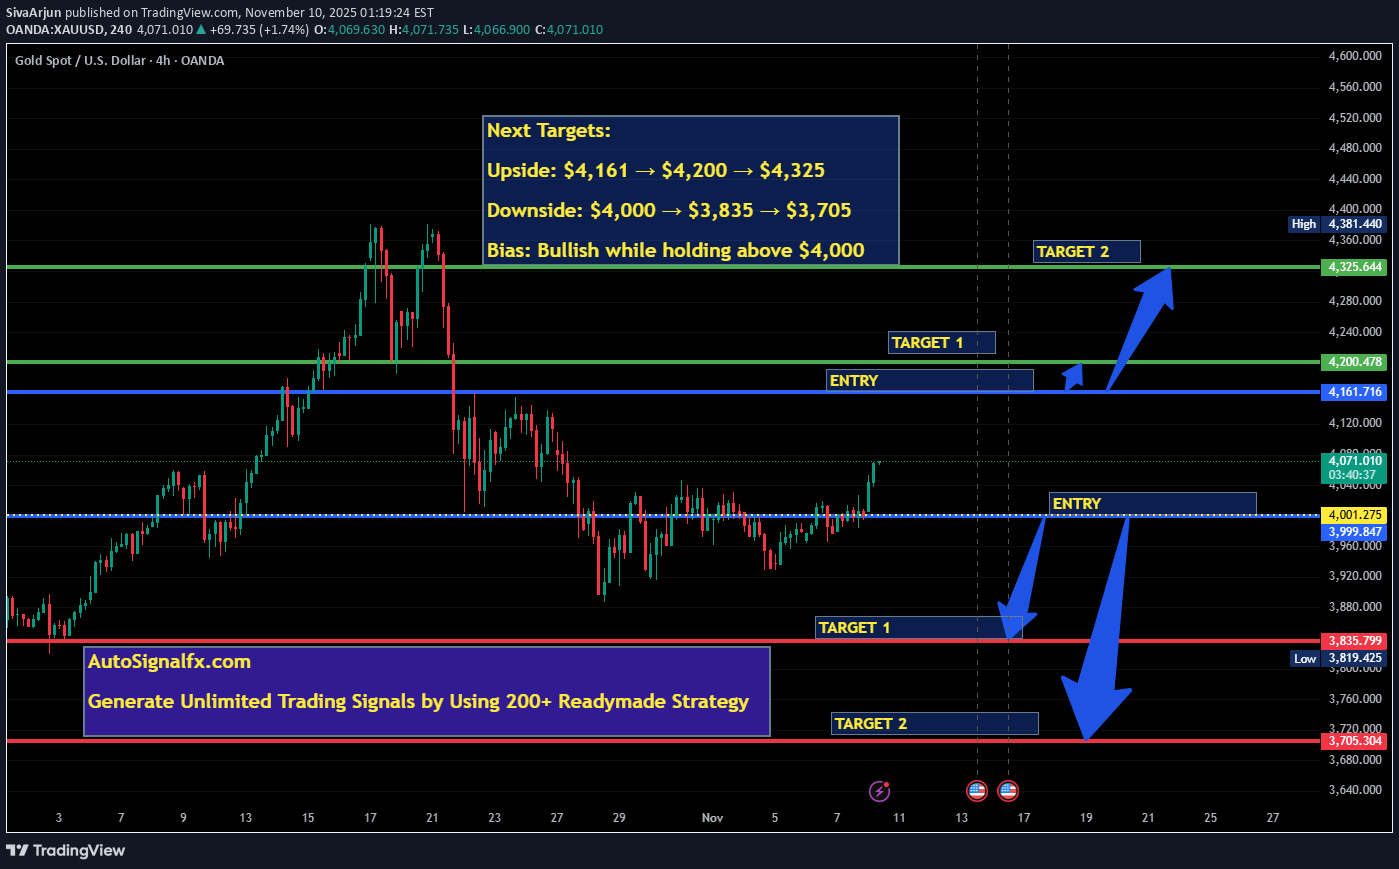
Gold (XAU/USD) Analysis: Upside Momentum Persists Above Key EMA, Eyes on CPI Data Gold prices edged higher in early European trading on Monday, climbing above $4,050 as renewed concerns over the US economic outlook fueled safe-haven demand. Weak private payroll data and a soft University of Michigan Consumer Sentiment Index have strengthened expectations for a December rate cut, lowering the opportunity cost of holding non-yielding assets like gold. However, optimism surrounding a possible US government shutdown resolution could partially cap gains. Lawmakers are reportedly close to a deal that would fund several government departments through January 30. Meanwhile, China’s temporary suspension of export controls on critical metals has eased global trade tensions, reducing some of gold’s safe-haven appeal. Investors now turn their focus to US CPI data on Thursday and Retail Sales figures on Friday, which could shape short-term rate expectations and influence gold’s next directional move. Technical Outlook Gold remains bullish above the 100-day EMA, with the RSI near 55, signaling steady upward momentum. A sustained move above the October 22 high of $4,161 could open the door toward the $4,200 psychological zone, followed by the upper Bollinger Band near $4,325. Conversely, failure to hold above $4,000 may trigger a correction toward the lower Bollinger Band at $3,835, and further down to the 100-day EMA near $3,705. 📈 Next Targets: Upside: $4,161 → $4,200 → $4,325 Downside: $4,000 → $3,835 → $3,705 Bias: Bullish while holding above $4,000
بیت کوین در مرز ۱۰۰ هزار دلار؛ آیا امید به صعود زیر مقاومت ۱۰۵ هزار دلار از بین رفته است؟
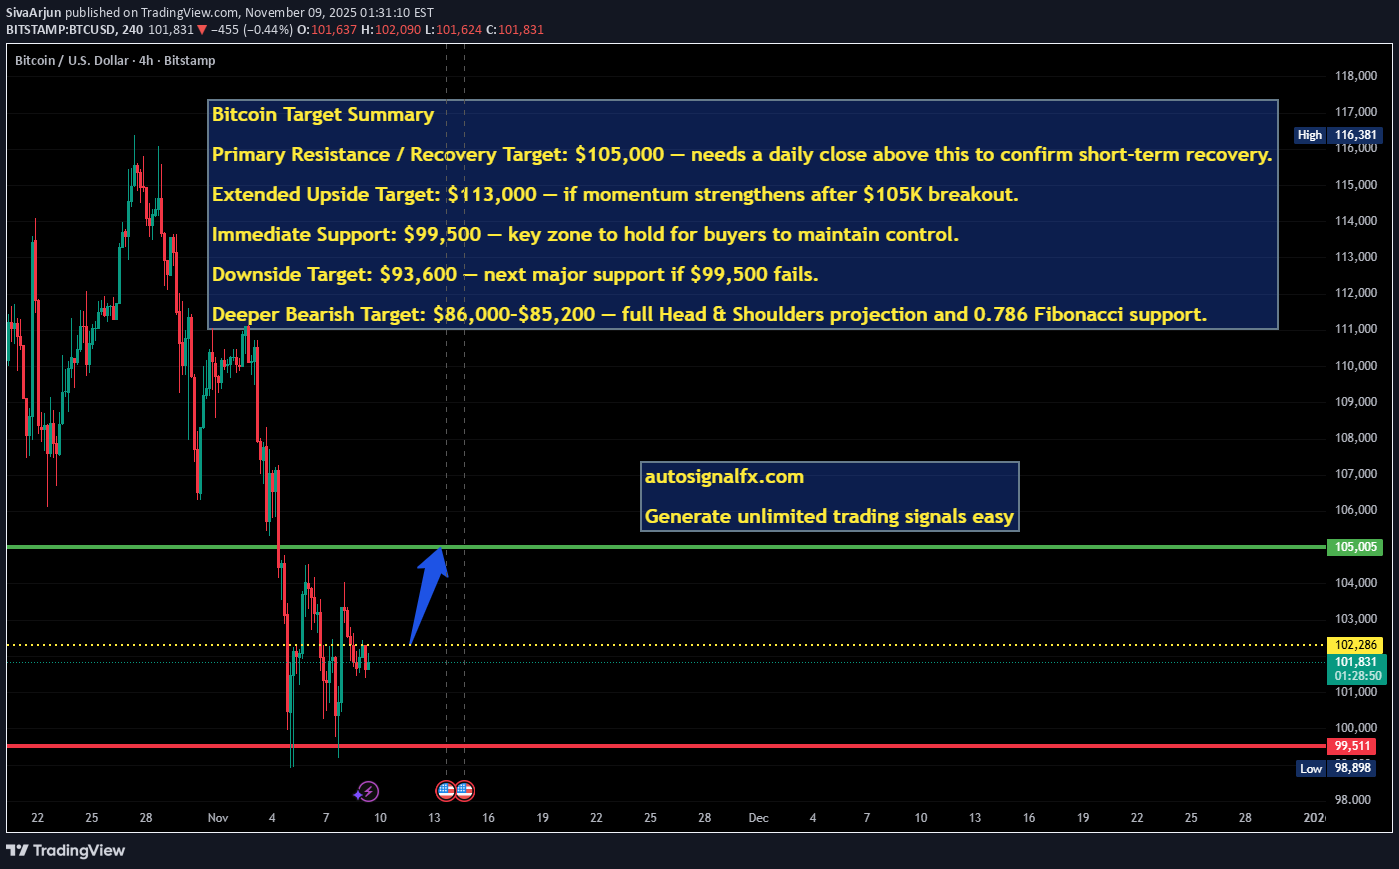
Bitcoin: Weak Volume Clouds Rebound Prospects After Testing Key $100K Support Bitcoin (BTC/USD) continues to trade within a critical decision zone, hovering near the $99,500–$100,000 support area. Despite briefly recovering from intraday lows, weak trading volume suggests that the recent rebounds may lack conviction. The cryptocurrency faces a pivotal test — holding above $99,500 could preserve recovery potential, while a breakdown below this level may invite deeper losses toward $93,600 or lower. Market Overview Bitcoin recently broke out of a multi-month descending channel, but the breakout proved short-lived as prices pulled back sharply to retest the $100,000 support zone. The move resulted in a weekly loss of nearly 8%, as cautious sentiment returned among traders and institutions. The area around $99,500 aligns closely with the 50% Fibonacci retracement of the April–October rally — a technically significant level that is now acting as immediate support. Buyers are attempting to defend this area, but muted market participation indicates that conviction remains low. Technical Outlook 1. Key Support and Resistance Zones Immediate Support: $99,500 – 50% Fibonacci retracement; crucial short-term floor. Next Support: $93,600 – 0.618 Fibonacci retracement; secondary support if $99,500 fails. Deeper Support: $86,000–$85,200 – major structural level and theoretical Head & Shoulders target. Immediate Resistance: $105,000 – short-term breakout confirmation level. Next Resistance: $113,000 – measured target upon successful bullish reversal. 2. Price Action and Patterns Recent chart behavior confirms the formation of a Head & Shoulders pattern, with the neckline around $105,500–$106,500. The breakdown below this zone validated a short-term downtrend, and the same area has now turned into formidable resistance. Unless Bitcoin decisively reclaims this neckline on a daily close, upward moves are expected to remain limited. Candlestick formations over recent sessions reveal narrow-bodied candles and declining volume, pointing to market indecision and weakening momentum on both sides. 3. Momentum Indicators The Stochastic RSI remains deeply oversold across daily and weekly timeframes, a condition that historically precedes potential bullish reversals. However, for a sustainable recovery, confirmation must come through price action — specifically, daily closes above $105,000 and a weekly close above $100,000 within the month. Macro Context Broader risk sentiment and macroeconomic developments continue to play a role in Bitcoin’s volatility. Uncertainty surrounding U.S. monetary policy and profit-taking near record highs have contributed to recent weakness. Meanwhile, institutional flows remain cautious as traders await stronger directional signals before re-entering the market. Outlook and Scenarios Bullish Scenario: A daily close above $105,000 would indicate renewed buying strength, opening the path toward $113,000. Sustained momentum above this level could reestablish the broader uptrend and signal renewed potential for fresh all-time highs into year-end. Bearish Scenario: A failure to hold above $99,500 would expose Bitcoin to the next support at $93,600, and potentially $86,000–$85,200 if selling accelerates. This aligns with both Fibonacci confluence and the measured move from the Head & Shoulders structure. Key Takeaways Market Bias: Bearish to neutral; cautious tone persists. Critical Support Zone: $99,500–$100,000 — must hold to avoid deeper correction. Upside Confirmation: Daily close above $105,000; stronger momentum above $113,000. Downside Targets: $93,600 initially, extending to $86,000 if weakness continues. Summary Bitcoin remains under pressure following a sharp retreat to the $100K support zone. While oversold signals hint at the possibility of a rebound, low trading volume and unresolved resistance near $105K suggest limited upside potential in the short term. The $99,500–$100,000 level is now the battle line — holding above it keeps recovery hopes alive, but a breakdown could open the door to deeper declines.
طلا در آستانه انفجار بزرگ: سکون موقت پیش از جهش بزرگ!
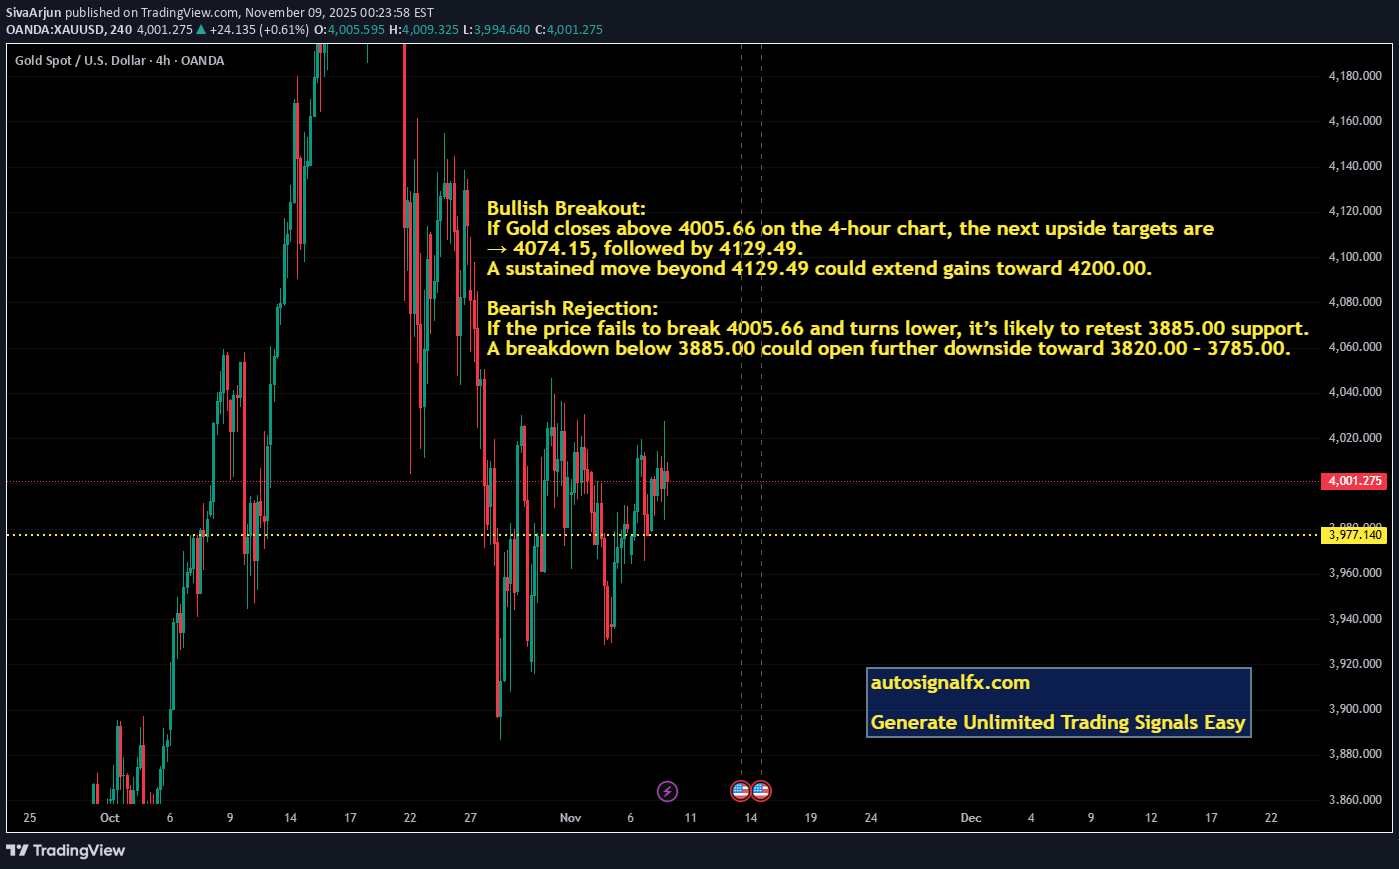
Gold remains in a consolidation phase, trading within a well-defined sideways range between the strong support zone at 3885.00 and the immediate key resistance at 4005.66. This price behavior reflects market indecision as traders await a clear catalyst to define the next major directional move. At present, momentum indicators suggest a balanced tug-of-war between buyers and sellers. The narrowing range and flattening of moving averages on the 4-hour chart indicate that volatility is compressing — often a precursor to a strong breakout. Bullish Scenario A decisive 4-hour candle close above 4005.66 would be viewed as a bullish breakout confirmation. Such a move could attract fresh buying interest, opening the path for an advance toward the next resistance targets at 4074.15 and 4129.49. Sustained momentum above this zone would likely shift the short-term sentiment in favor of buyers, potentially extending toward the 4200 region if market fundamentals align. Bearish Scenario Conversely, if price action fails to breach the 4005.66 resistance and faces rejection, it could reinforce the consolidation ceiling. In that case, gold may retrace back to retest the 3885.00 support zone, which remains the lower boundary of the current range. A break and close below this support would expose deeper downside potential, possibly dragging prices toward 3820.00–3785.00, where buyers might look to re-enter. Market Sentiment Overall, gold’s near-term direction will depend heavily on which side of this range gives way first. Traders should monitor for a clear breakout with volume confirmation, as false breakouts are common during low-volatility consolidation periods. Until then, range-bound strategies such as buying near support and selling near resistance remain valid for short-term traders.
سیگنال خرید بیت کوین: رسیدن به هدف ۱۰۰ هزار دلاری با قدرت MACD!
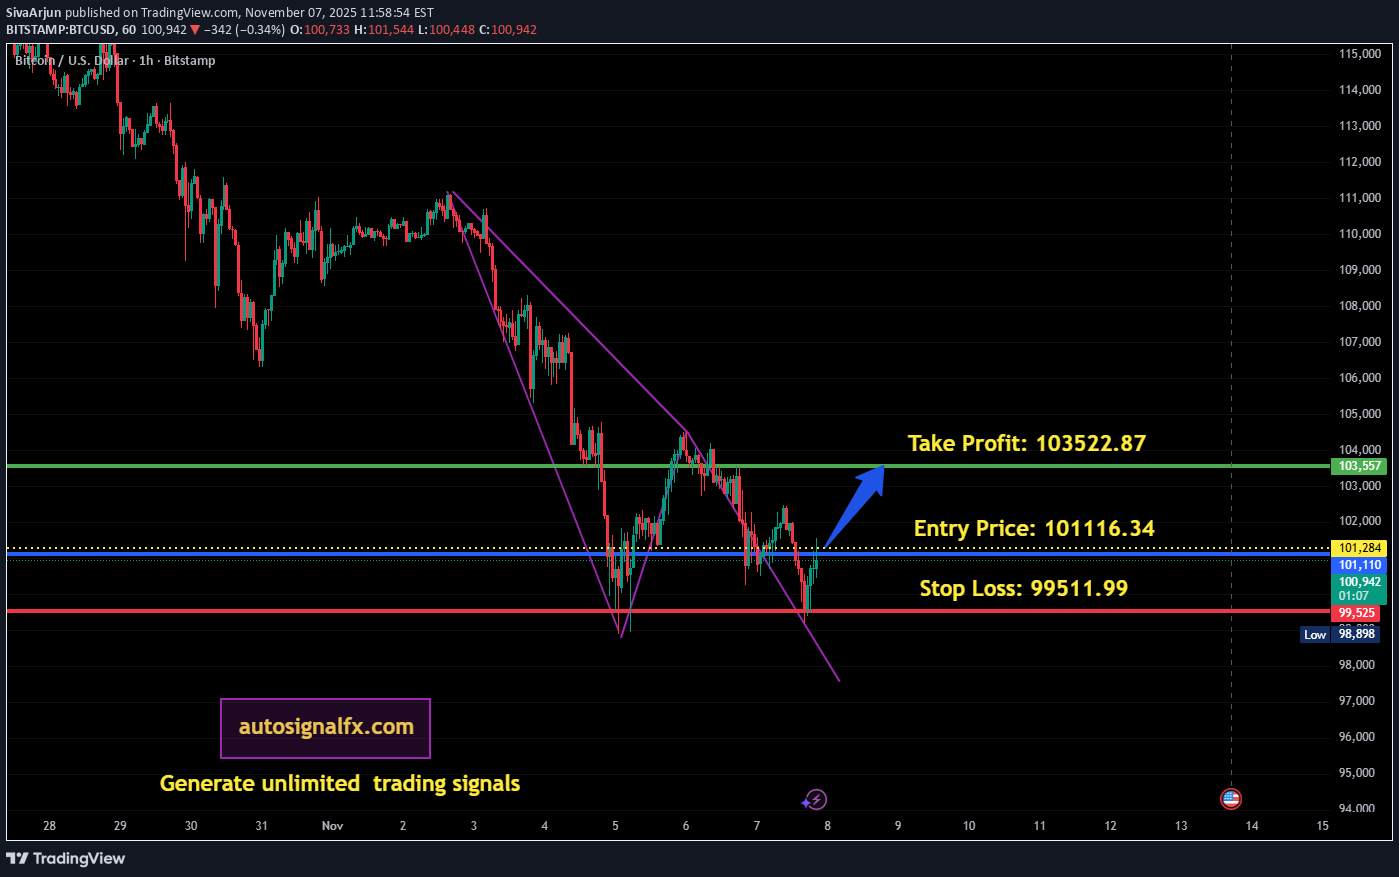
BTC/USD – MACD Momentum Long Setup Entry: 101,116.34 Stop Loss: 99,511.99 Take Profit: 103,522.87 Risk–Reward Ratio: 1 : 2.0 Technical Overview Bitcoin is showing renewed bullish momentum following a MACD bullish crossover on the 4-hour chart. The fast MACD line has crossed above the signal line, confirming a shift in market bias from consolidation to upside acceleration. This crossover occurred near the psychological 100,000 USD support region, suggesting buyers are regaining control after a corrective phase. Price has also reclaimed short-term EMAs, with increasing histogram bars on MACD signaling building momentum strength. If momentum holds, BTC/USD could extend toward the 103,500 USD resistance zone, where previous highs align with the next liquidity cluster. Key Confluences MACD Bullish Crossover: Fresh momentum signal following multi-session consolidation. Rising Histogram Bars: Momentum expansion supports continued upside. Support Retest: Bounce from 99,800 – 100,000 USD area confirms structural demand. Trend Alignment: Price now trading above both the 20 EMA and 50 EMA. Market Context: Broader trend remains bullish on higher timeframes. Trade Plan Entry: 101,116.34 – confirmation after MACD line crossover. Stop Loss: 99,511.99 – beneath psychological and structural support. Take Profit: 103,522.87 – targets prior resistance and momentum extension zone. Breakeven Rule: Move stop to entry once price reaches ~102,200 (+1R). Scaling Option: Partial profits may be secured near 102,800 if momentum pauses. Market Outlook Momentum indicators support continued bullish bias as long as BTC holds above 100,000 USD. Sustained MACD expansion with positive histogram values could trigger a move into the 103,500 – 104,000 region. A close back below 99,500 USD would invalidate the setup and signal momentum exhaustion. Summary Bias: Bullish Momentum Strategy: MACD Crossover / Momentum Expansion Reward Potential: ≈ 2R Market Context: Momentum shift from correction to trend continuation as bulls reclaim control near 100K support. #BTCUSD #BitcoinAnalysis #MACDMomentum #CryptoTrading #TechnicalAnalysis #BTCSetup #MomentumStrategy #PriceAction
Disclaimer
Any content and materials included in Sahmeto's website and official communication channels are a compilation of personal opinions and analyses and are not binding. They do not constitute any recommendation for buying, selling, entering or exiting the stock market and cryptocurrency market. Also, all news and analyses included in the website and channels are merely republished information from official and unofficial domestic and foreign sources, and it is obvious that users of the said content are responsible for following up and ensuring the authenticity and accuracy of the materials. Therefore, while disclaiming responsibility, it is declared that the responsibility for any decision-making, action, and potential profit and loss in the capital market and cryptocurrency market lies with the trader.