
Sir-Kameleon
@t_Sir-Kameleon

What symbols does the trader recommend buying?
Purchase History
پیام های تریدر
Filter
Signal Type

This should be quite interesting today. Personally I am looking for more upward movement. But the volatility factor is always present. OptionsEarningsFudElectionsIn the book " Trading in the zone." "If you think you should then you should." Trust your insticts,and take profits.Be well, be happy.Edit:Not the 233 SMA...... it is the 15 smaMy apologies.

There are some lower SMA targets in play if this 65,900 area does not hold.The Dollar is causing chaos in other markets like Japan and it is having real effects into cryptoThe US elections are coming up very soon and the big money is looking to make moves.Lots of volatility still to come with Fridays options expiring. Stay vigilant my friends.

There is a Batman, ( double top ), Head and shoulders pattern developing nicely on the 6 hr chart.I am looking for a further pull back to fill in the cape of batman or the arms of the head and shoulders.Not much stands in the way of the pull back once the 40 sma is defeated.Trade with a plan, Stick to the plan, Get a plan if you don't have one.

IF, BTC breaks and closes below the smaller circle, the trip down to the Low 60K area will a mine field.The bears are looking to feast if this happens.

I was going to talk about the 3hr and 9 hr chart collision in the blue box. Making note if BTC can hold this area a push higher is looking good. BTC had other ideas.So, at the time of creating this Idea 11 am eastern UTC4, The Circle is the area to keep an eye on .. it has 2 powerful convergences. This 1 hour chart has the support at the 200 / 233 SMA's.The green Flag is the area of the 40 sma on the 6 hr chart.If the fall continues there is not much below it too slow down into the 50k region.I was just a bit early with my previous thoughts of the pull back.Thought for the day: Trade with a plan and follow it or get a new plan.

I am starting to wonder if this is setting up the bulls for a nice ATH ( All Time High) chatter trap.We need a catalyst for the movement. The crypto world does not move like it used to prior to the ETF's and Mega Whales( Black Rock) playing in our sand box. So I feel we are in for a trap if you are banking on those ATH's.I hope I am right on the short side but wrong about the catalyst being bad.Trade smart trade with a plan.

I was looking forward to Coti showing some nice movement upwards on the 3 hr to get above the 200/233 sma.. It did not even come close to threatening its level. I am beyond disappointed Coti especially with BTC breaking out and giving some back but still showing higher highs.So back to the 12 chart and needing to get above the 0.382 fib and 40 sma to even threaten the 3 hr 200/233 levels.Well, I hope we get to take another shot at those levels . Keep vigilant my friends and trade with a plan.
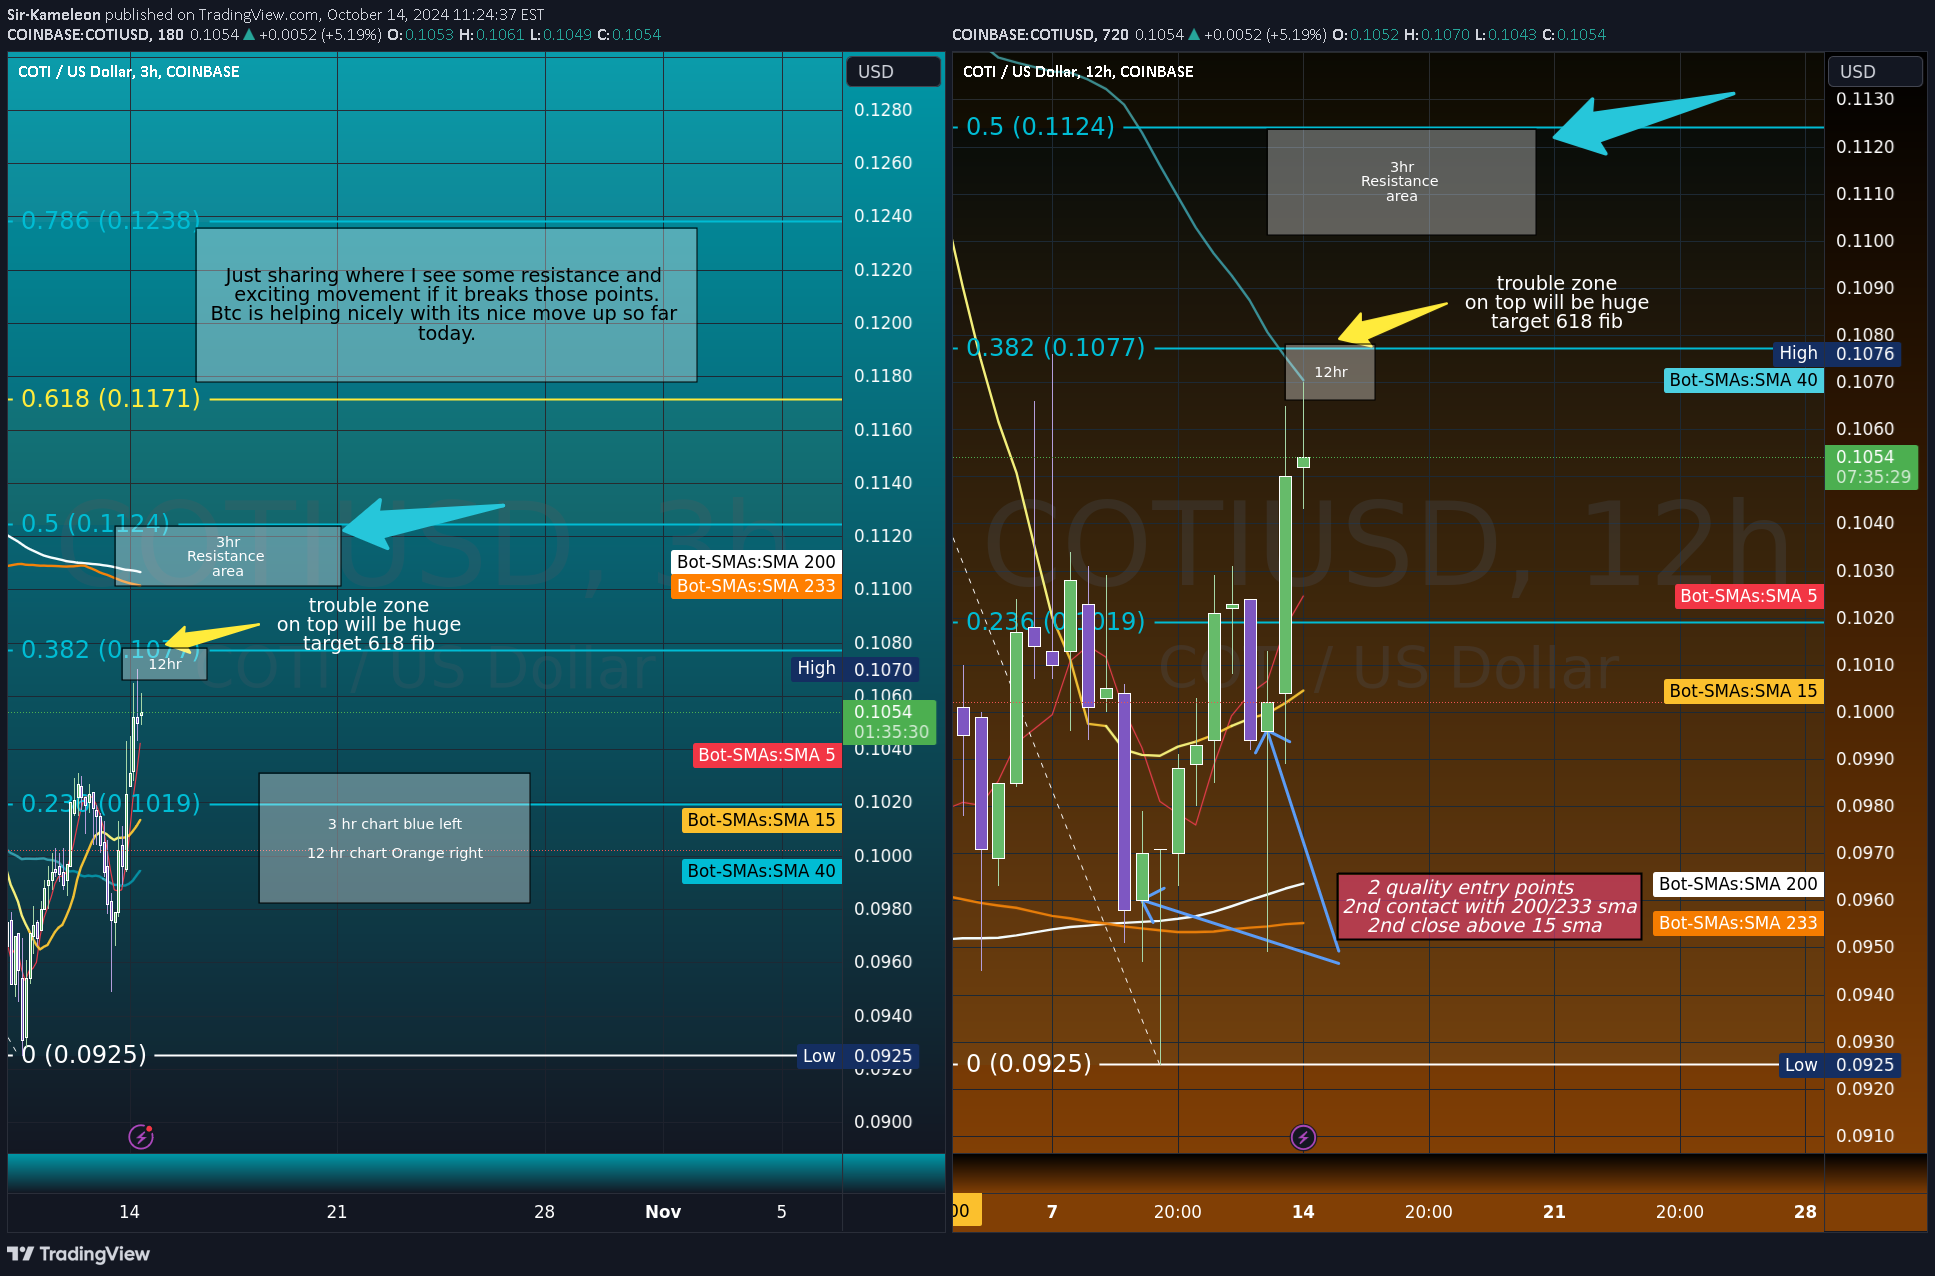
Just sharing where I see some resistance and exciting movement if it breaks those points.Btc is helping nicely with its nice move up so far today.Good luck and Happy trading

Just a simple SMA play for longs and shorts.Stick to your plan, and if you don't have a trading plan get one.I hope this helps.Happy trading.
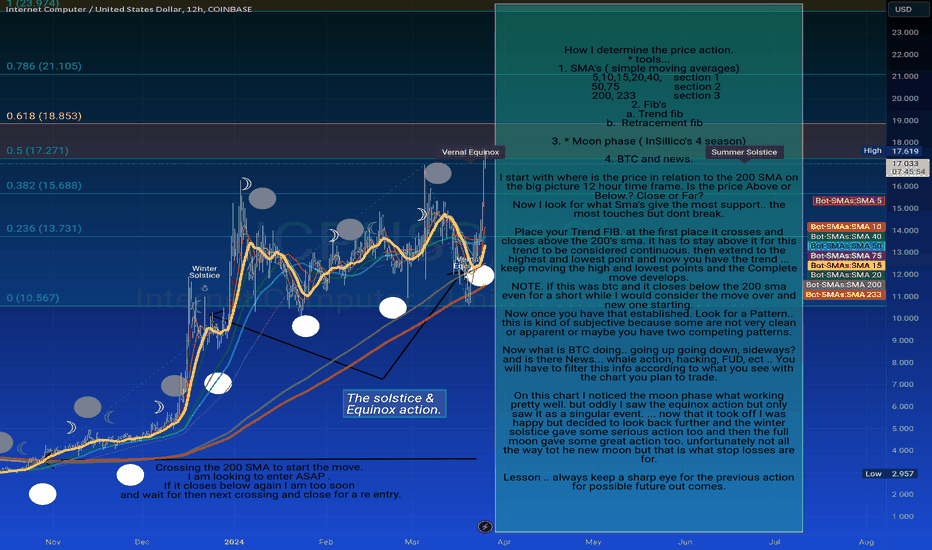
How I determine the price action.* tools...1. SMA's ( simple moving averages) 5,10,15,20,40, section 1 50,75 section 2 200, 233 section 32. Fib's a. Trend fib b. Retracement fib3. * Moon phase ( InSillico's 4 season)4. BTC and news.I start with where is the price in relation to the 200 SMA on the big picture 12 hour time frame. Is the price Above or Below.? Close or Far? Now I look for what Sma's give the most support.. the most touches but dont break.Place your Trend FIB. at the first place it crosses and closes above the 200's sma. it has to stay above it for this trend to be considered continuous. then extend to the highest and lowest point and now you have the trend ... keep moving the high and lowest points and the Complete move develops. NOTE. if this was btc and it closes below the 200 sma even for a short while I would consider the move over and new one starting.Now once you have that established. Look for a Pattern.. this is kind of subjective because some are not very clean or apparent or maybe you have two competing patterns.Now what is BTC doing.. going up going down, sideways? and is there News... whale action, hacking, FUD, ect .. You will have to filter this info according to what you see with the chart you plan to trade.On this chart I noticed the moon phase what working pretty well. but oddly I saw the equinox action but only saw it as a singular event. ... now that it took off I was happy but decided to look back further and the winter solstice gave some serious action too and then the full moon gave some great action too. unfortunately not all the way tot he new moon but that is what stop losses are for.Lesson .. always keep a sharp eye for the previous action for possible future out comes.
Disclaimer
Any content and materials included in Sahmeto's website and official communication channels are a compilation of personal opinions and analyses and are not binding. They do not constitute any recommendation for buying, selling, entering or exiting the stock market and cryptocurrency market. Also, all news and analyses included in the website and channels are merely republished information from official and unofficial domestic and foreign sources, and it is obvious that users of the said content are responsible for following up and ensuring the authenticity and accuracy of the materials. Therefore, while disclaiming responsibility, it is declared that the responsibility for any decision-making, action, and potential profit and loss in the capital market and cryptocurrency market lies with the trader.