
Sinex
@t_Sinex
What symbols does the trader recommend buying?
Purchase History
پیام های تریدر
Filter
Signal Type

Sinex
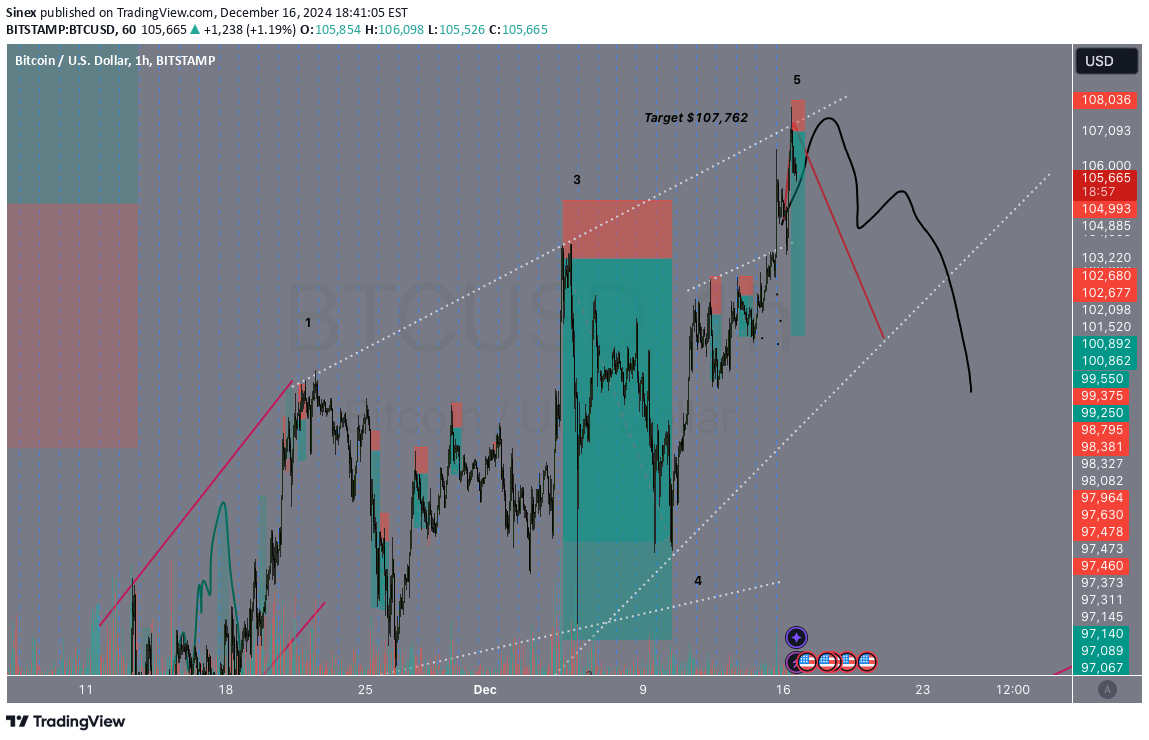
BTC A line of code that costs $107,000 American dollars. All I see is exuberance and the same jeering and laughing emojis when I mentioned TSLA was too expensive in other forums. The same mood. The same hubris. A line of code costs 107k. It was going to change the world, my coder friends said to me. It changed nothing, just a new "hype." And those come every 10 years or so. Good luck everyone.Moving along well. All the best.I am holding short. Remember every 10 years or so it is a "new it girl" and every time most think it will be different this time. I suspect BTC will not recover for a long time to come and possibly lose like in 1929 up to 89% of its value from109k (remember I posted a target of 107k off by 2k!!!) giving us a target of $11990 but this at this point, this is just speculation. All I know is I got this top right, where moon boys were calling for 200k 250k, 1mill. So insane!!! Going forward I suspect AI and Quantum computing will become the new "it girls" and the process will begin again!!! Good luck everyone.

Sinex
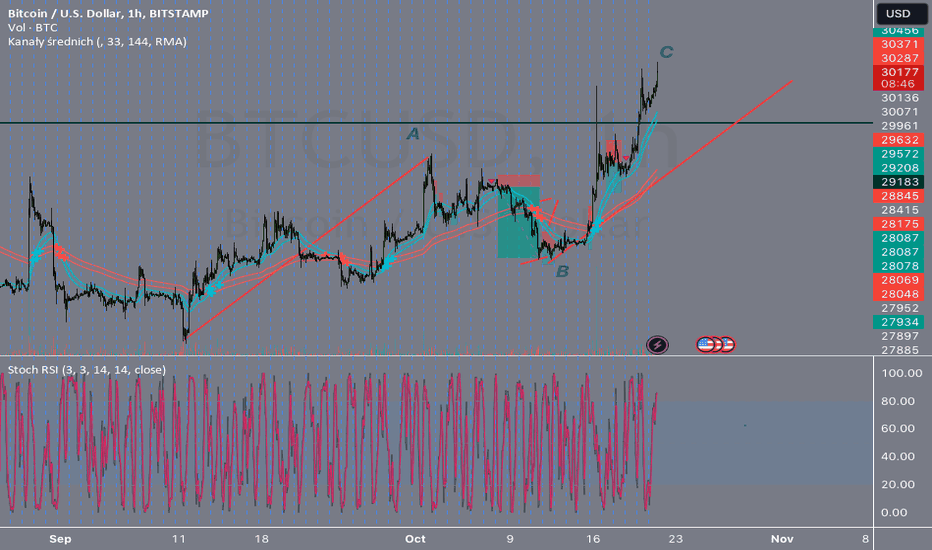
BTC Remains in what is likely an ABC corrective pattern. We know that corrective patters are difficult to trade for both bulls and bears and here we see the strong whiplash movements on the 1hr. We are at a finality of the pattern very likely. Caution is warranted on the bullish side. We should look for a strong move down for confirmation the pattern is finished. We also can expect a new lower low since early summer 23.' Good luck everyone.Moon boys are back, even though BTC has done nothing but go sideways for 4 months, they are calling for BTC 60k AGAIN! So crazy this society, so many fakes, so many scams. Do not fall for these scammers!. Notice my analysis is not all doom and gloom and when I see a bullish set up I chart it some times posting it here on TV. I did this at the onset of summer and correctly called for a BTC move up. I am a trader not a pumper, not a scammer, I don't care what markets do, I care about my analysis being right, not pumping.

Sinex
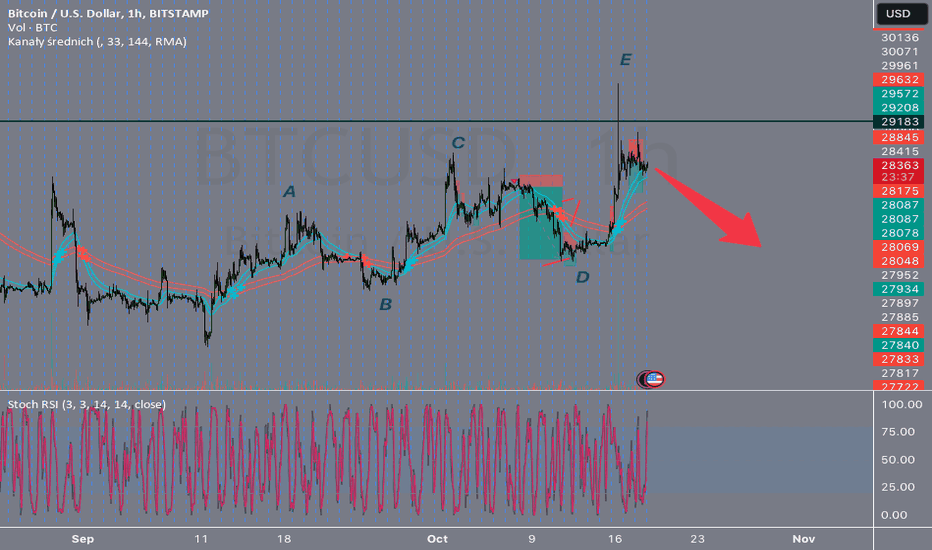
Though my first idea that BTC was in an ABC pattern was invalidated by a higher high, BTC remains in a corrective pattern and nothing that I see has changed my mind. We can then hypothesize that it is an ABCDE pattern, which as you can see for your selves it is ascending price action. It moves up at A only to turn sharply down to B, higher high at C only for the bulls to lose control in a descending price action to D, etc etc. E's long massive wick supports a corrective pattern. This is NOT a bullish chart, this is a clear example of what corrective price action looks like. Could I be wrong, of course. What would I need to see in order for me to change my mind? I need to see strong NON-ASCENDING, price action, with tiny pullbacks , the smaller the better, say a pullback of 4-6 hours long, followed by big green strong wickless candles. Until I see that then this remains corrective and we should see a STRONG move back down in a NON-DESCENDING price action. Good luck!

Sinex
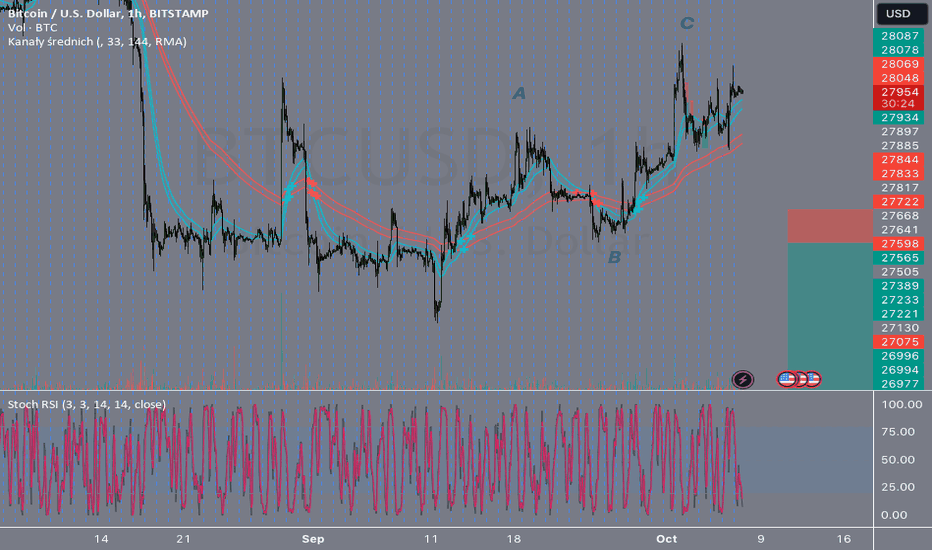
BTC remains in a corrective pattern that is now essentially compete. We can foresee new lows coming. We need a break of the bottom of wave A in order to confirm this pattern. Good luck.Remember when blockchain was going to change the world? Yeah me neither. Like all "new, 'it'" technologies or discoveries, they get old and the hype passes. I suspect crypto currencies will devalue up to 90%. This is just a guess right now but in looking at previous historical manias this has been the norm. Railways of the 1920s, tulips of the 1600s, Dotcoms of the 2000s, soon cryptocurrencies and eventually AI hype. ALL OF IT ENDS UP THE SAME WAY, replaced by something shinier that "will change the world" because "this time it's different" Good luck.Had I been wrong and painted a bullish picture or lied to you all then I would have had not 5 likes but 99 likes. But I don't lie and I am accurate. Check on my charts with some amazing predictions that I see NO ONE ELSE MAKING ON TV!!! Oh and FOR FREE!!! Because no one cares about being right or making money I stopped posting ALL MY CHARTS and I post one when ever I feel like it. GL!Well looking like the correct call. I expect a fight from the bulls soon enough. Can''t let their "world changing technology" to go with out a fight. I charted the Nasdaq EXACTLY Like this in September. Patterns repeat themselves because, well, people's hubris. And the Nas100 is fighting what is likely the enviable collapse. Because I don't make my charts public, you just have to take my word for it. It was SPOT ON ACCURACY!!!!There is the bounce I mentioned on the 11th Oct. Notice price action in an ascending move. Meaning it moves up, and quickly corrects moves up some more only to correct again,again and again. This is NOT a sign of bullish price action, this is a sign of WEAKNESS and soon will very likely move strongly down. Notice also how though price action trend down once I made the call, it wasn't a super strong move down, it too was slightly descending where it would fall strongly to correct back up a little, fall strongly again and correct. Meaning the bears are not in full control yet. I expect this to change and the bulls will very likely submit to selling in the coming weeks.Personal annotations, GT stands for Guerrilla Trading. Blue line part of GT style of trading, projection, drawn at the time of it's initial line start, resembles what happened in reality. Like I mentioned Oct 11, I expected this bounce. And I suspect soon enough will move down once again, this time with real emotion!Bulls, be-careful, your precious is on life support.

Sinex
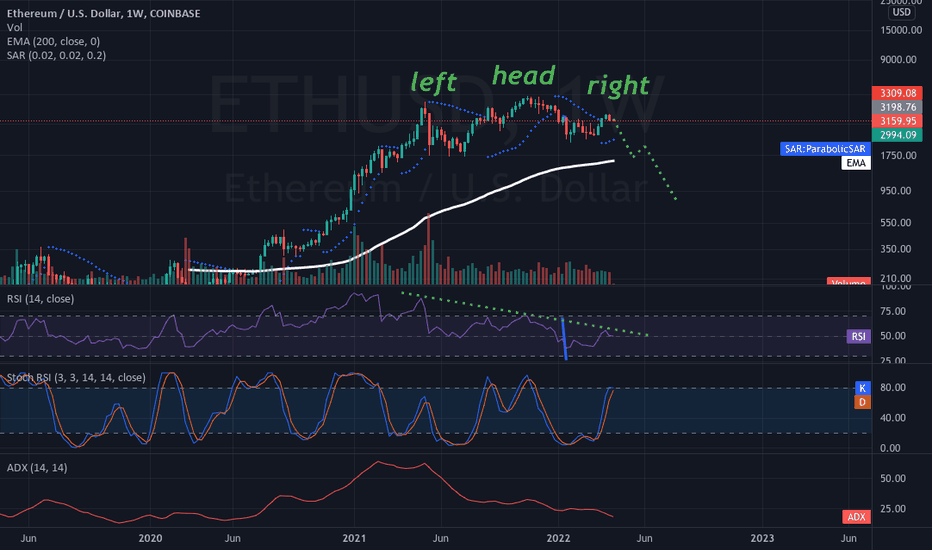
Ethereum Head and Shoulders Still. Possibility Most are bullish on cryptos again. Therefore we must be cautious as the HnS pattern could still be in play. Add extremely low volume and there is strong suspicion that this is an HnS pattern at play, which I mentioned way back in December.Comment: Just hold this nonsense short indefinitely. "BTC to 1.5 mllion" is what they said on the last bounce. It has been an eye opener for me thinking most analyst here would be of some competence. But the reality re-affirms the trading stats that most traders lose. We are likely headed towards some even darker times. Be kind to one another.Comment: 10 days in to this analysis and we are correct on this hypothesis.Comment: Been checking 10 days ago, who got this right. Not many.Comment: Charts don't have to be complex with dozens of oscillators. I really use two. Stochastics and RSI, they both give powerful data and when combined they make up for each-other's weaknesses. Sometimes RSI will show negative divergence while Stochastics worn't and then sometimes its the reverse of that. I've been doing this for so long now that simply looking at price action will show me what the likeliest outcome will be. But simplicity is key. What ever you do do not fall for complexity over correct analysis. And go with what you see not what you want to see which is the majority of the chartists here on tradingview. Maybe no one reads these things but for those that do and the ones that identify this as a skill set you want to acquire for yourself, simple rules, simple and immediate clear ideas where the chart does the 100% talking and you do only the 100% of the listening. It should be immediately evident to you. Maybe there is an alternative to your main hypothesis but not 1000 others with 1000 other lines and 12 oscillators blurring the big and immediate picture. Again and again I have demonstrated you can successfully predict the near term future or at least the likeliest outcome. I wish everyone well.Comment: This chart is playing out beautifully, and remains as relevant as when I first posted it. Amazing. Simply amazing. Simplicity over complexity. Why draw hundreds of support lines when we don't know where it will stop? Why even bother if the "support" lines just get broken over and over again? If you are an Elliott guy gal then you would recognize that the "left" shoulder is the beginning of the 5 wave pattern. I am not an Elliott guy because, once again, it adds complexity to something that IMO demands supreme simplicity. Thanks for your attentionComment: Well, this played out how I expected. Now we will see if it can start a new bullish trend.Comment: This chart remains relevant. Notice that ETH has gone nowhere as many hope it would break in to a new bull market. Although a few indexes have made higher highs the idea that American (leaders) indexes have not confirmed Nikkei or Dax is a discrepancy that we must take in to account. The chart on the riskiest of investments (crypto) does not look good. This is not a bullish chart at this point. I suspect this moves to new lower lows AND this craze of crypto will die as the new AI craze unfolds probably within a long lasting bear market. Notice that I have not just been bearish and my other public charts signalled accurately bounces in a few assets. I have been right, I have timed correctly weekly moves. I say this with some backing, we likely enter a long lasting bear market soon

Sinex
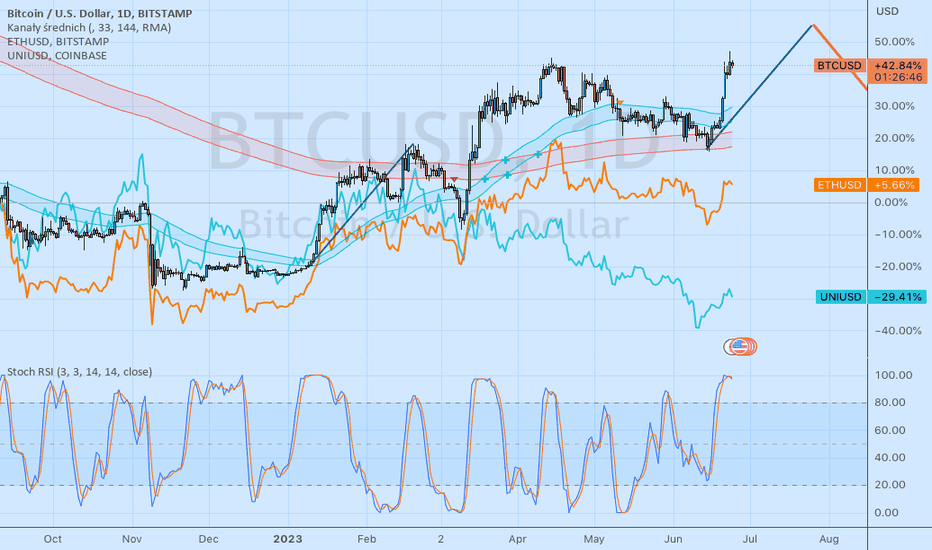
The comparison between leading crypto coins shows a huge discrepancy between them in terms of making new higher highs. As we can see (and though TradingView comparison is a bit wonky) other cryptos did not make new higher highs. Only BTC made higher highs. UNI is headed to make lower lows by the look of things. This is not bullish according to Dow theory. We needed cryptos to confirm BTC's higher high. Caution is warranted, at the very least."I keep pitchin' em and you keep missin' em boy!" Fog Horn Leg Horn. One like. The rest are waiting for BTC to reach 1million again. Good luck. Divestments at are the second lowest level since....the great depression. But hey whatever. Go buy AI since it's the new "it girl" or what ever you people are in to these days. My only mistake was thinking the Ukrainian Russian war would come to a close. It should ESCALATE BIG TIME!One guy posted some Elliott "mirage" "BTC to 100k". 90+ likes! Oh my stars!Who cared about non-confirmation? Three people. Good luck with that.186 views and three likes. Sounds about right. Remember when I mentioned crypto non confirmation a while back, and it is still super relevant and nobody cared? Yeah me too.I guess now non-confirmation matters. Oh well.

Sinex
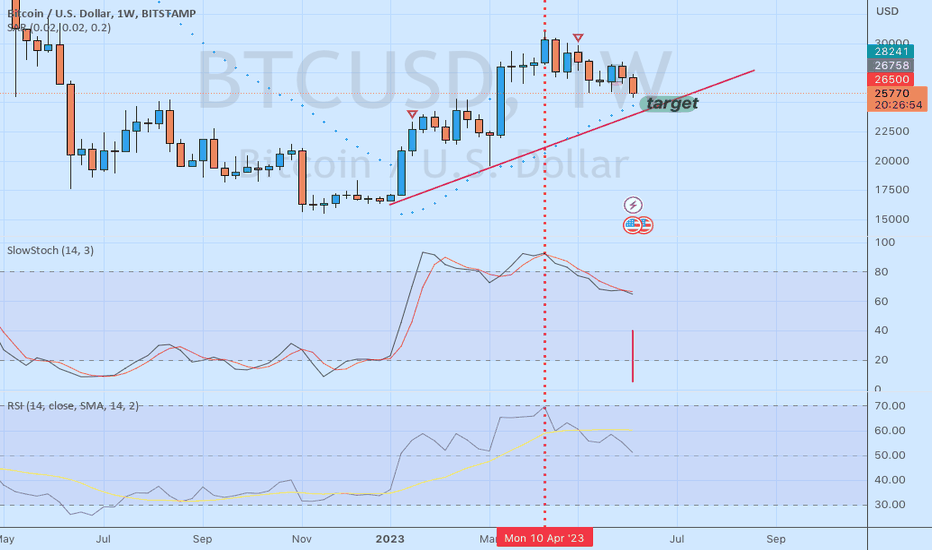
BTCUSD Trend Support BTCUSD Trend support approximately at 24400 or so. If that line is crossed we may be in a large corrective ABC pattern and we can see new lower lows as BTC would resume the larger trend down. For now we can expect a bounce at the trend line drawn.

Sinex
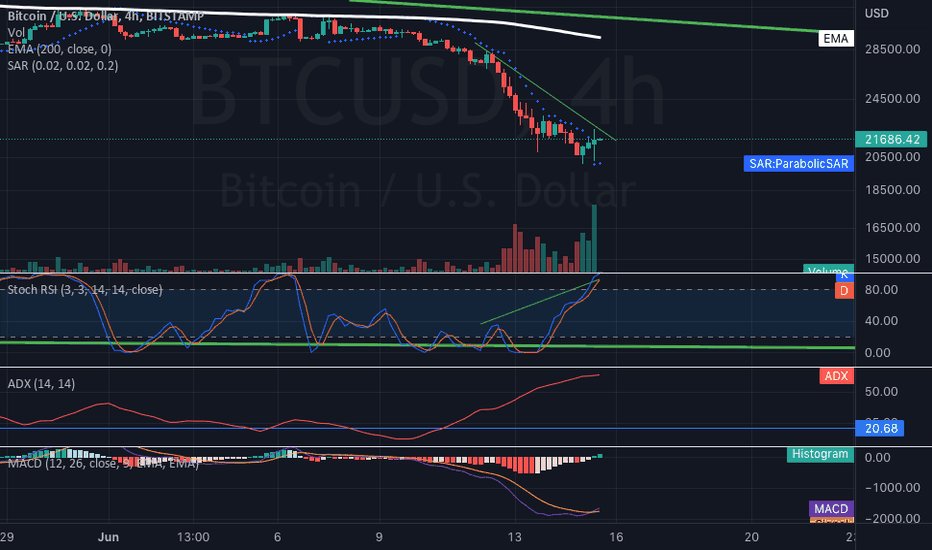
Bulls thinking "wow! what a discount". But this is just more of the same and bulls haven't learned a thing.Hidden bearish divergence suggests this will continue to fall.If you are new to my style of trading I mostly use an oscillator method based on the 1hr and 4hr systems. My system is great and very accurate. Here I am waiting for the 4hr Stochastic RSI to turn down below 80% and that will signal a sell. My stop is usually around 20 pips give or take a few pips. My risk is a tight 1% and sometimes less if the stops are higher than 20pips. If I am stopped out, no big deal, I have only lost 1%. A 1% loss is manageable and will be an easy pill to swallow if we are wrong. This is easy on emotion and you can even sleep with a position on. Any bigger risk than that is NOT advisable. Good luck.

Sinex
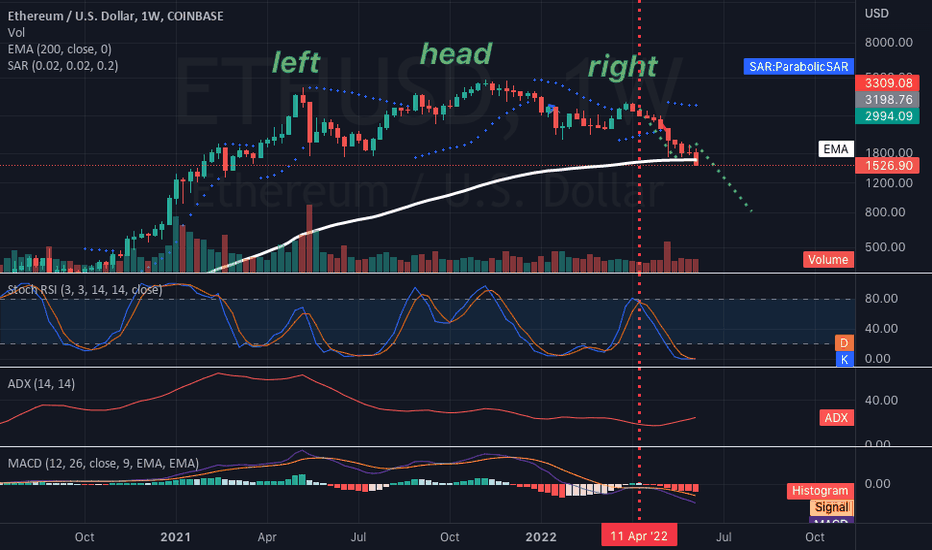
I suppose I expected a different group of chartists here on TradingView, but what I found was mostly biased bulls with little to no humility, and since they had been right since 2011 "they" were guaranteed future rewards. After all they called BTC a money making machine. But when times get tough, tough times tends to shed light on those who can remain objective and humble, because YOU NEED TO BE HUMBLE to win at this game. You must make alternativeplans if you are wrong. At the time I called a HnS pattern for most assets the crypto gurus were calling for 100k bitcoineven 1million btc. The beauty about Tradingview is if they posted these analysis then we have their history. I commented on a few as nicely as I could as a 100k btc prediction is not something I can just overlook. Some responded with "well they said the same thing when btc was 25k, and we shall see" well I did not nor was I part of the "they".and we did see. I just happen tp see it right away at the very top and the right shoulder. Not only were the majority wrong and sooo wrong on cryptosbut many charge fees for being wrong. That is ridiculous. I hope if anything anyone can learn from my posts is do not trust most analysts here on Tradingview nor anywhere else. Learn for yourselves how to chart and how to accurately predict trades. Because everyone else just wants to take your money away from you, period. Good luck trading!

Sinex
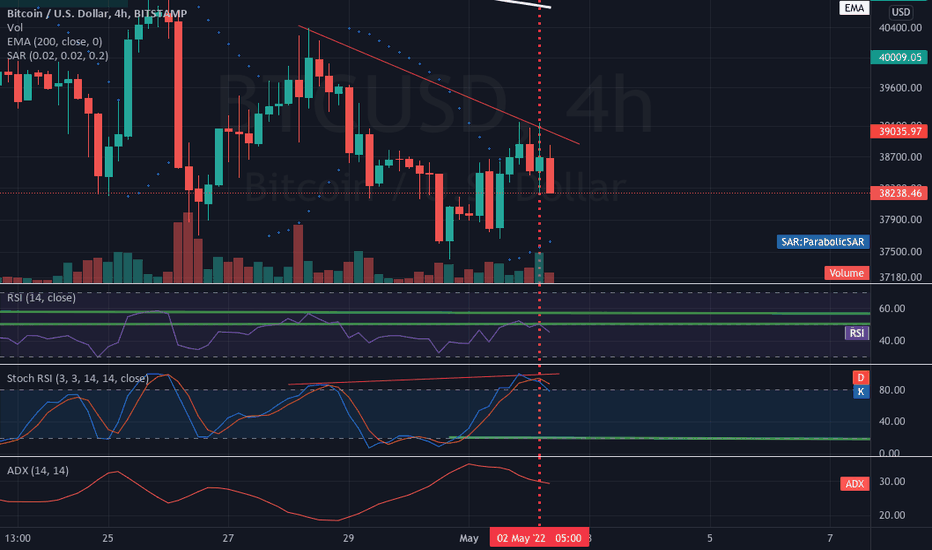
This likely falls to new lows. This support will be broken shortly.Well the technicals are there. The fact that markets have no direction at the moment suggests this might not make a lower low. Therefore I can not be certain this will move much farther down if it does not soon.Great call Sinex! Thanks! (I'm just talking to myself here).
Disclaimer
Any content and materials included in Sahmeto's website and official communication channels are a compilation of personal opinions and analyses and are not binding. They do not constitute any recommendation for buying, selling, entering or exiting the stock market and cryptocurrency market. Also, all news and analyses included in the website and channels are merely republished information from official and unofficial domestic and foreign sources, and it is obvious that users of the said content are responsible for following up and ensuring the authenticity and accuracy of the materials. Therefore, while disclaiming responsibility, it is declared that the responsibility for any decision-making, action, and potential profit and loss in the capital market and cryptocurrency market lies with the trader.