
SeoVereign
@t_SeoVereign

What symbols does the trader recommend buying?
Purchase History
پیام های تریدر
Filter
SeoVereign
[SeoVereign] BITCOIN BULLISH Outlook – December 09, 2025
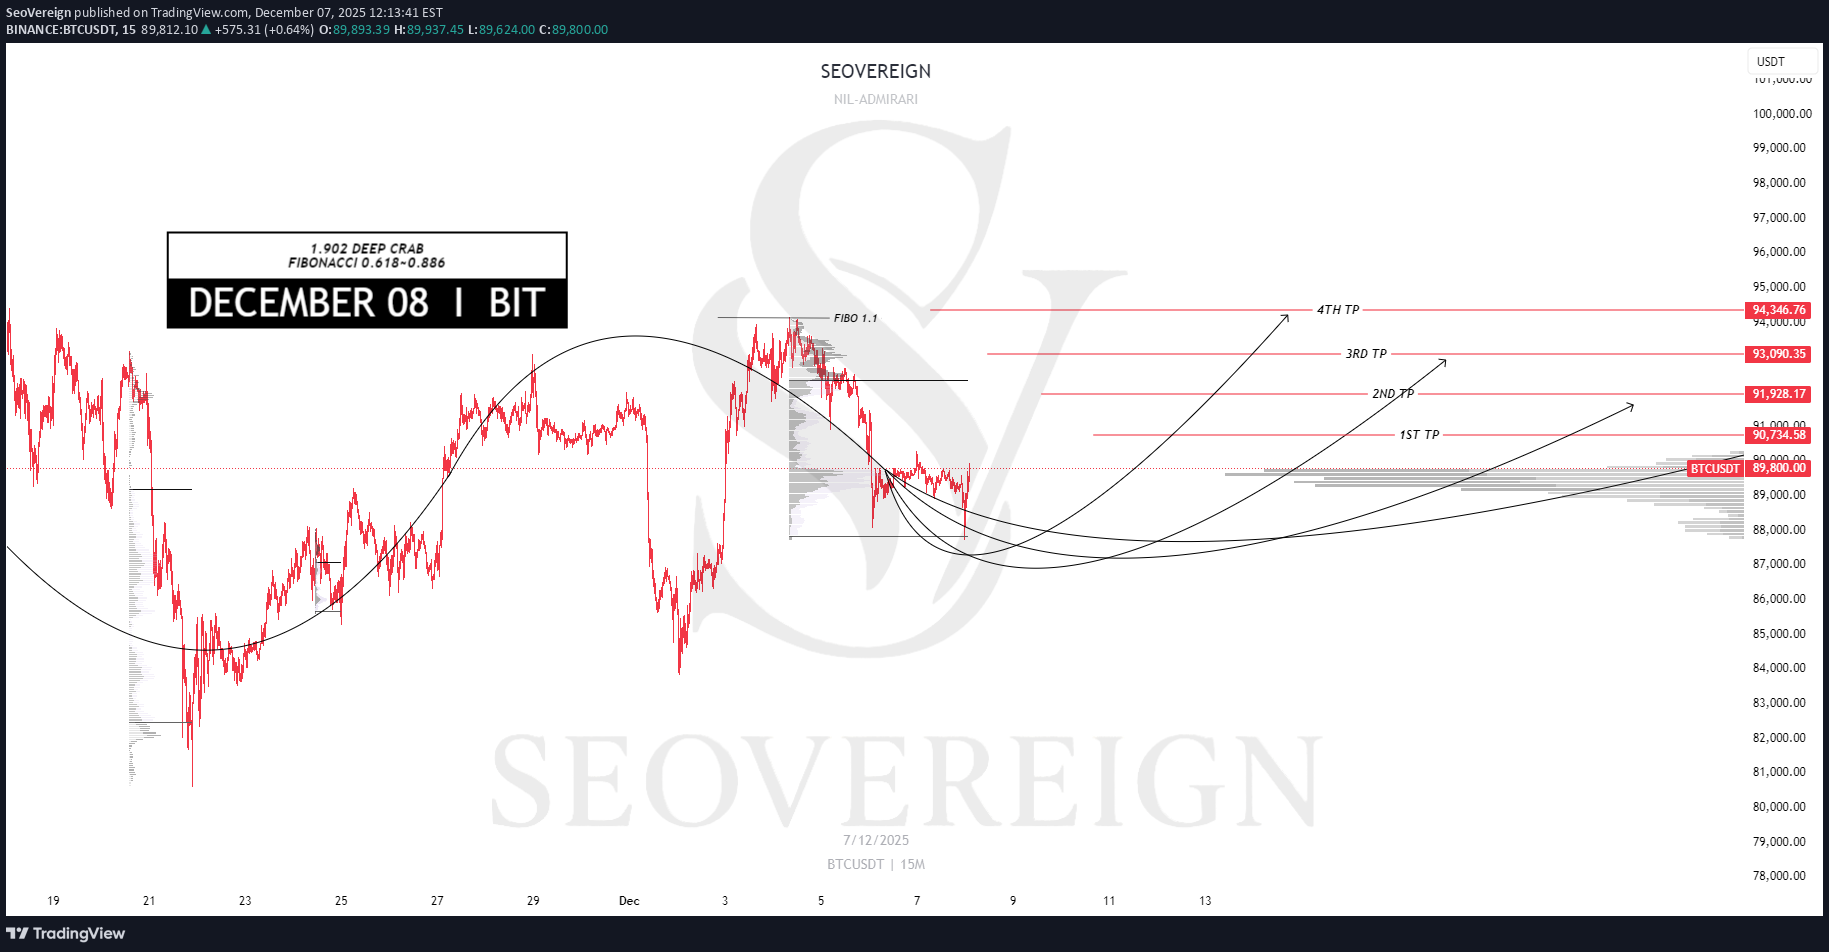
As of December 9, I would like to share Bitcoin’s bullish scenario. Below are the main factors supporting the current rebound. - Detailed Technical Basis 1) Reaching the completion zone of the 1.902 DEEP CRAB pattern In the Deep Crab pattern, the 1.618 or 1.902 levels are considered reversal zones, and when the BC extension and XA ratio converge simultaneously, a strong retracement structure is formed. This aligns with the typical pattern conditions in which the market attempts a meaningful rebound. 2) Overlap of key Fibonacci 0.618 ~ 0.886 retracement zones The 0.618 ~ 0.886 levels, which serve as the basis for the mid-term trend, are currently overlapping near the price, forming a strong buy-side defense zone. This area has acted as a pivot for directional reversals multiple times in the past, and it now carries sufficient probabilistic context for a similar reaction to occur again. 3) Detection of initial signals of market structure shift Even as the price continues to decline, bearish momentum is slowing, and a classic absorption pattern seen in oversold conditions is appearing in the volume structure. This is not yet a confirmed reversal signal but can be interpreted as an early movement preparing for a rebound. - Strategy and Target Based on these factors, I have set the average target zone for this rebound at 92,450 USDT. If upward movement unfolds, I will reassess whether to continue holding at that level. I plan to gradually increase long positions based on the technical conditions described above. Further updates to position management will follow depending on market movement and indicator changes. Thank you for reading.
SeoVereign
پیشبینی بیت کوین: چرا سقوط ادامه دارد؟ (تحلیل 27 نوامبر)
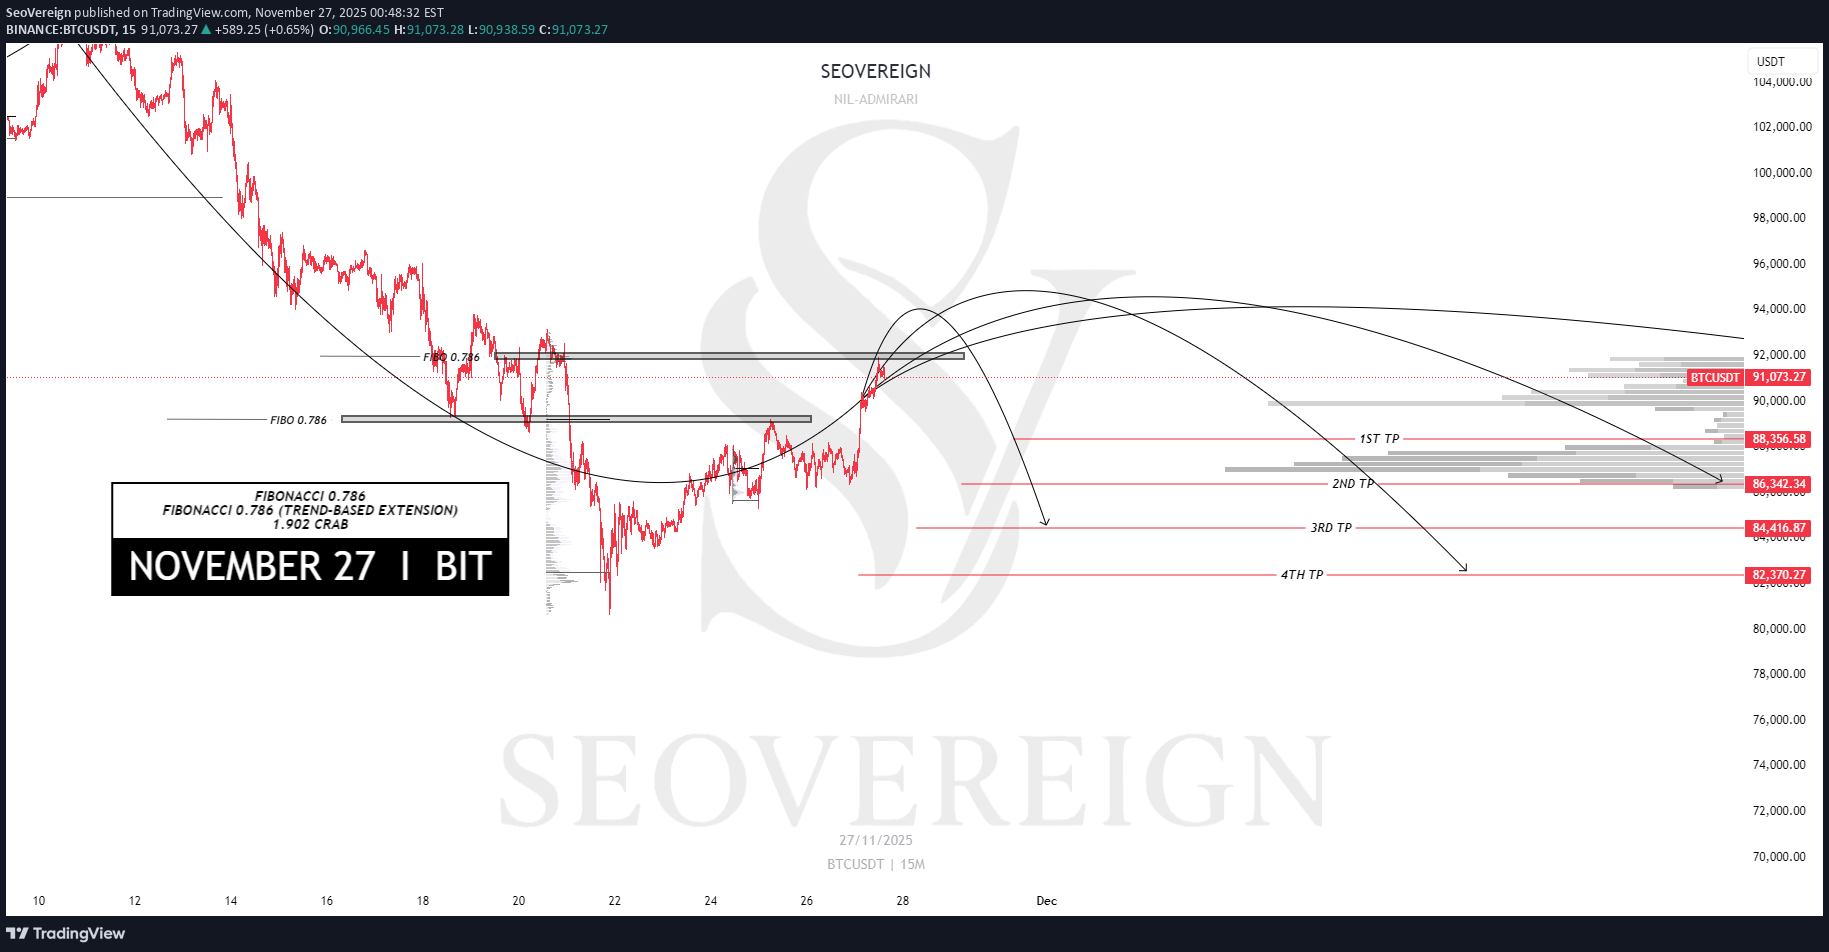
I’m sharing a Bitcoin downside idea as of November 27. Bitcoin has recently seen a sharp decline, and it’s undeniable that this has gradually increased the possibility of a rebound. However, when examining the current chart structure closely, the key conditions that, by my standards, would confirm a bullish reversal have not yet been met. While I expect reversal signals to appear soon and have been observing the chart closely, I’ve identified that, in the current area, short-term downward pressure is actually becoming more prominent. Therefore, I’m sharing a bearish outlook. The basis for this view is as follows. First, in the retracement zone of the recent wave, the Fibonacci 0.786 level is acting as strong resistance. This ratio is typically an area near local highs where selling pressure strengthens again, and even if a rebound occurs, it is more likely to be a correction rather than a full trend reversal. Additionally, the Trend-Based Extension 0.786 level, measured based on the direction of the wave, is also forming resistance. This indicates not just a simple retracement but that structural selling pressure is accumulating within the wave extension. It shows that the current price is still positioned within the continuation of a downward wave. Lastly, when combining the ratios of the entire wave, a Crab pattern completing at the 1.902 zone is forming validly. The 1.902 zone of the Crab pattern is categorized as an area with a high probability of a reversal at the top, and when multiple patterns and ratios converge at a single point, the reliability of the reversal increases even further. With these factors operating simultaneously, I assess the current zone as one where short-term downside is more likely than an immediate bullish reversal. Accordingly, I’ve set the average target at 85,400 USDT, and once the move develops, I expect to decide whether to hold or not at that level.
SeoVereign
پیشبینی سقوط بیت کوین: تحلیل تکنیکال 3 نوامبر و هدف 100,600 تتر!
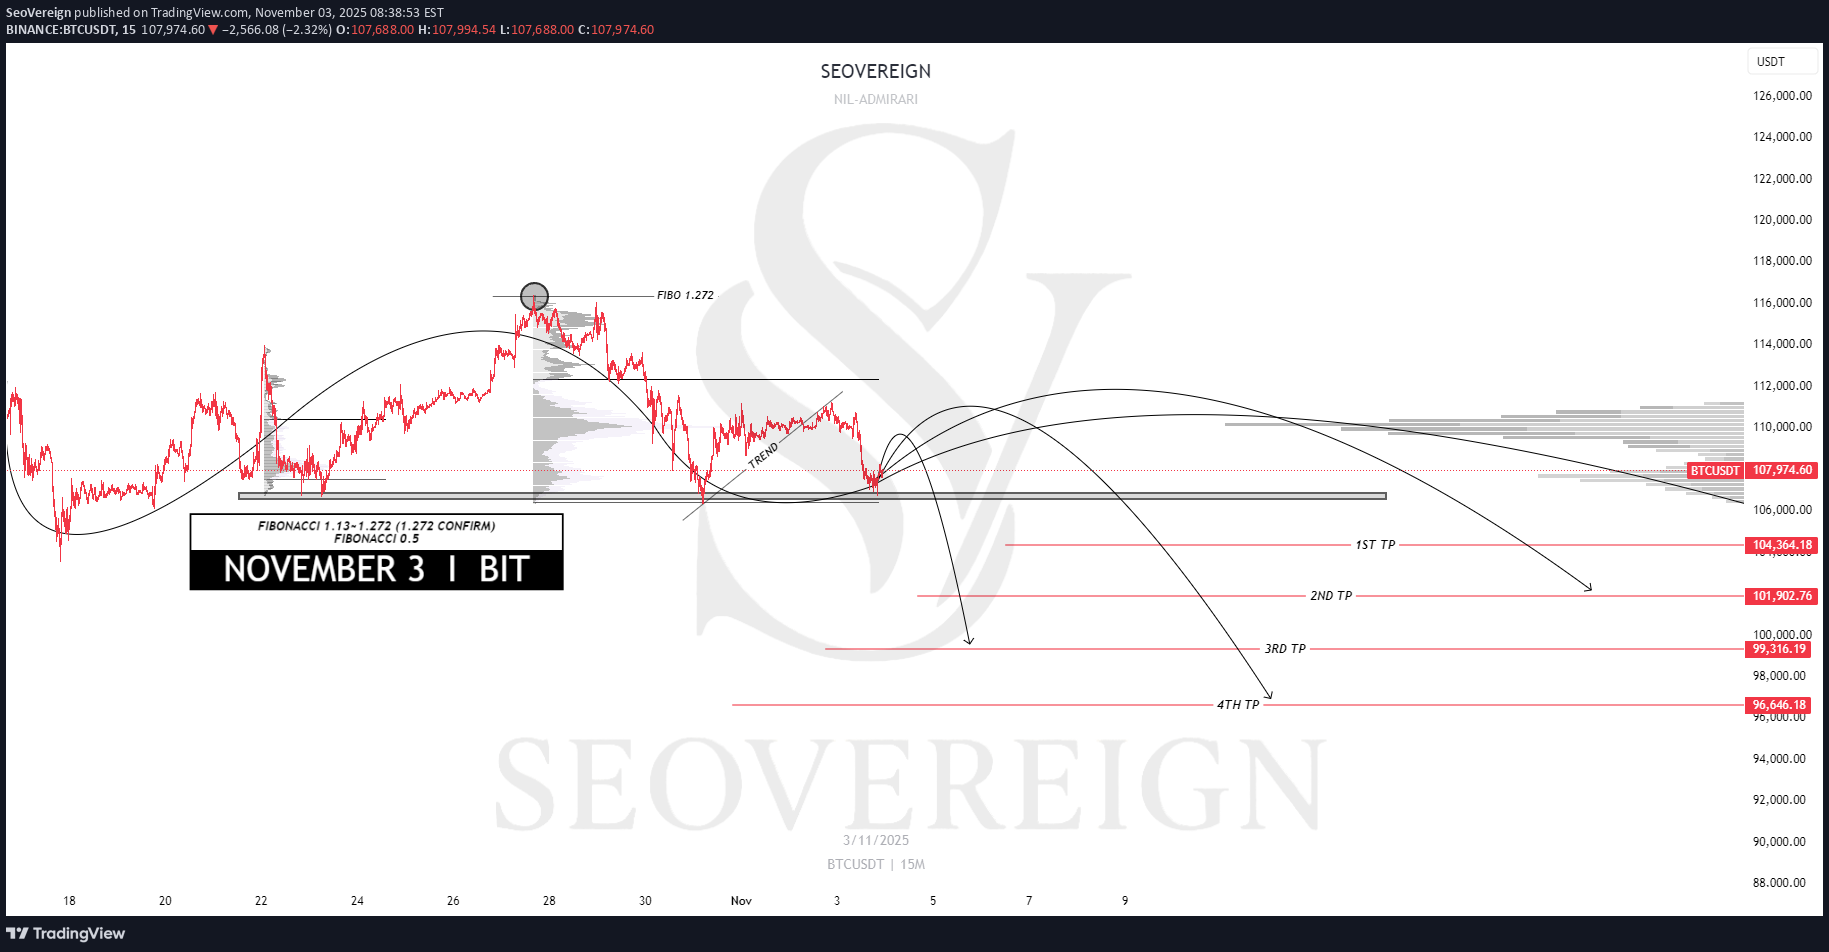
I would like to share my Bitcoin idea as of November 3. This idea is an extension of the one from October 27. The short positions entered on the 27th will be closed in profit in connection with this idea, and I plan to add some additional positions at the same time. This idea is based on a bearish (short) perspective, and I see a high possibility of a downward correction based on technical grounds. First Basis — FIBONACCI 1.272 Retracement Currently, Bitcoin is located in the 1.272 retracement zone relative to the previous downward movement. This is generally recognized as the completion zone of a rebound, where buying pressure tends to weaken and selling pressure begins to appear. Second Basis — Trendline Breakdown Bitcoin has clearly broken below the short-term ascending trendline. This indicates the end of the short-term upward movement and suggests the potential for a new downward trend reversal. Accordingly, I set the average target price around 100,600 USDT. Further position management and updates will be provided depending on market developments. Thank you for reading.
SeoVereign
پیشبینی سقوط اتریوم تا ۳۴۰۰ دلار: پایان خوش برای خرسها در نوامبر ۲۰۲۵!
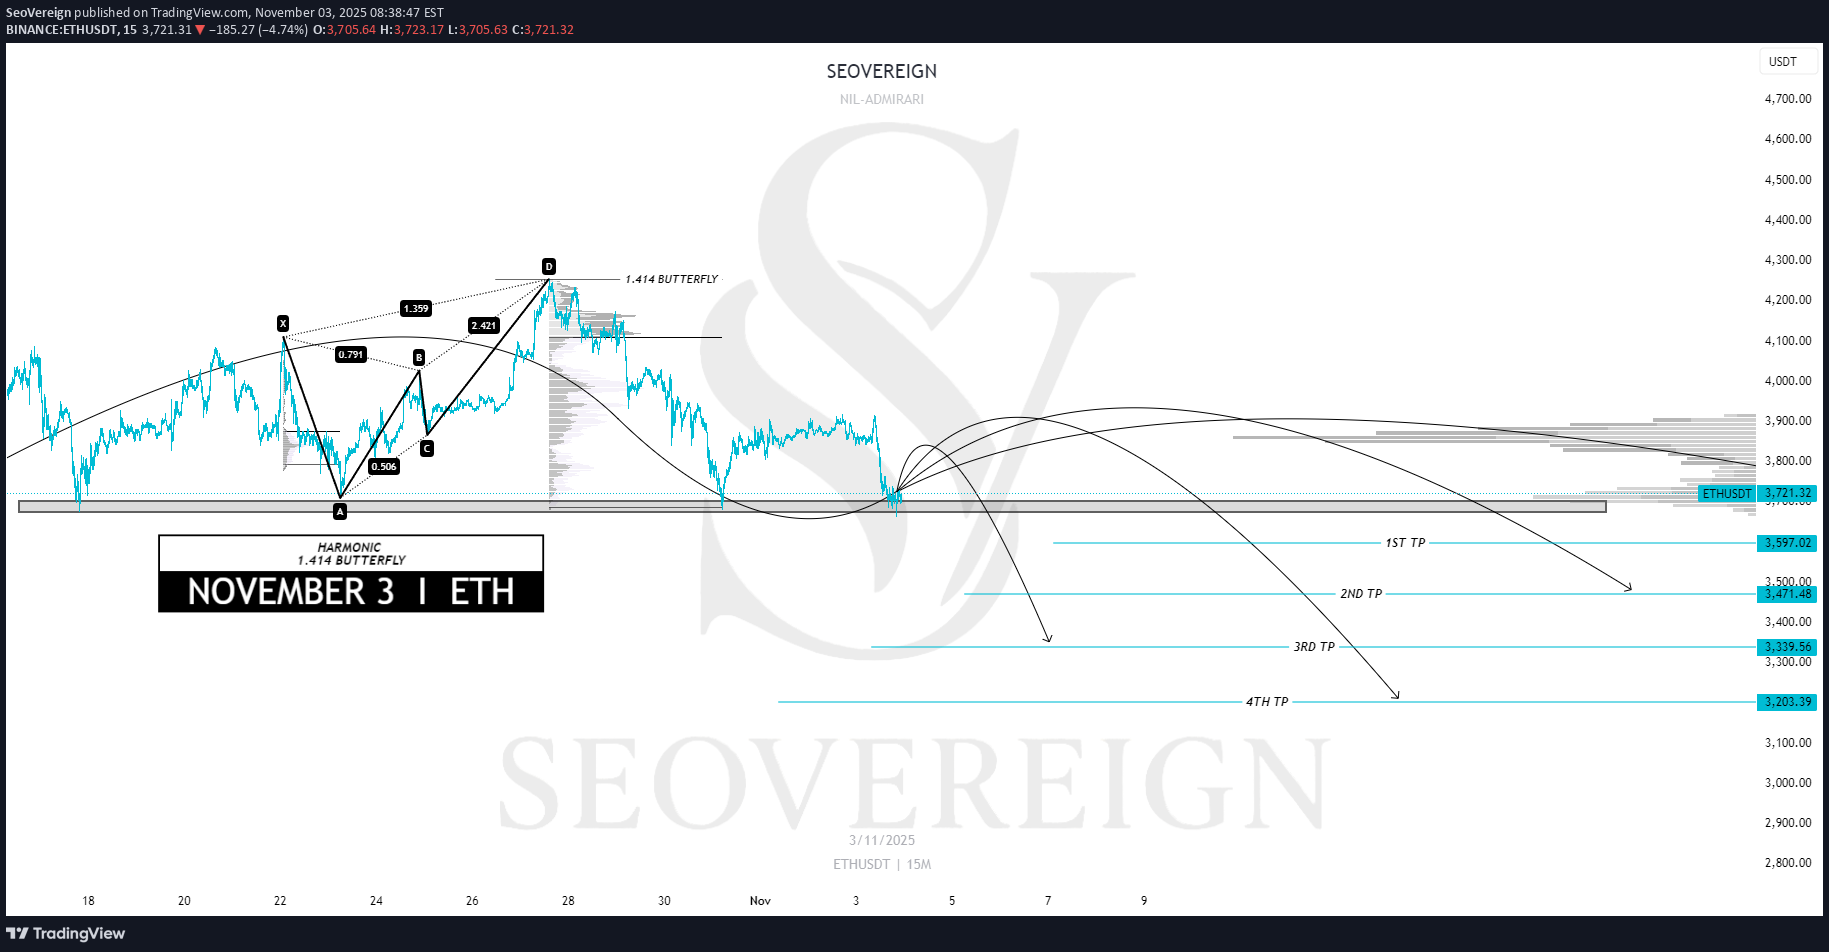
I would like to share my Ethereum idea as of November 3. This idea is an extension of the one from October 27. The short positions entered on the 27th will be closed in profit in connection with this idea, and I plan to add some additional positions at the same time. Basis — Harmonic 1.414 Butterfly Pattern Currently, Ethereum is approaching the completion zone of the 1.414 Harmonic Butterfly pattern that I personally designed. This zone is structurally an overextension area, where a strong technical reversal possibility exists. Accordingly, I set the average target price around 3,400 USDT. Further position management and updates will be provided depending on market conditions. Thank you for reading.
SeoVereign
پیشبینی سقوط سولانا (SOL): تحلیل تکنیکال و هدف ۱۷۶ دلاری در نوامبر ۲۰۲۵
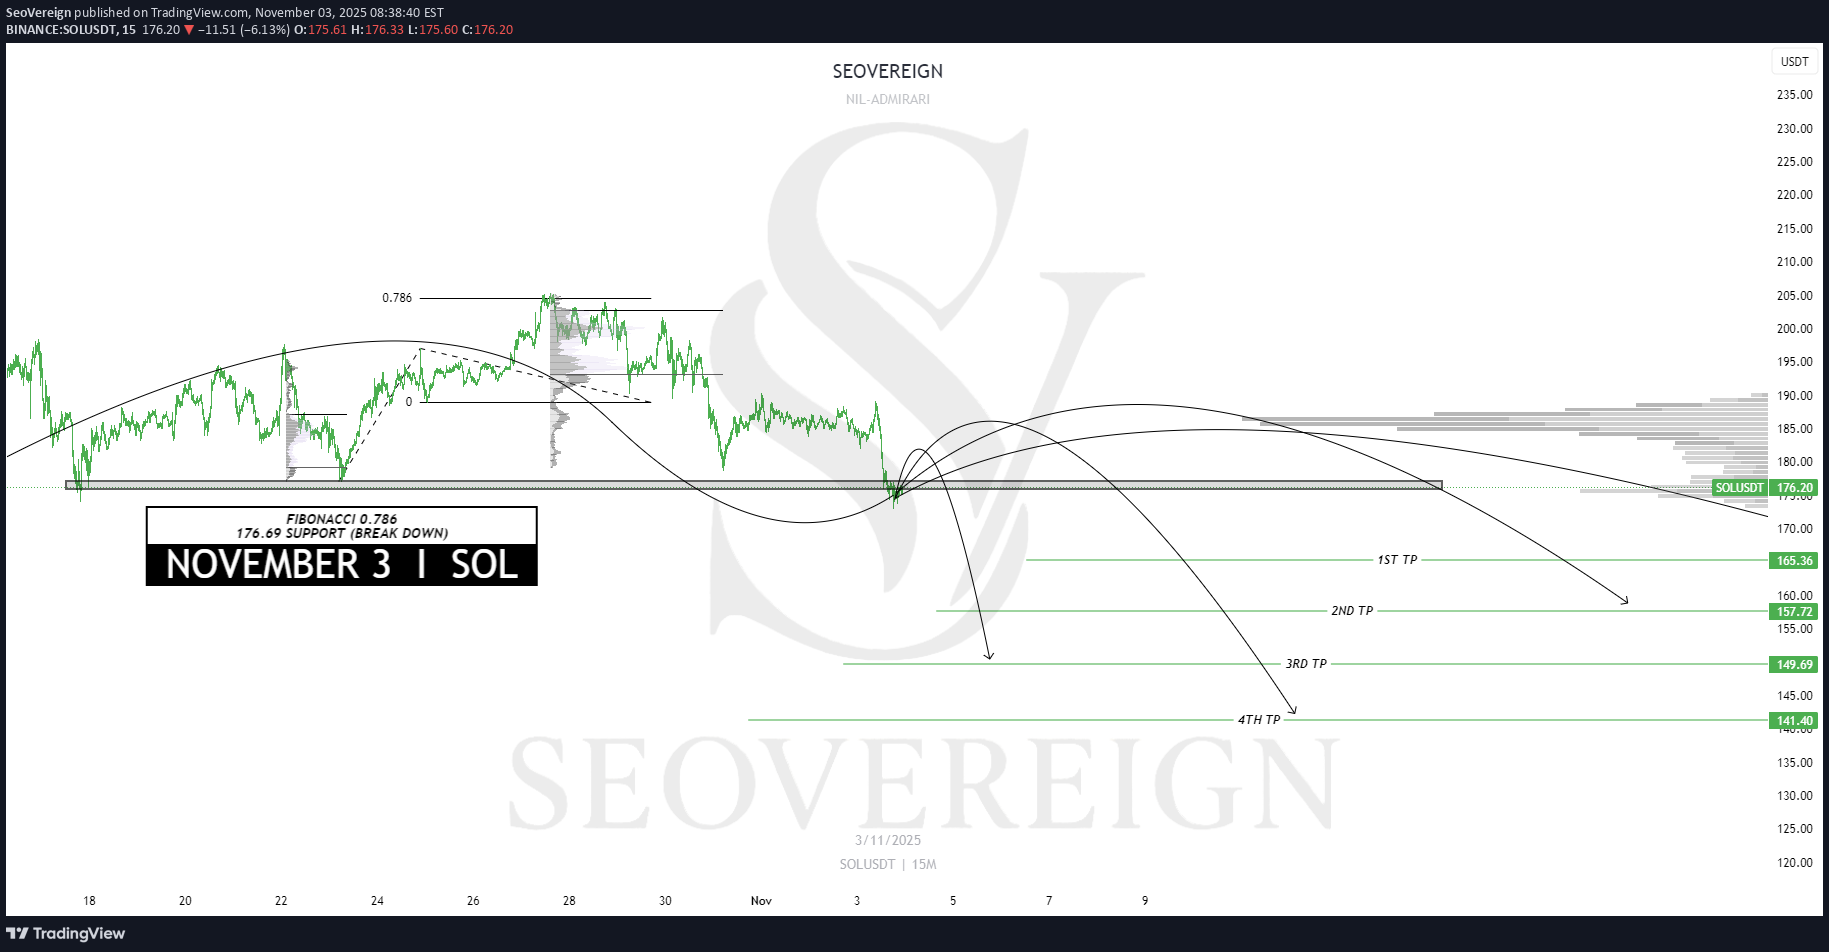
I would like to share my Solana idea as of November 3. This idea is an extension of the one from October 27. The short positions entered on the 27th will be closed in profit in connection with this idea, and I plan to add some additional positions at the same time. Basis — FIBONACCI 0.786 Retracement & Breakdown Around 176 USDT Currently, Solana is showing a clear breakdown signal after reaching the 0.786 retracement level relative to the previous upward wave (around 176 USDT). This zone represents a typical transition area where upward momentum becomes exhausted, indicating the potential for a trend reversal. Accordingly, I set the average target price around 154 USDT. Further position management and updates will be provided depending on market developments. Thank you for reading.
SeoVereign
پیشبینی سقوط ریپل (XRP): هدف جدید ۱.۲ دلار با تکیه بر تحلیل فیبوناچی
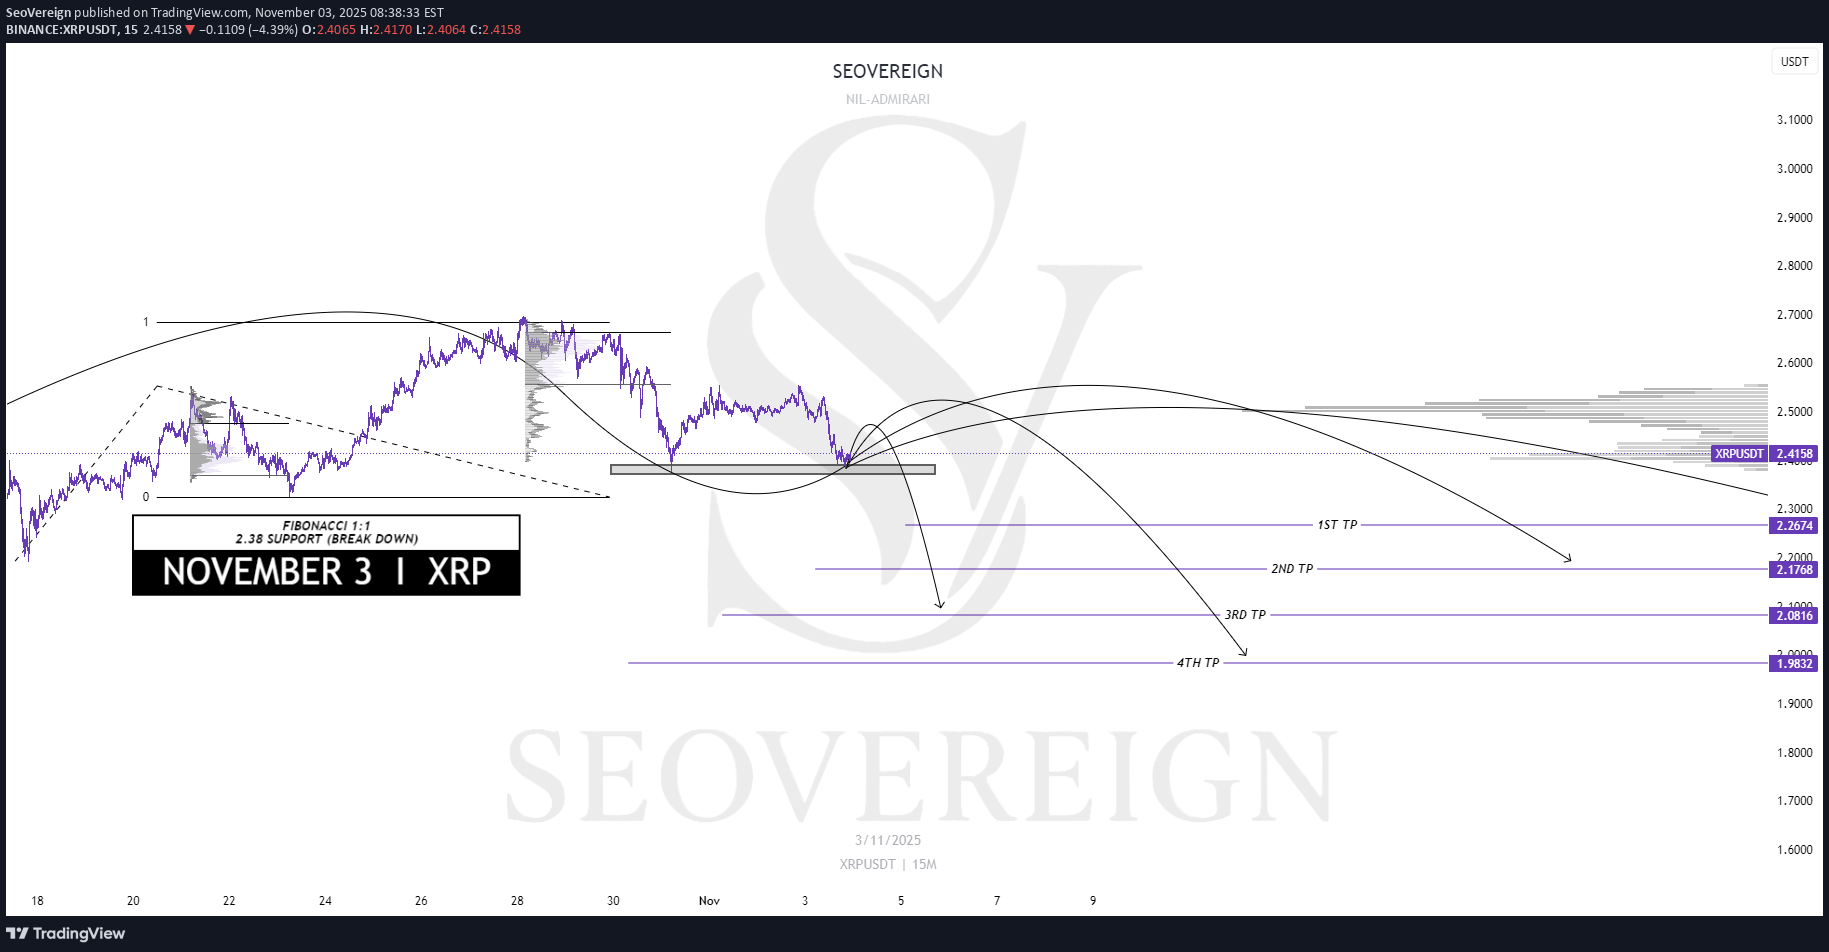
I would like to share my Ripple idea as of November 3. This idea is an extension of the one from October 27. The short positions entered on the 27th will be closed in profit in connection with this idea, and I plan to add some additional positions at the same time. Basis — 1:1 FIBONACCI & Breakdown at 2.38 USDT Currently, Ripple has completed a 1:1 Fibonacci ratio relative to the previous upward wave and is attempting to break below the 2.38 USDT support level. Accordingly, this area indicates a high possibility of transitioning into a new downward trend. I set the average target price around 1.2 USDT. Further position management and updates will be provided depending on market developments. Thank you for reading.
SeoVereign
هشدار فوری اتریوم: آیا ریزش در راه است؟ تحلیل تکنیکال امروز (۲۷ اکتبر ۲۰۲۵)
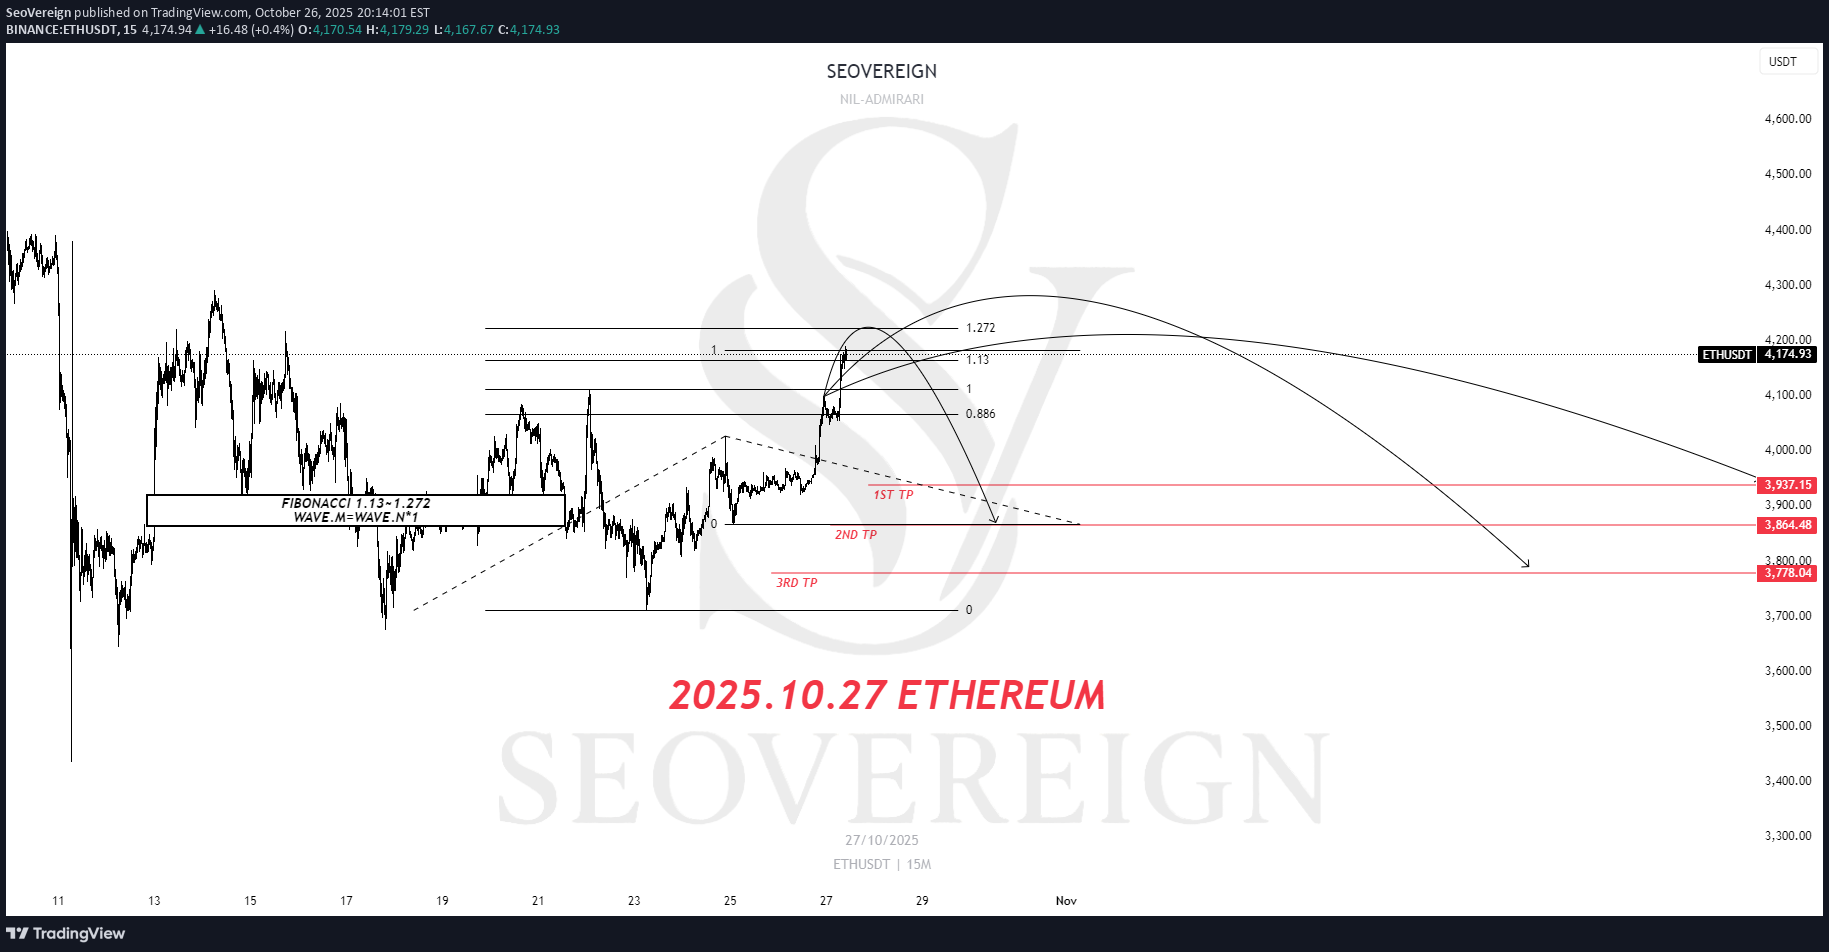
Hello everyone, Currently, Ethereum has re-entered a major resistance zone, and there is a high probability of a short-term corrective movement emerging. First Basis — FIBONACCI 1.13~1.272 Ethereum is positioned within the 1.13–1.272 range relative to the upper structure. This zone is generally recognized as an overheated area of an upward wave, where selling pressure tends to emerge following the formation of a short-term high. Second Basis — WAVE.M = WAVE.N × 1.618 The ongoing M-wave shows an extension ratio of approximately 1.618 relative to the previous N-wave. This represents an overextended structure in wave theory, which is typically interpreted as a sign of trend exhaustion and potential reversal. Accordingly, the average target price is set around 3,864 USDT. This perspective is based on data as of October 26, and further updates will be provided to refine this outlook as the market develops. Thank you for reading.
SeoVereign
پیشبینی سقوط سولانا: آیا زمان فروش فرارسیده است؟ (تحلیل 27 اکتبر)
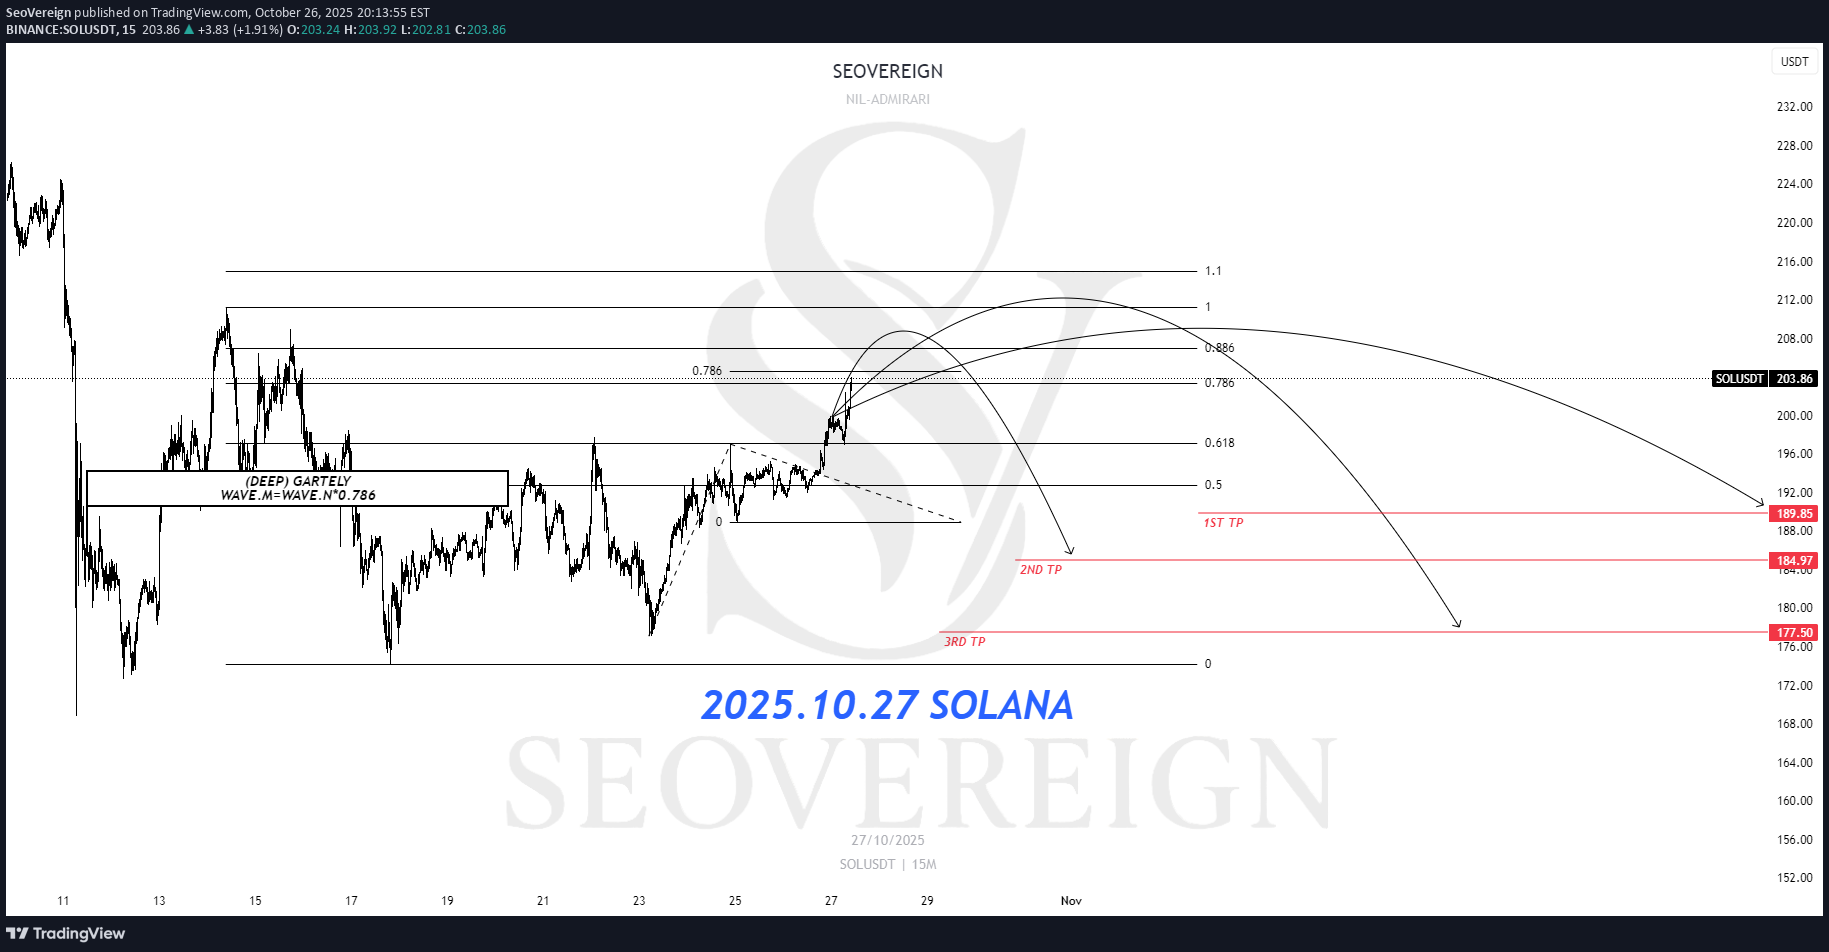
Hello everyone, This idea presents a bearish (short) outlook on Solana as of October 27. Currently, Solana has entered a short-term overheated zone, and we are beginning to observe a gradual inflow of selling pressure. First Basis — (DEEP) GARTLEY Pattern Solana is currently located within the PRZ (Potential Reversal Zone) of a (DEEP) GARTLEY pattern. This zone is typically recognized as the terminal phase of a short-term upward wave, where a trend reversal to the downside often occurs due to overbought conditions. Second Basis — WAVE.M = WAVE.N × 0.786 The ongoing M-wave has formed approximately 78.6% of the length of the previous N-wave, which represents a classic reversal structure commonly observed within the GARTLEY pattern. Therefore, entering a short position within this range is considered technically valid. Accordingly, the average target price is set around 184.97 USDT. Depending on future price developments, I will provide further updates on refinements to this idea and position management strategies. Thank you for reading.
SeoVereign
پیشبینی سقوط ریپل (XRP): آیا زمان فروش در این سطح فرا رسیده است؟
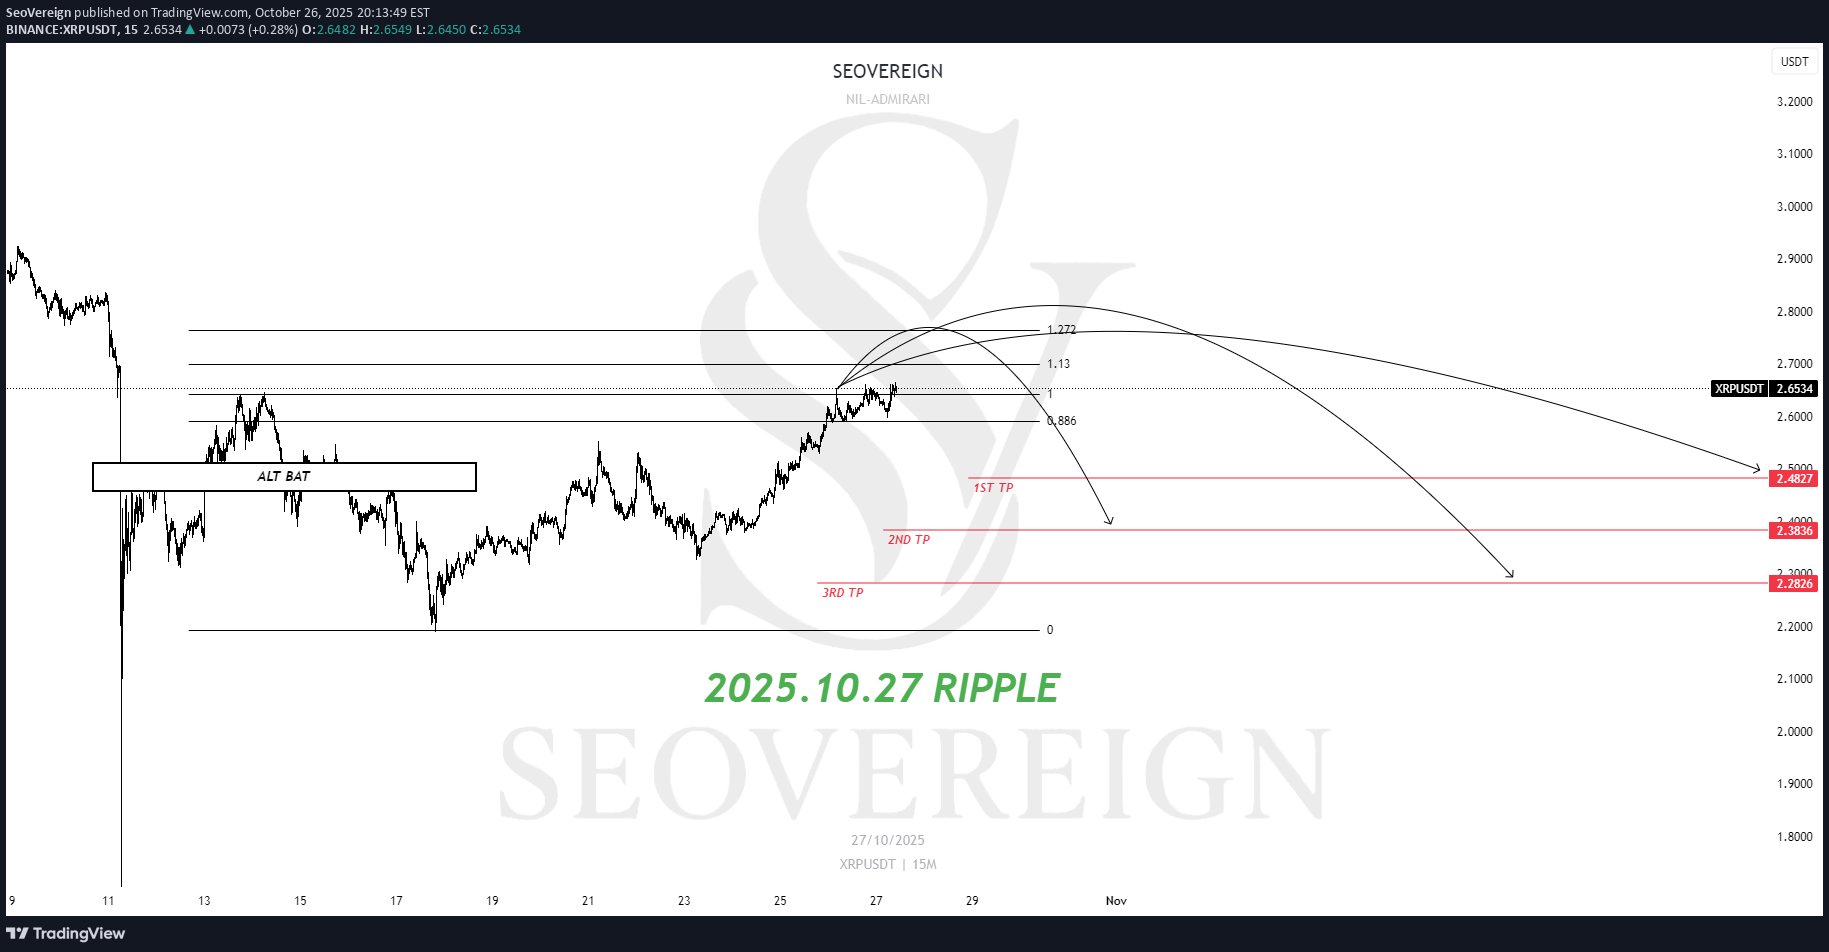
Hello everyone, This idea presents a bearish (short) outlook on Ripple (XRP). Currently, Ripple has reached a major resistance zone following a short-term upward movement, and from a technical standpoint, a corrective phase is likely to occur. Basis — BEARISH BAT PATTERN (Alternate Bat Pattern) Structurally, Ripple has entered the PRZ (Potential Reversal Zone) of a Bearish BAT Pattern. This zone coincides with a price range that has historically shown strong selling pressure, and typically, a downward reversal tends to occur once the pattern is completed. Accordingly, the average target price is set around 2.3 USDT. This perspective is based on data as of October 27, and further detailed updates will be provided depending on future price developments. Thank you for reading.
SeoVereign
پیشبینی نزولی بیت کوین: ورود مجدد به بازار شورت با تحلیل فیبوناچی و ساختار موج!
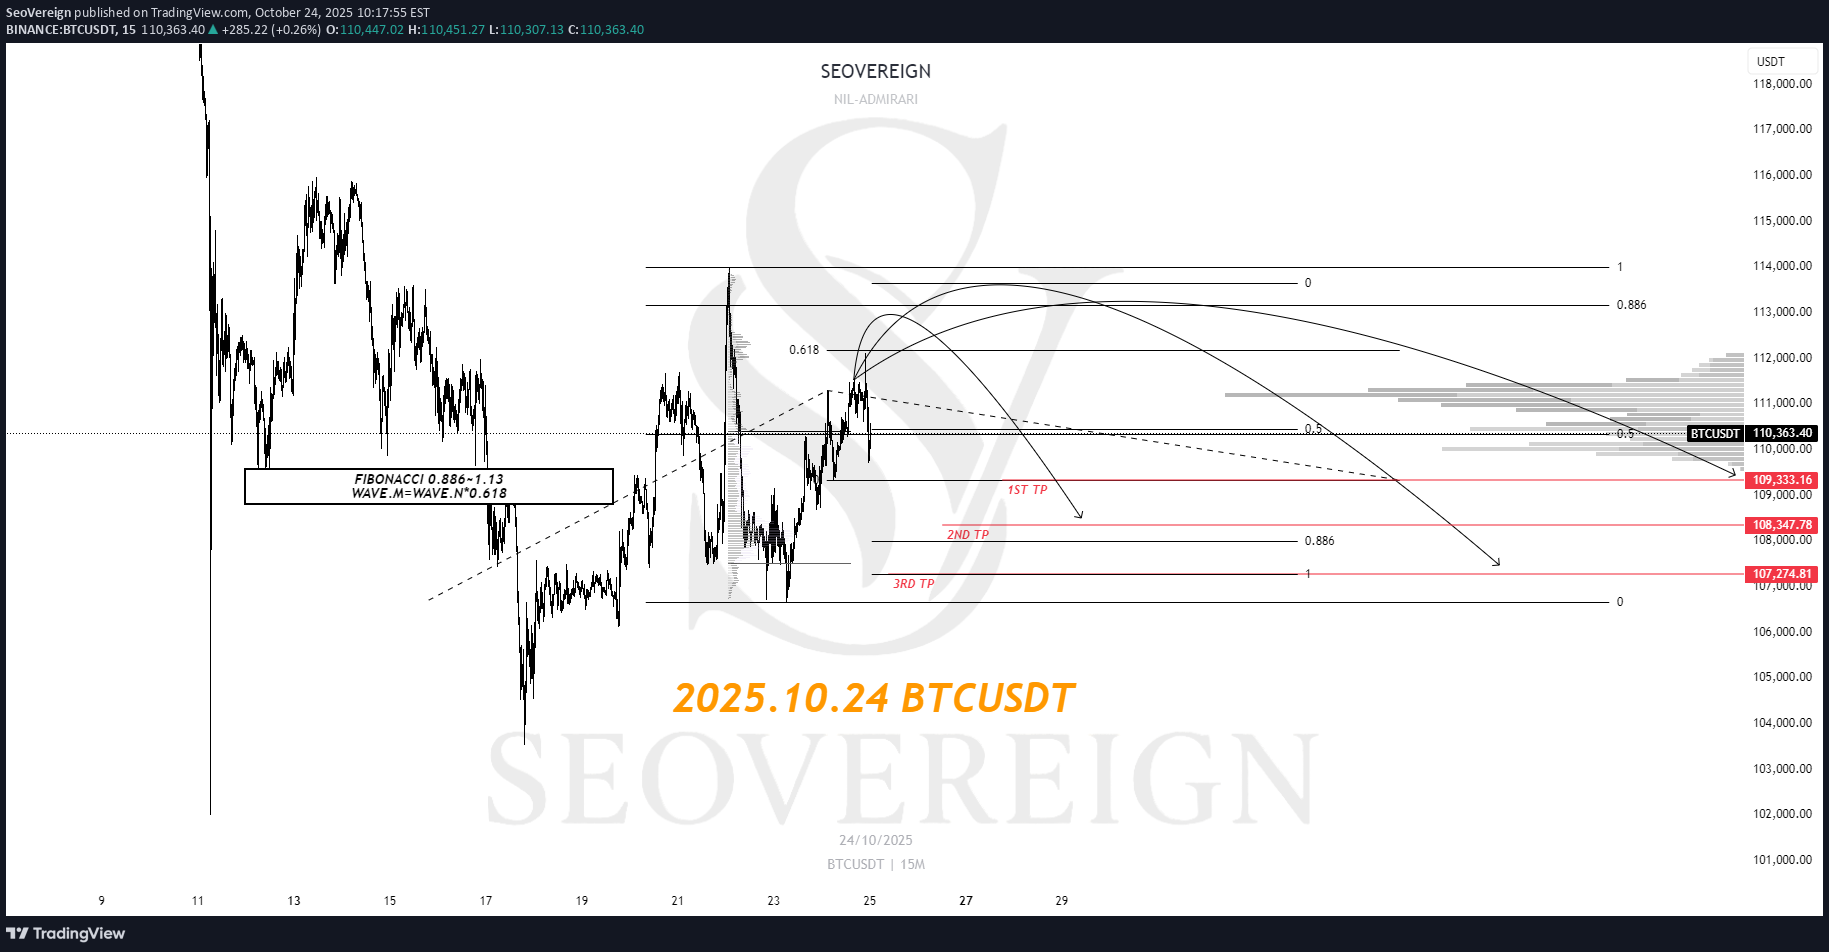
Today, as of October 24th, I would like to share my bearish (short) outlook on Bitcoin. Currently, after taking partial profits from the short position entered on October 21st, I am still holding the remaining portion. A meaningful short entry zone has been identified on the chart today, and I am considering an additional entry. If a downward move unfolds, I plan to scale into the position further based on this idea. However, since part of the position has already been established and the new entry zone overlaps with the previous one, I will proceed with caution, gradually adding to the position rather than entering aggressively. The reasons for considering an additional short entry are as follows: First Basis — FIBONACCI 0.886~1.13 Bitcoin is currently positioned within the 0.886–1.13 range relative to the upper structure. This zone is generally interpreted as an overbought region, often marking the final extension of a prior upward wave. Therefore, once the price enters this zone, selling pressure tends to increase, which can signal a short-term correction or a potential trend reversal. Second Basis — WAVE.M = WAVE.N × 0.786 In terms of wave structure, the ongoing arbitrary M wave shows a ratio of approximately 0.786 relative to a previous arbitrary N wave. This ratio frequently appears near turning points, indicating that the momentum of the upward wave is gradually weakening. Accordingly, the average target price is set around 108,347 USDT. Depending on future price developments, I will provide further updates regarding any changes to this idea and my position management strategy. Thank you for reading.
Disclaimer
Any content and materials included in Sahmeto's website and official communication channels are a compilation of personal opinions and analyses and are not binding. They do not constitute any recommendation for buying, selling, entering or exiting the stock market and cryptocurrency market. Also, all news and analyses included in the website and channels are merely republished information from official and unofficial domestic and foreign sources, and it is obvious that users of the said content are responsible for following up and ensuring the authenticity and accuracy of the materials. Therefore, while disclaiming responsibility, it is declared that the responsibility for any decision-making, action, and potential profit and loss in the capital market and cryptocurrency market lies with the trader.