
Samantha-Urfe
@t_Samantha-Urfe

What symbols does the trader recommend buying?
Purchase History
پیام های تریدر
Filter
Signal Type
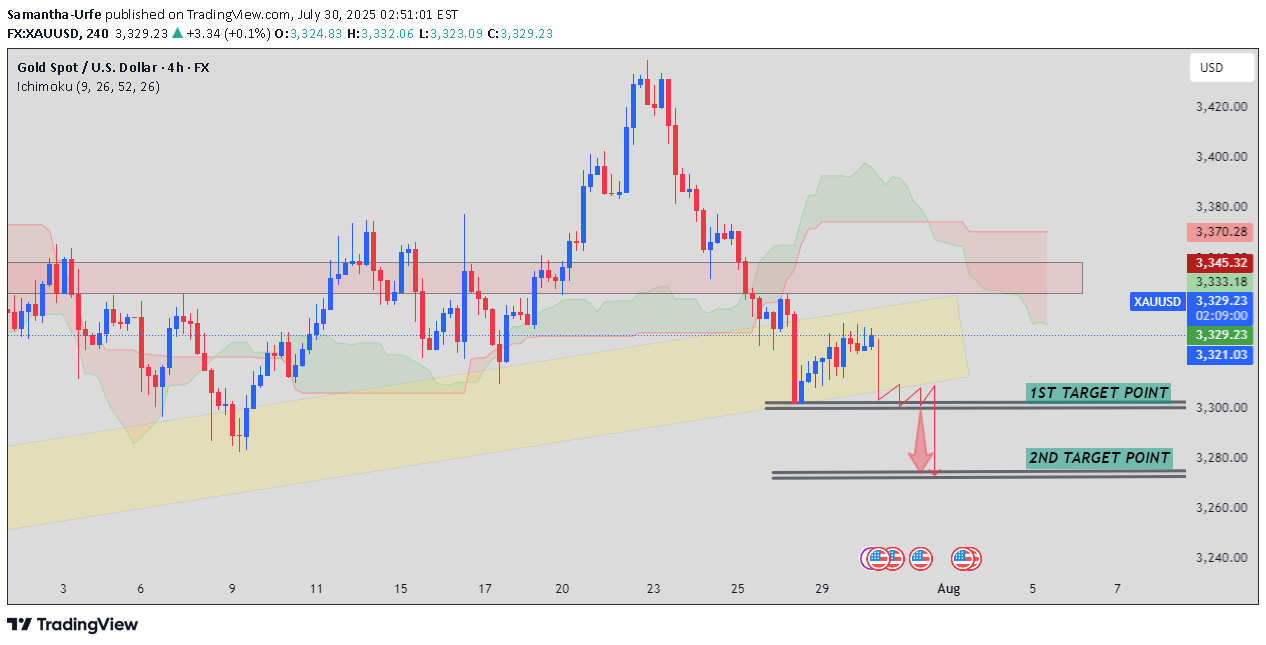
📉 XAU/USD (Gold Spot vs US Dollar) – 4H Technical Analysis Chart from TradingView | Timeframe: 4-Hour Indicators Used: 🔹 Ichimoku Cloud 🔹 Bollinger Bands 🔹 Trendlines & Support/Resistance Zones 🔹 Price Action with Target Levels --- 🔍 Current Market Structure: 🔸 Price: Around $3,324 🔸 Bias: Short-term Bearish 📉 Bearish Signals: 1. Trendline Break: Price has broken below the ascending trendline — a key sign of potential reversal from bullish momentum. 2. Retest & Rejection: Price retested the broken zone (3,335–3,340) and failed to break higher — confirming this area as strong resistance. 3. Ichimoku Confirmation: ▪ Price is trading below the cloud ▪ Future cloud is bearish (red shaded) ▪ Chikou Span is under price & cloud → further downside confirmation --- 🎯 Target Levels: ✅ TP1: 3,300 (first horizontal support) ✅ TP2: 3,270 (stronger support + measured move) ❌ Stop Loss: Above 3,345–3,350 zone 📌 Resistance Zones: ▪ Immediate Resistance: 3,335–3,340 ▪ Stronger Resistance: 3,370 --- 📢 Conclusion: The 4H XAU/USD chart shows a clear bearish breakout below trendline and cloud structure. Price action confirms momentum shift with rejection at resistance. 🎯 Targeting 3,300 and 3,270 with SL near 3,350.🔥 XAU/USD (Gold) Update 🔥 SELL Position 🎯 Take Profit 1: HIT ✅ ✅ 300 Pips Secured! We nailed the first target—now eyes on the next move! 📉 Next Target: 3270 Stay sharp — more profits ahead. #Gold #XAUUSD #SellSetup #Profit #300PipsDone
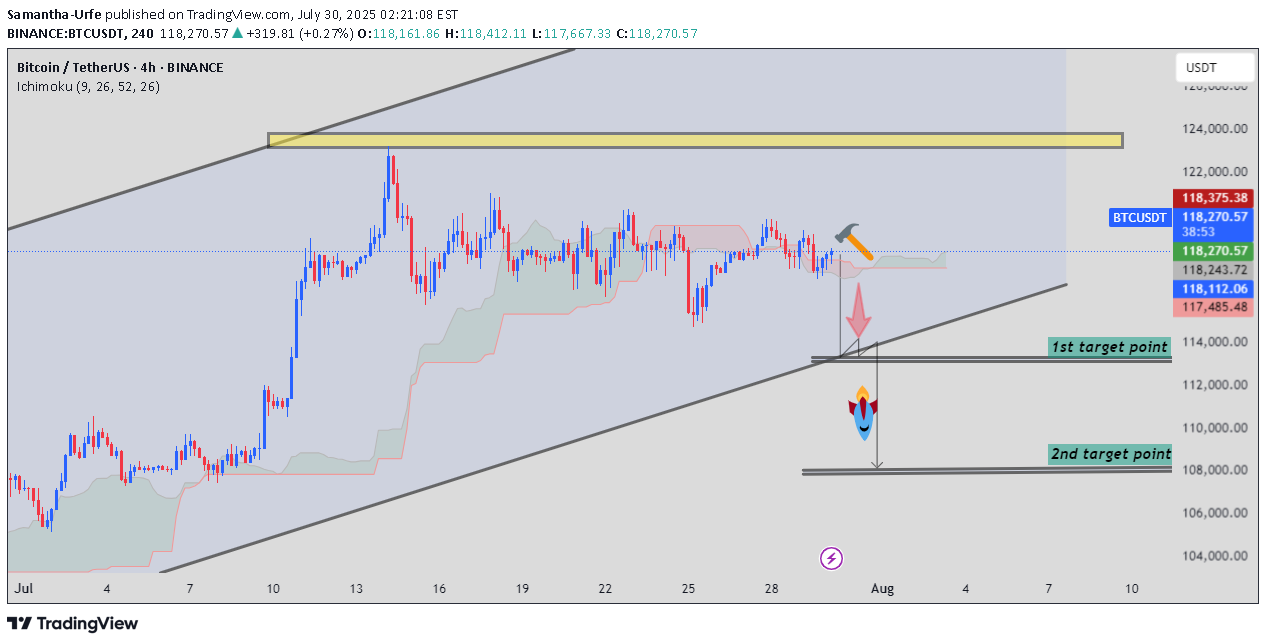
, here are the downside target levels (short-term bearish targets) for BTC/USDT: Target Levels: 1. Target Point 1: 113,500 USDT This is a minor support zone where a temporary bounce or consolidation could occur. It aligns with previous price action support and is near the lower Ichimoku edge. 2. Target Point 2: 108,000 USDT This is a major support level near the lower boundary of the ascending channel. If price breaks below Target 1 decisively, this becomes the high-probability target.
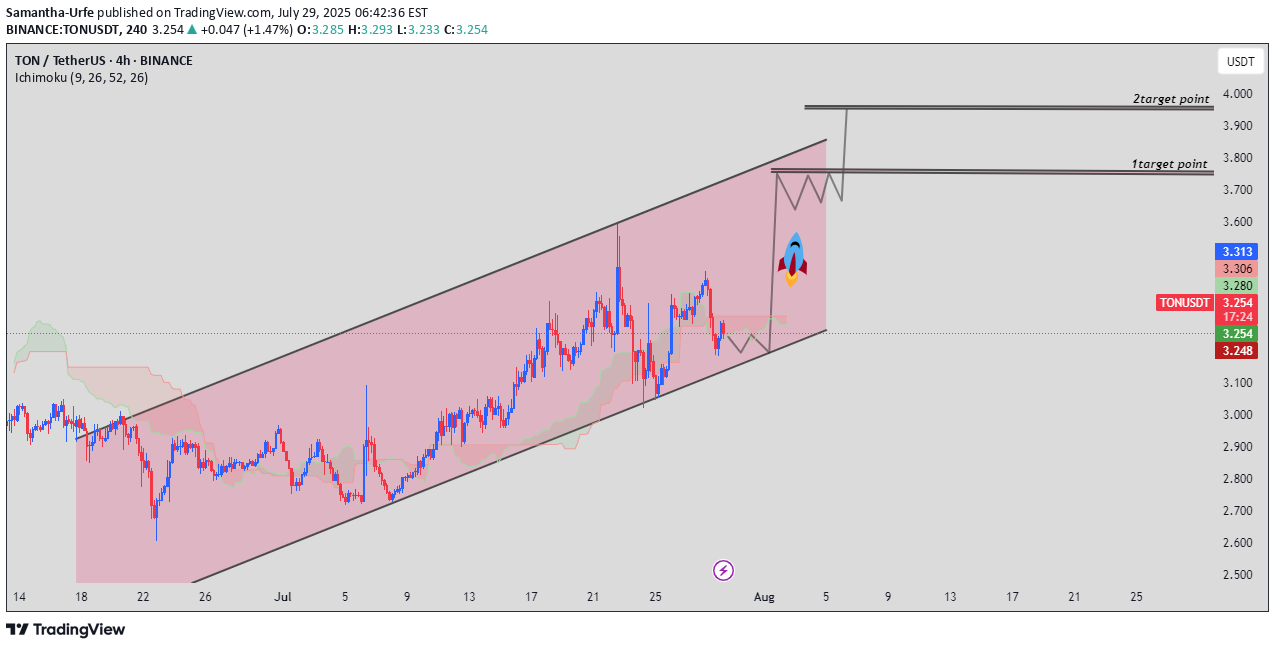
The TON/USDT pair on the H4 timeframe presents a potential buying opportunity following the formation of a Bullish Channel Pattern. This indicates a possible shift in momentum to the upside, increasing the chances of further gains in the coming days. 🚀 Trade Idea – Long Setup: 📍 Entry: Look for long entries near the channel trendline. 🎯 Target Levels: 1st Resistance: 3.750 2nd Resistance: 3.950 📢 Please hit the Like button and 💬 Drop a comment to support this post! Your support keeps me going and helps me share more valuable market insights. Best Regards, Samantha-Urfe
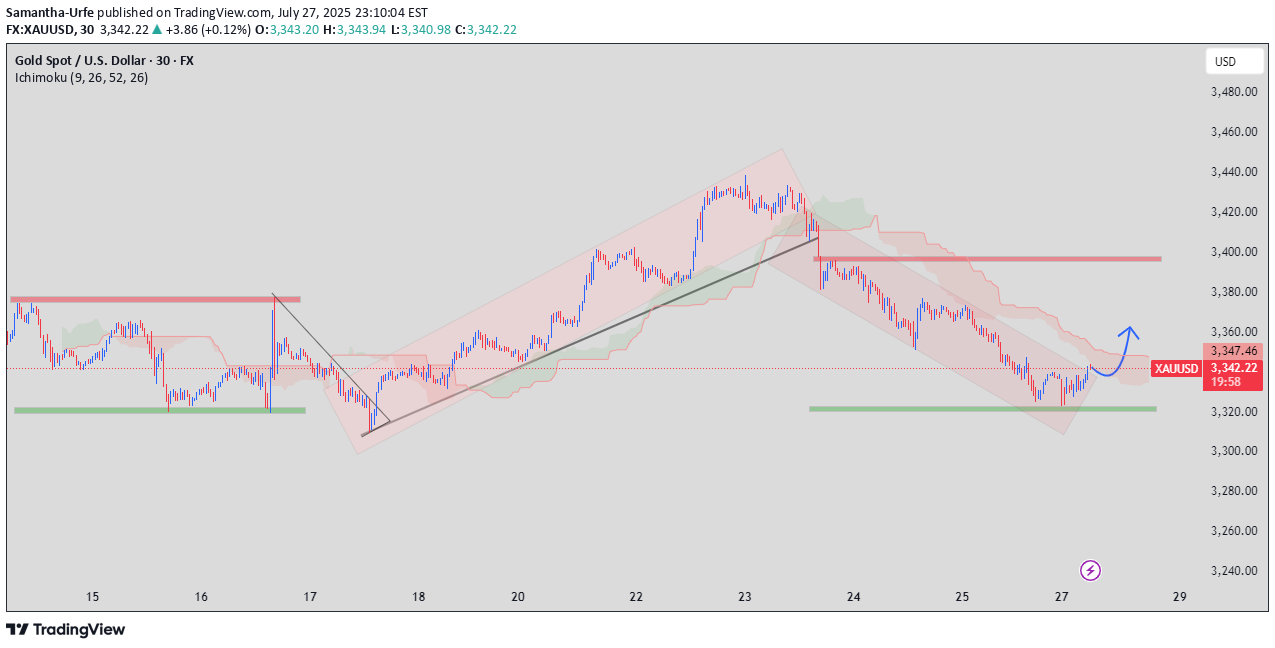
Gold (XAUUSD) appears to be forming a potential bullish reversal after a sustained downtrend within a descending channel. Price recently tested a strong horizontal support zone near $3,320, where buying pressure has started to build. The chart suggests: Price is attempting to break out of the descending channel. Ichimoku cloud shows early signs of a potential shift in momentum. A successful breakout above the cloud and $3,347 resistance could trigger a rally towards the $3,400–$3,420 supply zone. Bulls need confirmation through a clear candle close above the channel and the cloud. Strong Support Zone: Price bounced from key support near $3,320, previously tested multiple times. 2. Descending Channel: Price has been moving in a bearish channel since July 23. Now testing the upper boundary of this channel. 3. Potential Reversal Pattern: Formation of a rounded bottom hints at bullish reversal. 4. Ichimoku Cloud: Price is approaching the Ichimoku cloud, acting as resistance. A breakout above the cloud can confirm a trend change. 5. Short-Term Resistance: Immediate resistance at $3,347–$3,350 (also Ichimoku level). Strong resistance zone lies at $3,400. 6. Bullish Breakout Scenario: If price breaks and holds above the channel and Ichimoku, $3,360–$3,400 becomes the bullish target.
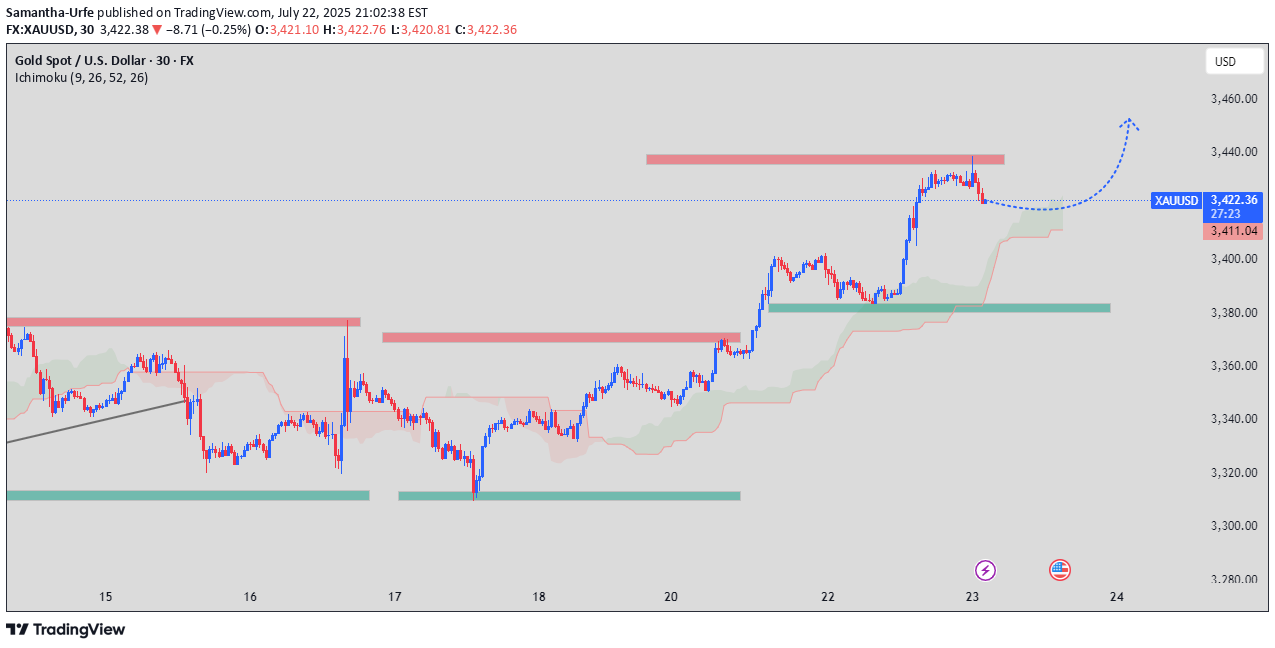
Price Action: XAUUSD is currently pulling back after a strong bullish rally and testing the broken resistance at $3,420 as new support. Ichimoku Cloud: Price remains well above the Ichimoku Cloud, suggesting strong bullish momentum. The cloud is acting as dynamic support near the $3,411 level. Key Levels: Support Zone: $3,411–$3,420 (recent breakout level + Ichimoku support) Resistance Zone: $3,445–$3,455 (next potential target) Projection: If the price holds above $3,411 and confirms a bullish rejection, we can expect a continuation toward the $3,450 area. Outlook: Bullish bias remains intact unless price breaks and closes below the Ichimoku cloud.
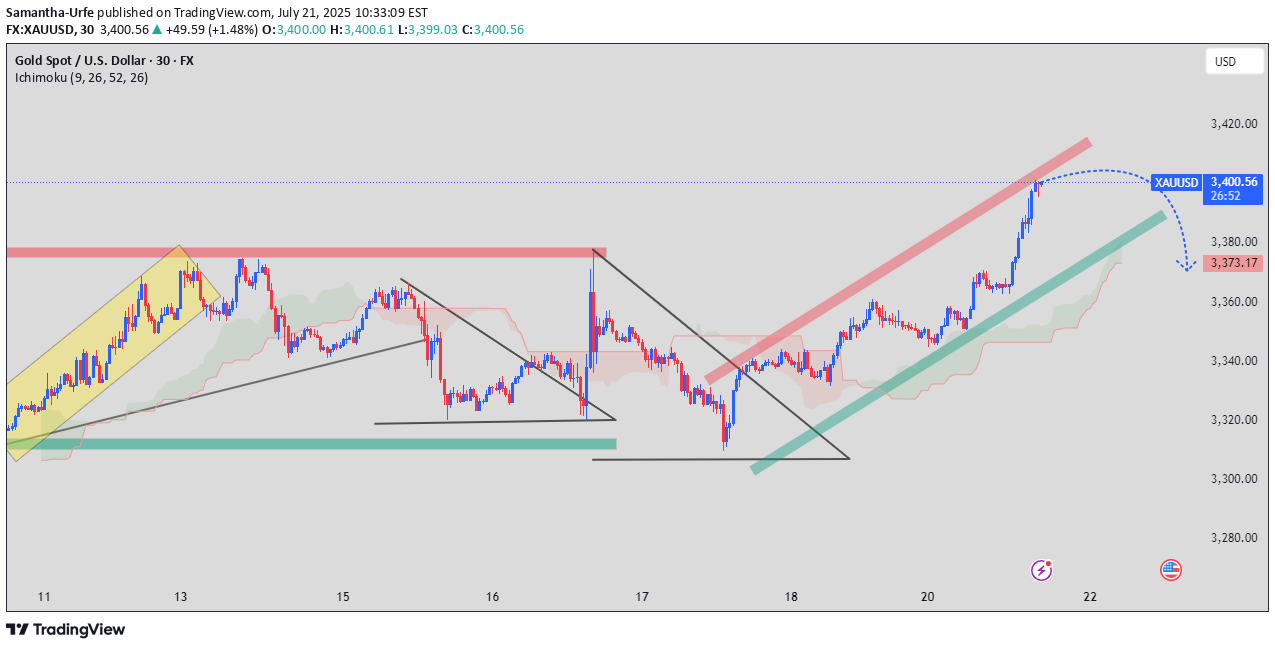
XAUUSD Technical Analysis – Bearish Reversal Setup 1. Rising Wedge Formation (Bearish Pattern) Price is moving within an ascending wedge, a typical sign of weakening bullish momentum. The upper red zone marks resistance around $3400, where a reversal is anticipated. 2. Key Resistance Zone Hit The current price has entered a previous rejection area (highlighted in red), increasing the probability of selling pressure. 3. Support Zones & Trendlines Immediate support lies near the green ascending trendline and Ichimoku cloud (~$3373). A break below this level could confirm the start of a deeper correction. 4. Previous Patterns Symmetrical triangle and descending wedge previously broke to the upside, but now the market is overextended. 5. Potential Move If price fails to break above $3400 convincingly, expect a short-term retracement toward $3373, possibly $3340. --- 🔻 Summary: Bias: Bearish Reversal Resistance: $3400–$3405 Support: $3373 → $3340
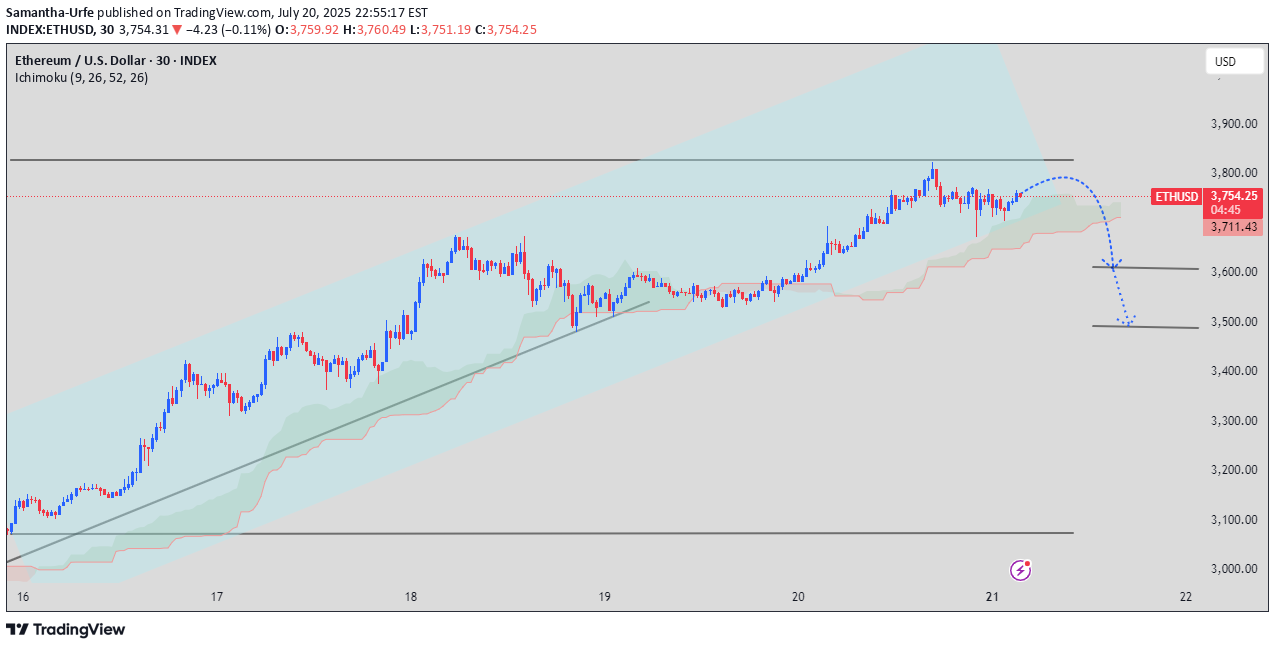
Ethere (ETHUSD) Bearish Reversal Within Rising Channel – Potential Correction Ahead 🔍 Technical Overview: Rising Channel Structure: ETH has been moving in a well-defined ascending channel since July 16. However, recent price action near the upper boundary shows exhaustion. Price Rejection Near $3,800: ETH failed to break above the psychological resistance at $3,800, forming a local top with bearish divergence. Ichimoku Signal Weakening: Price has re-entered the Ichimoku Cloud with weakening bullish momentum. A clear break below the Kijun-sen (~$3,711) would signal trend shift. Potential Breakdown Path: The projection outlines a short-term rally toward $3,770–$3,780 resistance, followed by a breakdown toward: Target 1: $3,600 – aligning with prior structure support and the lower edge of the Ichimoku cloud. Target 2: $3,500 – deeper correction if momentum continues. 📊 Key Levels: Resistance: $3,780 – $3,800 Support: $3,600 > $3,500 > $3,400 📌 Outlook: A bearish reversal is anticipated if ETH fails to reclaim and sustain above the $3,780 zone. Look for confirmation through cloud breakdown and volume pickup on downside. --- ✅ Tips for Getting Featured: Include detailed trade idea with entry, stop loss, and take profit zones. Use high-resolution, clear charts with marked key levels and projected paths. Add value through unique patterns or indicator-based signals (like Ichimoku in this case).
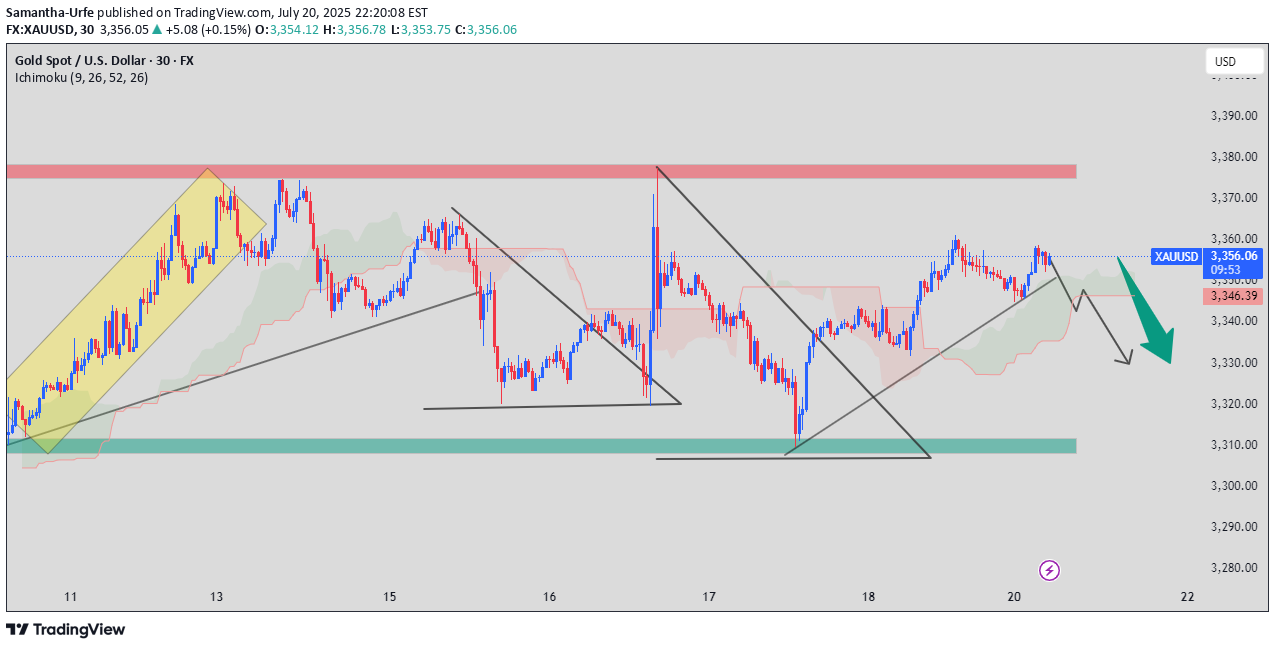
📊 Description: Gold (XAUUSD) appears to be forming a bearish reversal structure following multiple key rejections at the $3,375 resistance zone. After a strong bullish channel (highlighted in yellow) leading into the mid-July highs, the market showed signs of exhaustion. 🔍 Key Technical Highlights: Bearish Reversal Pattern: After testing the upper resistance zone near $3,375–$3,385, price action formed a rising wedge, followed by breakdowns into symmetrical triangle and descending wedge patterns — all pointing to a weakening bullish momentum. Ichimoku Cloud: Price is hovering around the cloud with Kijun-Sen resistance at $3,346, signaling consolidation and potential bearish continuation. Double Top Zone: The highlighted red zone has been tested multiple times and acted as a strong supply area. Support Zone: The green support zone near $3,310–$3,315 held multiple times in the past, but each bounce is weaker, suggesting a likely break below on the next test. Projected Move: As price failed to break and sustain above the $3,355–$3,360 level, and broke below the ascending structure, a move toward $3,320 or lower is likely, especially if price breaks below $3,340 with strong volume. 🧠 Trading Insight: Sellers are likely to take control below the current Ichimoku cloud, with a short bias valid as long as price remains below $3,360. Confirmation would come on a decisive break below $3,340.
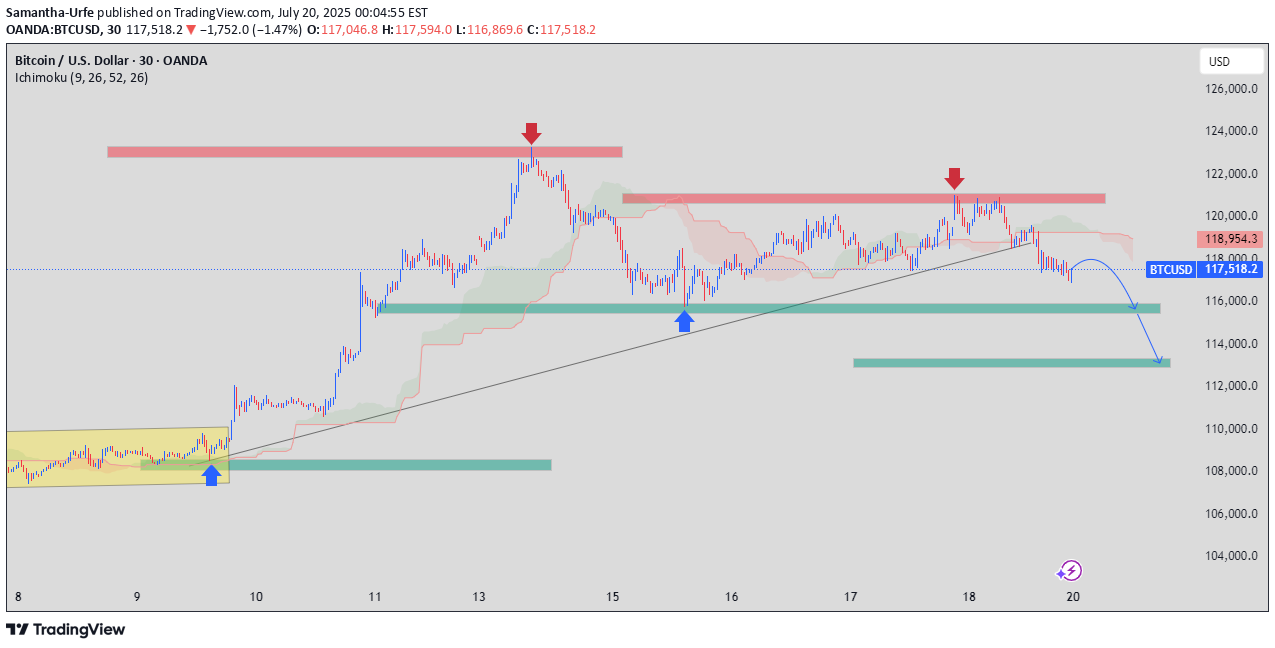
🧩 Narrative & Technical Breakdown (Post Commentary) 📅 Date: July 20, 2025 ⏱ Timeframe: 30-Minute Chart 📍 Instrument: Bitcoin (BTCUSD) --- 🔍 Technical Insight & Analysis: 1. Price Structure: Double Rejection Zone (Red Arrows) at ~$121,000–$122,000 highlights a strong resistance ceiling. After two failed breakouts, price failed to maintain higher lows, breaking below the ascending trendline support. 2. Ichimoku Analysis: Price is currently below the cloud, indicating bearish momentum is taking over. Bearish Kumo twist and price rejection near the cloud further confirms weakening bullish bias. 3. Key Levels to Watch: Immediate Support Zone: ~$116,000 (highlighted in green) — previously tested. Major Breakdown Target: ~$113,000–$114,000 — strong demand zone and potential bounce area if the selloff continues. 4. Pattern Recognition: Breakdown from an ascending triangle or rising wedge. Lower highs and horizontal support breach imply a trend reversal in the short term. --- 📈 Trading Bias & Forecast: Given the structure and momentum: A retest of the broken trendline or the Ichimoku cloud base near $118,000 is likely, followed by a push down into the $114,000 area. Bears are in control unless BTC reclaims $120,000 with conviction. --- 💬 Call to Action / Engagement Prompt: > "Are we heading to $114K next? Or is this just a shakeout before another leg up? Drop your thoughts and setups below 👇 Let's chart it out together!" --- ✅ To Improve Your Chances for Editors’ Pick: Clear Labels on Chart: Add text boxes explaining the arrows/zones (e.g., "Rejection Zone", "Breakdown Line", "Demand Zone").
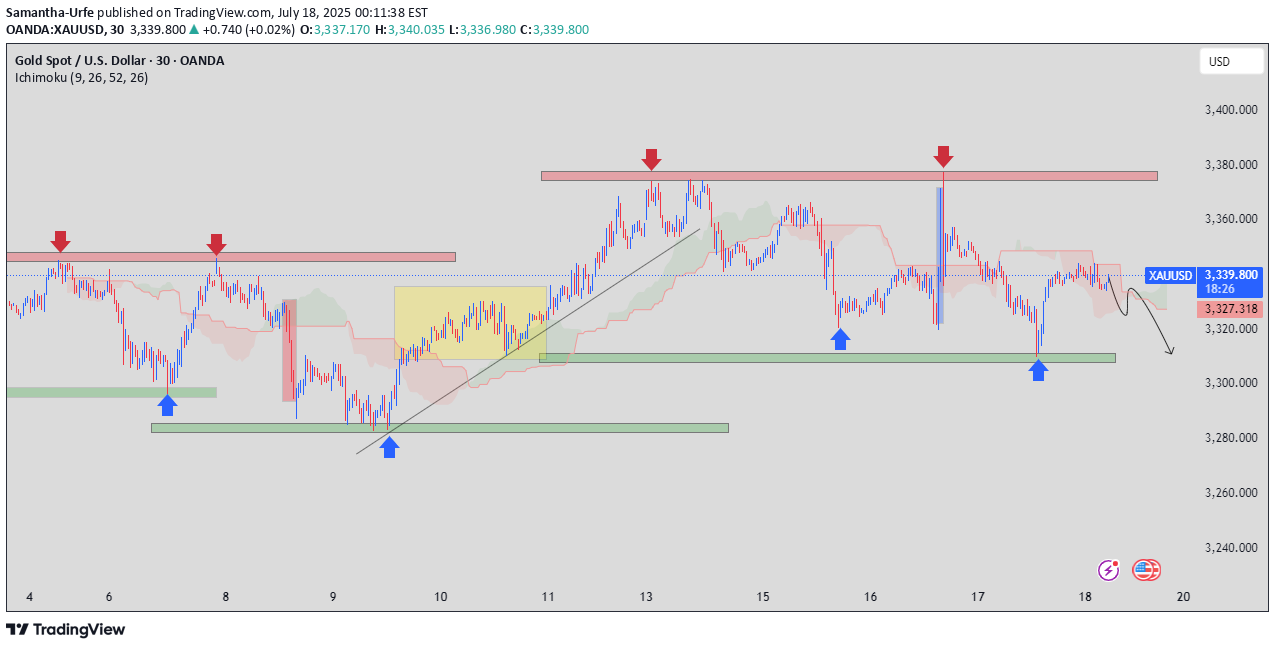
The 30-minute chart of Gold (XAU/USD) highlights a clear bearish structure, with repeated rejections at the $3,370–$3,380 resistance zone (red arrows) and strong support around $3,310–$3,320 (green zone). Despite multiple bounces (blue arrows), price action has formed lower highs, indicating weakening bullish momentum. The Ichimoku Cloud signals a shift in sentiment, and the projected path shows a potential breakdown below support. Traders should watch for a confirmed breach of the $3,320 level for further downside potential. 🔴 1. Strong Resistance Zone (~$3,370–$3,380) Repeated price rejections at this level (marked by red arrows) suggest a strong supply zone. Price has failed to close above this zone multiple times, indicating sellers are firmly in control here. --- 🔵 2. Key Support Zone (~$3,310–$3,320) This green zone has acted as a reliable demand area, shown by blue arrows where price consistently bounced. However, the more frequent tests of support indicate that it may soon break, weakening the buyers' defense. --- ⛅ 3. Ichimoku Cloud Analysis Price is hovering below or inside the cloud, suggesting bearish to neutral momentum. The cloud is relatively thin, which could mean low support for bullish moves and a potential sharp bearish continuation. --- 📉 4. Lower Highs Structure The market is forming lower highs, a classic sign of distribution and bearish trend development. Sellers are stepping in earlier at lower prices, reducing upside potential. --- 🟨 5. Accumulation Phase (Yellow Box) A sideways consolidation phase occurred previously, leading to a bullish breakout. Currently, there's no similar base being built, which increases the risk of a breakdown, rather than reversal. --- 🧐 6. Bearish Projection The black arrow suggests a forecasted break below support, potentially targeting the $3,280–$3,300 area. A confirmed break below $3,320 with strong volume would validate this bearish scenario. --- 📌 Conclusion This chart reflects a bearish bias with weakening bullish attempts. Watch for: Break and close below $3,320 → Confirmation of bearish trend continuation. Failure to break support → Could trigger another bounce, but upside remains limited below $3,370.
Disclaimer
Any content and materials included in Sahmeto's website and official communication channels are a compilation of personal opinions and analyses and are not binding. They do not constitute any recommendation for buying, selling, entering or exiting the stock market and cryptocurrency market. Also, all news and analyses included in the website and channels are merely republished information from official and unofficial domestic and foreign sources, and it is obvious that users of the said content are responsible for following up and ensuring the authenticity and accuracy of the materials. Therefore, while disclaiming responsibility, it is declared that the responsibility for any decision-making, action, and potential profit and loss in the capital market and cryptocurrency market lies with the trader.