Technical analysis by Samantha-Urfe about Symbol PAXG: Sell recommendation (7/18/2025)

Samantha-Urfe
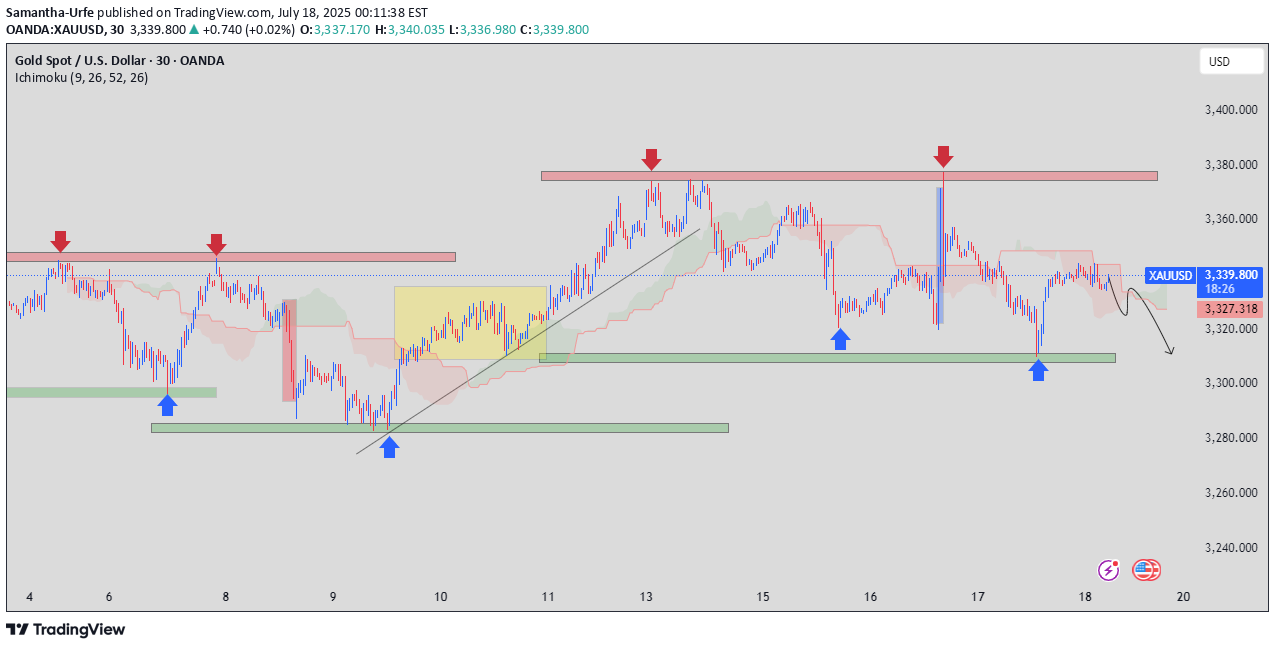
The 30-minute chart of Gold (XAU/USD) highlights a clear bearish structure, with repeated rejections at the $3,370–$3,380 resistance zone (red arrows) and strong support around $3,310–$3,320 (green zone). Despite multiple bounces (blue arrows), price action has formed lower highs, indicating weakening bullish momentum. The Ichimoku Cloud signals a shift in sentiment, and the projected path shows a potential breakdown below support. Traders should watch for a confirmed breach of the $3,320 level for further downside potential. 🔴 1. Strong Resistance Zone (~$3,370–$3,380) Repeated price rejections at this level (marked by red arrows) suggest a strong supply zone. Price has failed to close above this zone multiple times, indicating sellers are firmly in control here. --- 🔵 2. Key Support Zone (~$3,310–$3,320) This green zone has acted as a reliable demand area, shown by blue arrows where price consistently bounced. However, the more frequent tests of support indicate that it may soon break, weakening the buyers' defense. --- ⛅ 3. Ichimoku Cloud Analysis Price is hovering below or inside the cloud, suggesting bearish to neutral momentum. The cloud is relatively thin, which could mean low support for bullish moves and a potential sharp bearish continuation. --- 📉 4. Lower Highs Structure The market is forming lower highs, a classic sign of distribution and bearish trend development. Sellers are stepping in earlier at lower prices, reducing upside potential. --- 🟨 5. Accumulation Phase (Yellow Box) A sideways consolidation phase occurred previously, leading to a bullish breakout. Currently, there's no similar base being built, which increases the risk of a breakdown, rather than reversal. --- 🧐 6. Bearish Projection The black arrow suggests a forecasted break below support, potentially targeting the $3,280–$3,300 area. A confirmed break below $3,320 with strong volume would validate this bearish scenario. --- 📌 Conclusion This chart reflects a bearish bias with weakening bullish attempts. Watch for: Break and close below $3,320 → Confirmation of bearish trend continuation. Failure to break support → Could trigger another bounce, but upside remains limited below $3,370.
