
Sajefallah
@t_Sajefallah

What symbols does the trader recommend buying?
Purchase History
پیام های تریدر
Filter
Signal Type
Sajefallah

Hello everyone, Today, I'm sharing a classic long setup analysis for Gold (XAUUSD) on the 30-minute timeframe. This setup is built entirely on the powerful Smart Money Concepts (SMC) / ICT framework, which helps us understand the institutional order flow and the actions of major market players Step-by-Step Breakdown of the Bullish Scenario: This setup consists of three key, classic stages: 1. Liquidity Engineering & HUNT: As you can see on the chart, the price first made an intelligent move below the significant previous lows (the HUNT area), sweeping the sell-side liquidity that had built up (marked with $$$$$$$$$$). This move is designed to trigger the stop-losses of retail traders, allowing institutional players to fill their buy orders at a discount. 2. Market Structure Shift (mms): Immediately following the liquidity hunt, we witnessed a powerful impulsive move to the upside, which broke through a significant previous lower high (the mms point). This is our most critical confirmation that the order flow has shifted from bearish to bullish, indicating that buyers have now taken control of the market. 3. Return to Demand Zone (The Entry): Currently, the price is in a natural corrective phase or pullback, retracing to the origin of the bullish impulse. This area, identified as an Internal Order Block (Internal OB), serves as our primary Point of Interest (POI) or Demand Zone. This is where we anticipate smart money to step back in to defend their positions, providing us with a high-probability entry point to align with them. The Trade Plan: Entry: 3,363.112 (Entering within the upper range of the demand zone). Stop Loss: 3,349.196 (This SL is placed logically below the Internal OB. A break below this level would invalidate our bullish scenario). Take Profit: 3,402.495 (The target is set at a key buy-side liquidity pool or a previous high, where the price is likely to be drawn to). Risk Management Disclaimer: This analysis represents my personal viewpoint and is for educational purposes only. It should not be considered a financial signal to buy or sell. Please conduct your own due diligence and practice strict risk and money management before entering any trade. I hope you find this analysis insightful. I would love to hear your thoughts and perspectives in the comments below. If you liked this idea, please support me with a Like and Follow!
Sajefallah

Symbol: XAU/USD Timeframe: 15 Minutes (15m) Trade Direction: Short (Sell) Exact Entry Price: 3,295.254 Entry Rationale: This point is located within the FVG (Fair Value Gap) and at the 78.0% Fibonacci level (Optimal Trade Entry - OTE zone), which has a high potential for a price reaction and attracting sell orders. Exact Stop Loss: 3,305.953 Stop Loss Rationale: This price is set slightly above the high of the bearish Order Block and also above the Swing High at 3,302.658 to protect the trade from a potential liquidity grab (Stop Hunt). Exact Take Profit (TP1): 3,270.916 Take Profit Rationale: This target is set at the recent low. This area acts as a sell-side liquidity pool and is the next logical target for the price after pulling back to the supply zone.
Sajefallah
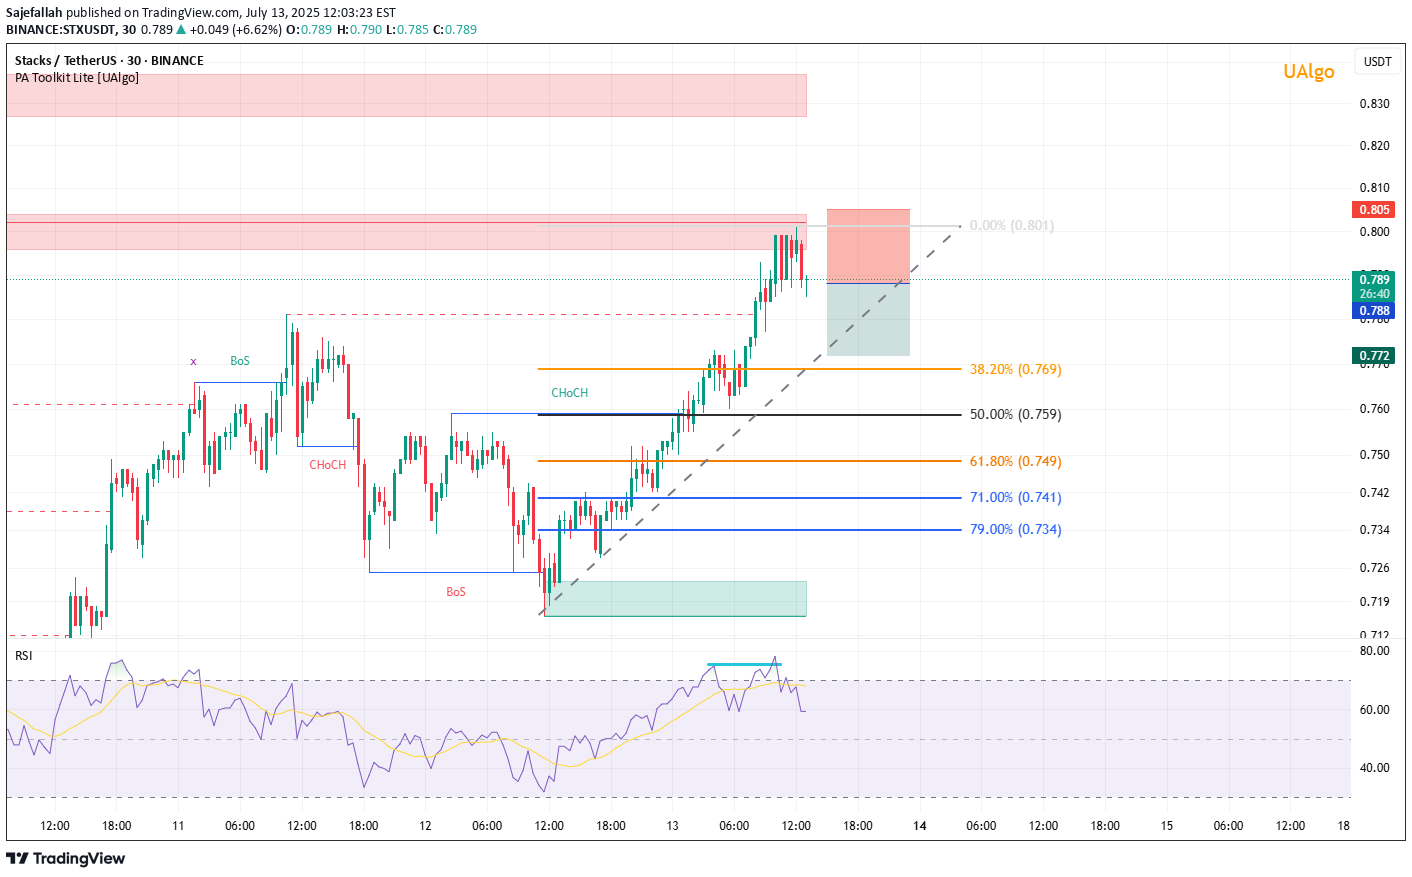
Analysis & Rationale: A high-probability short opportunity is forming on the STX/USDT 30-minute chart, primarily driven by a clear Bearish Divergence signal. While the price has registered a Higher High (HH), the Relative Strength Index (RSI) has failed to confirm this momentum, printing a Lower High (LH). This divergence indicates weakening buying pressure and a potential trend reversal or significant correction. The price is currently reacting to a key supply/resistance zone (red box), which coincides with the RSI exiting the overbought territory. This confluence of signals strengthens the case for a bearish move. Trade Setup: Asset: STX/USDT Timeframe: 30 Minutes Direction: Short / Sell Signal: Bearish Divergence Execution Plan: Entry Zone: Enter the short position near the current levels, within the supply zone (approximately $0.785 - $0.801). Stop Loss: Place the Stop Loss just above the recent swing high to protect against a setup invalidation (e.g., at $0.805 or slightly above). Take Profit Targets: Targets are based on the Fibonacci Retracement levels drawn from the previous swing low to the current high. TP1: $0.769 (38.2% Fib. level) TP2: $0.759 (50.0% Fib. level) TP3: $0.749 (61.8% Fib. level) Disclaimer: This analysis is for educational purposes only and does not constitute financial advice. Trading involves significant risk. Always conduct your own research and manage your risk appropriately.
Sajefallah
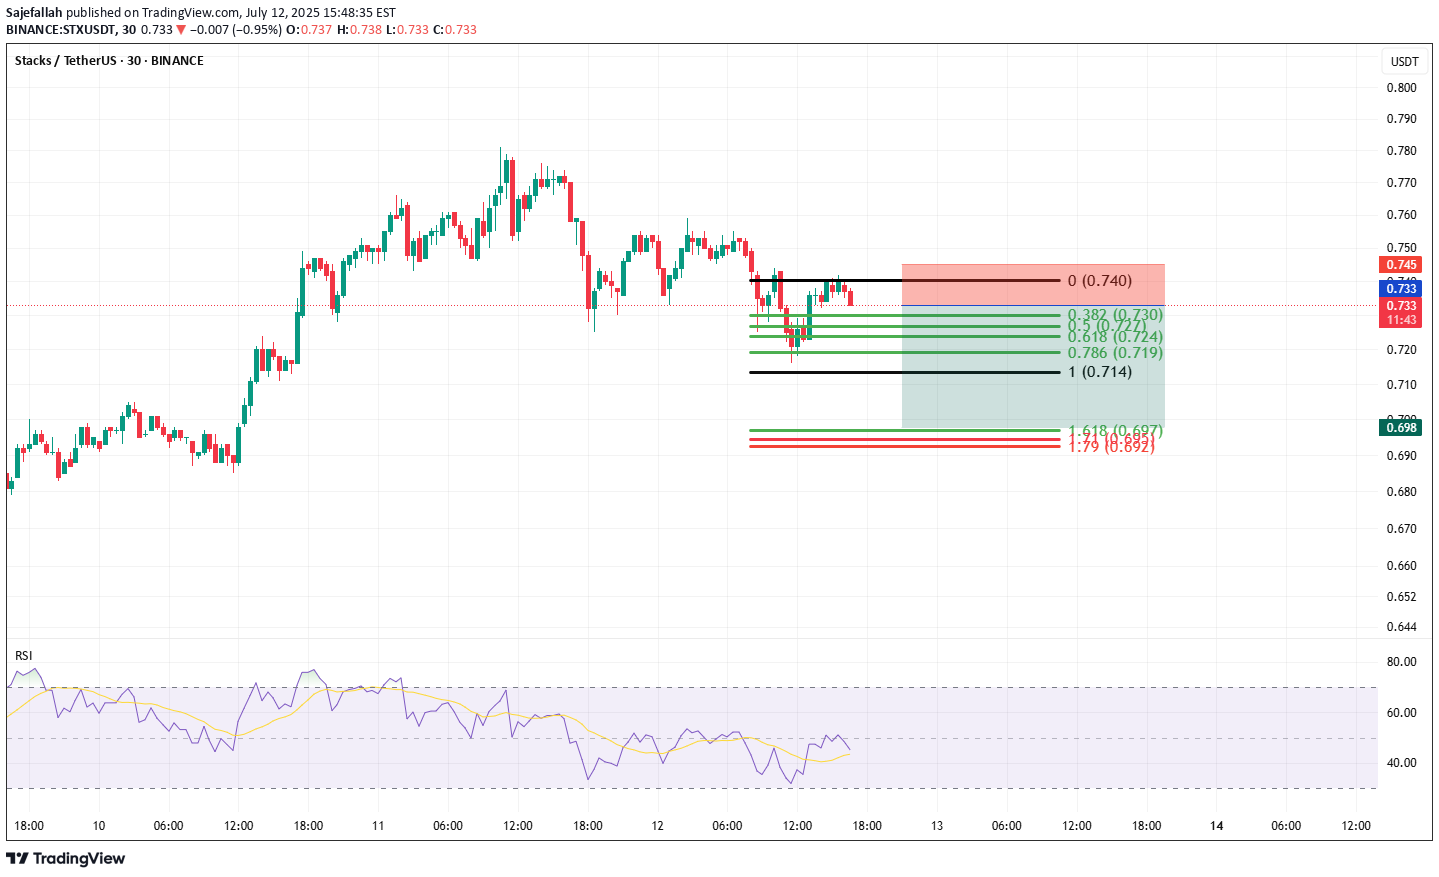
Please provide a detailed technical analysis of the short trade setup illustrated in the attached image for STX/USDT on the 30-minute chart. Your analysis should break down the following key components of the setup: Market Structure and Pattern: Describe the dominant chart pattern, which is a descending channel. Explain how the price action confirms this pattern. Entry Strategy: Explain the logic behind the entry point. Specifically, discuss how it creates a "confluence of resistance" by aligning the channel's upper trendline with the Fibonacci retracement levels (drawn from the 0.740 high to the 0.714 low). Risk Management (Stop Loss): Analyze the placement of the stop loss, indicated by the red box above the 0.740 swing high. Explain why this level serves as a logical invalidation point for the bearish trade idea. Profit Target (Take Profit): Detail the rationale for the take-profit target, indicated by the green box. Explain how it aligns with the Fibonacci extension levels (specifically the 1.618 level at 0.697) as a potential target for the next bearish impulse wave. Overall Assessment: Provide a summary of the trade's logic, evaluating its strengths, such as trading with the short-term trend and having a favorable risk/reward ratio.
Sajefallah
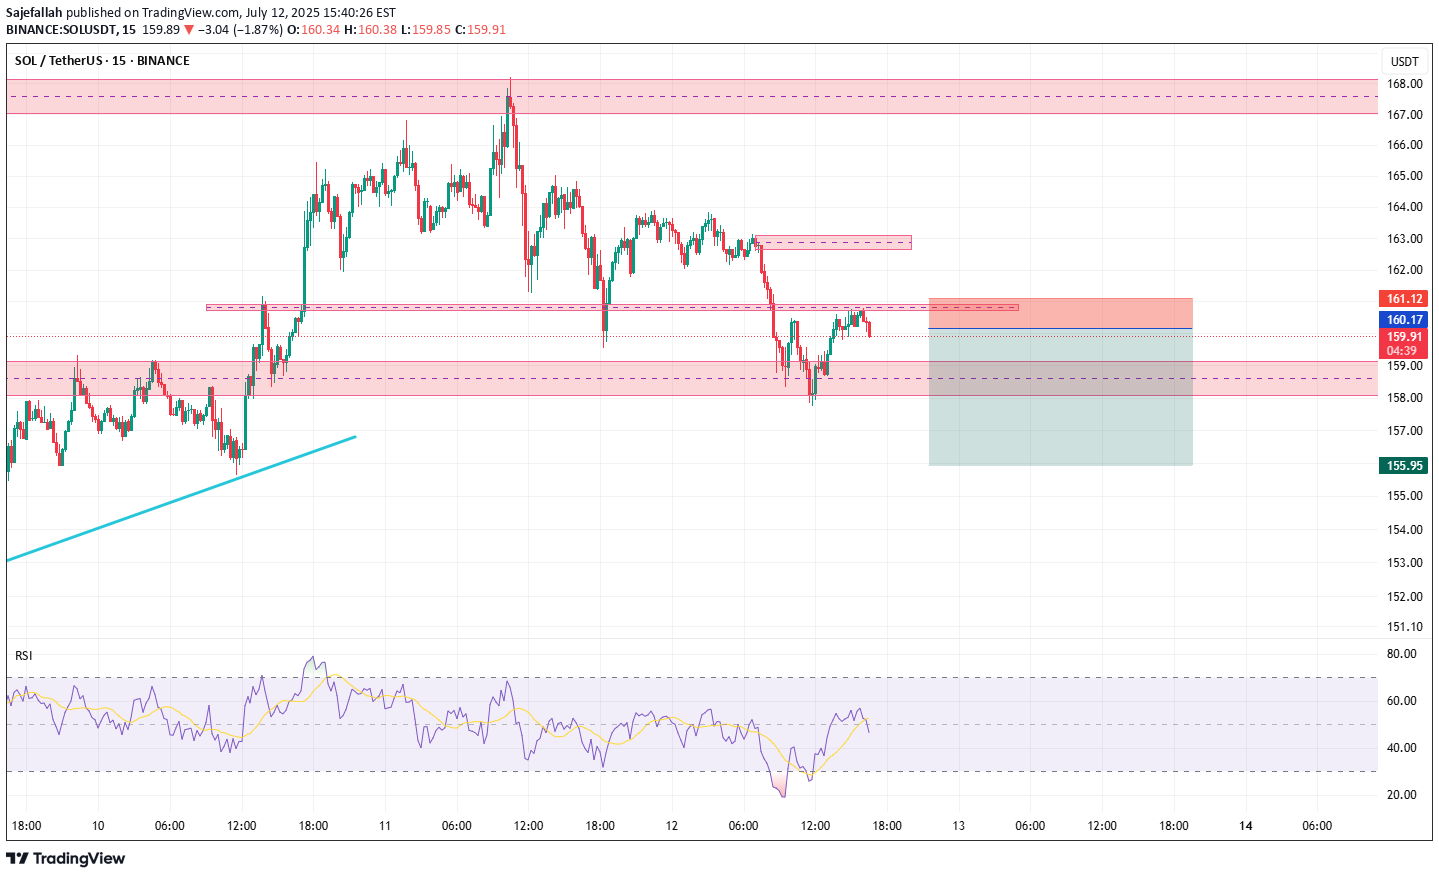
This trading setup outlines a short-term, or scalp, short position on the SOL/USDT pair on the 30-minute timeframe. The logic is fundamentally based on a confirmed market structure shift from bullish to bearish. Technical Analysis of the Setup Components: Ascending Trendline Break: The first warning signal is the decisive break of the primary ascending trendline (green line). This indicates a weakening of buyer strength and a loss of bullish momentum. Change of Character (CHoCH): Following the trendline break, the price failed to create a new higher high. Instead, it formed a lower low than the previous one, signaling a "Change of Character" in the market structure from bullish to bearish. This is a key signal to start looking for short opportunities. Break of Structure (BoS) Confirmation: By breaking a significant prior support level, the price created a bearish "Break of Structure" (BoS). This move confirms the new downtrend and suggests that sellers are now in control of the market. Strategic Entry Point: The entry is set at $161.12. This area represents a broken support zone that is now expected to act as resistance (a classic Support-Resistance Flip). Entering on a pullback to this broken structure is a high-probability strategy for joining the new trend. Risk and Reward Management: Stop Loss (SL): The stop loss is placed at $162.07, just above the most recent lower high. This is a logical placement, as a price move above this level would invalidate the current bearish scenario. Take Profit (TP): The take profit is targeted at $156.90, near the next major support or demand zone, making it a reasonable objective for the bearish leg. Risk/Reward (R/R) Ratio: The setup offers an excellent risk/reward ratio of 4.44 to 1. This means the potential profit is more than four times the potential loss, which is highly favorable from a risk management perspective.
Sajefallah
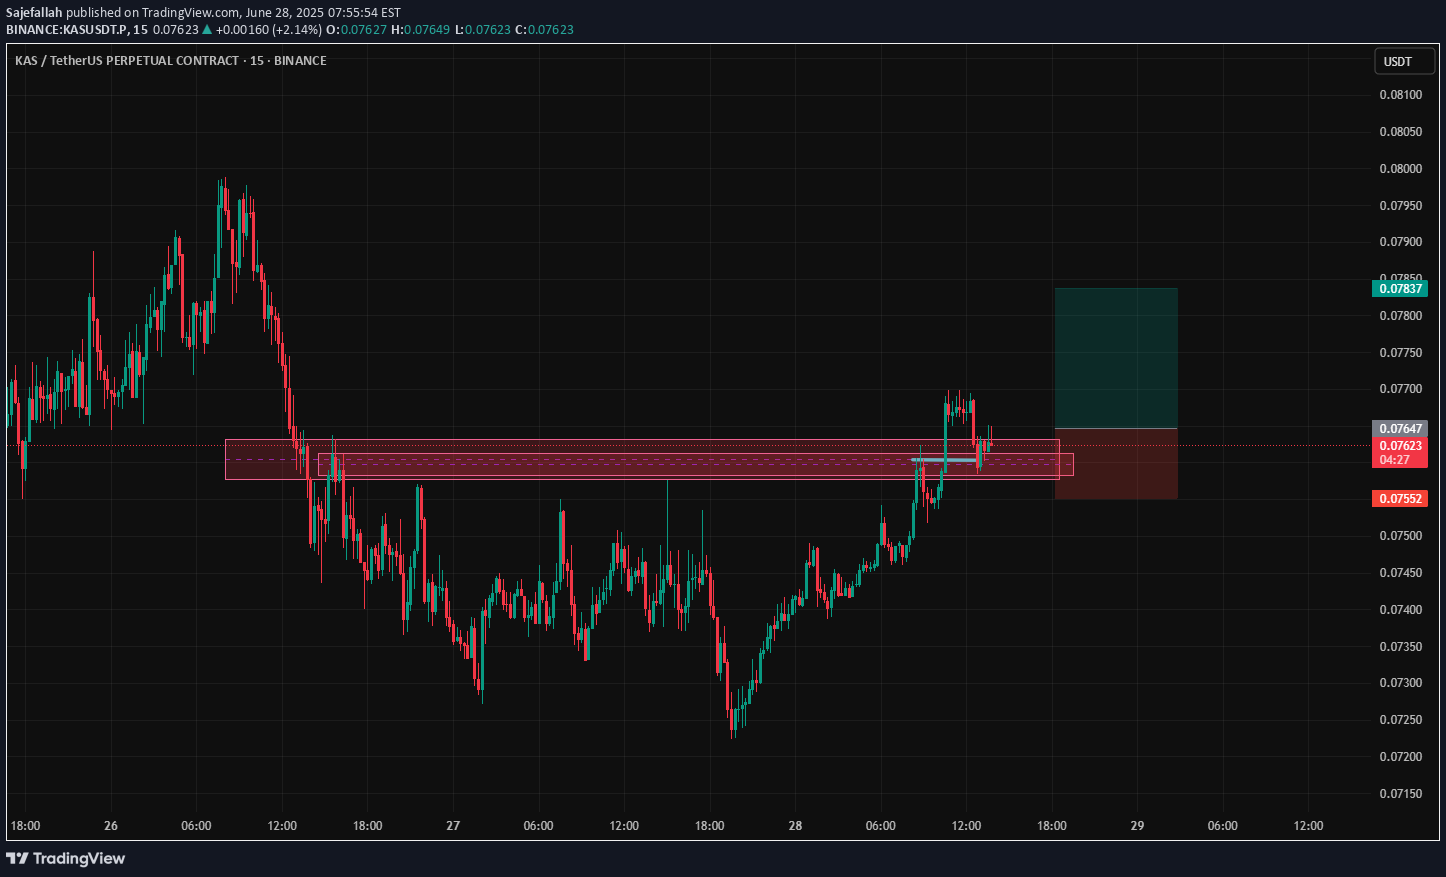
Key Levels on the Chart:Broken Resistance Turned Support:Around the 0.07520 – 0.07600 zone, there was a significant resistance area that has now been broken and is acting as new support (shown as a red box on the chart). Price broke above it with a strong candle and is currently consolidating above this zone.Current Price Level:The current price shown on the chart is 0.07647, sitting above the new support zone. This indicates buyers are still in control in the short term.Target Area:The green box on the chart marks a potential target zone, approximately around 0.07900 – 0.08000.Stop Loss:The stop-loss zone is set below the support area (within the red box), likely around 0.07520.Technical SummaryThe short-term trend on the 30-minute chart is bullish.A confirmed breakout above resistance suggests potential continuation upward.As long as price stays above ~0.07600, targets near 0.07900 – 0.08000 are reasonable.A drop back below ~0.07520 would invalidate the bullish setup and could trigger a deeper correction.Trading Perspective✅ If you’re already in a long trade around 0.07620 – 0.07640:Keep your stop-loss below 0.07520.Reasonable target is 0.07900 – 0.08000.If candles start closing weakly back below the support zone, consider exiting early.⚠️ Important Note:Volume was strong on the breakout candle but has decreased slightly afterward. If volume remains low, there’s a risk of a deeper pullback.Since this is a lower timeframe, price can be volatile, so always manage your risk properly.
Sajefallah
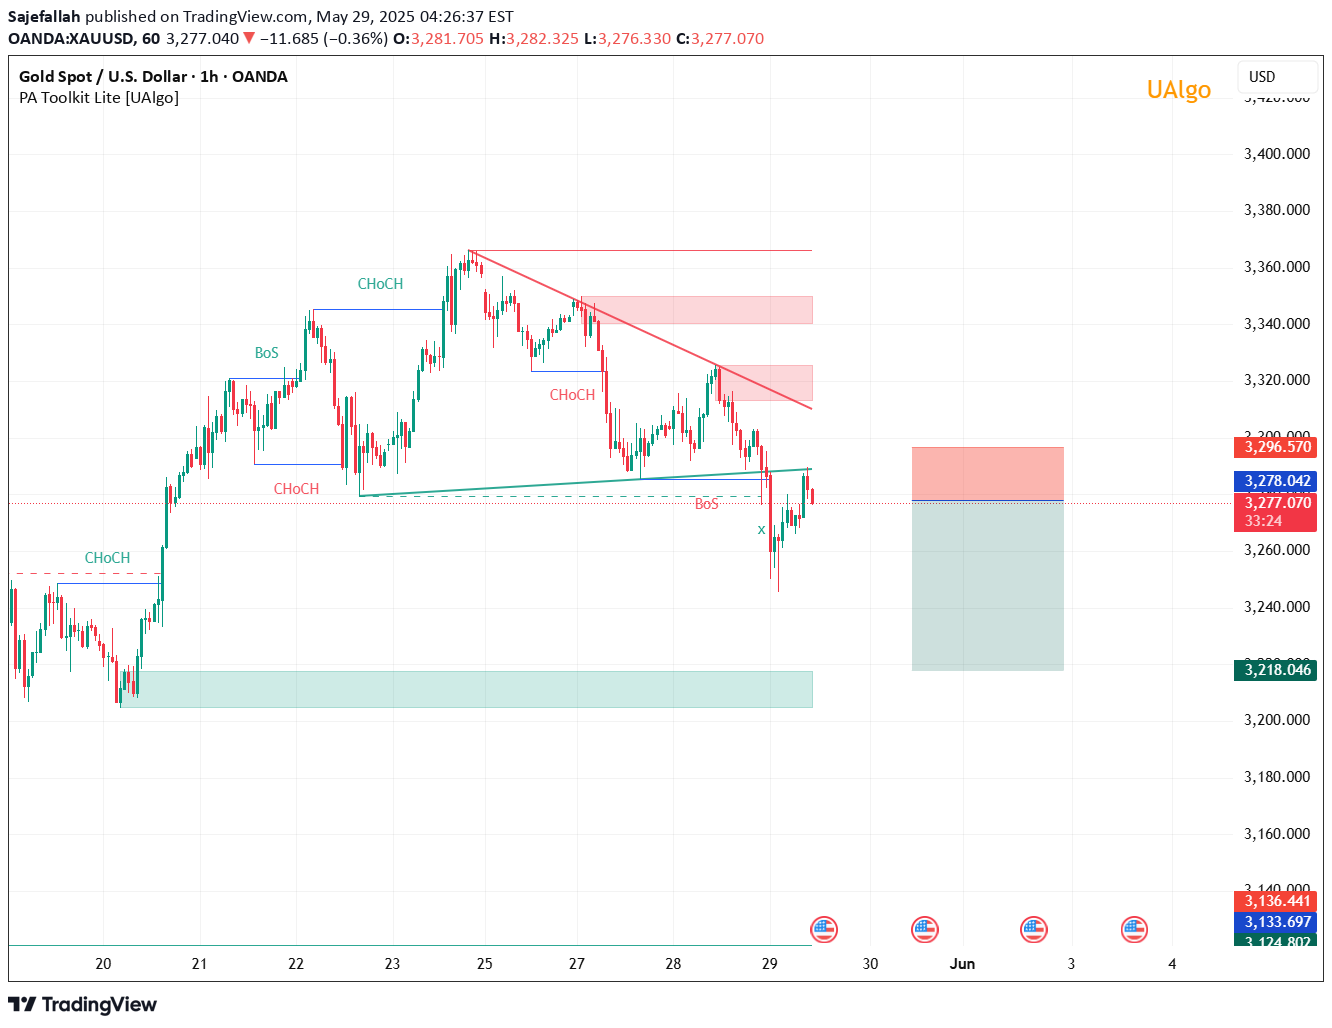
📉 Market Structure Analysis:The market was previously in an uptrend, confirmed by BoS and CHoCH.Then, a bearish shift occurred with a BoS to the downside and the break of the ascending trendline.A valid descending structure is now in play.Price retraced into a supply zone, where selling pressure is visible.The most recent BoS to the downside confirms a bearish bias.Currently, the price is forming a potential lower high under the trendline and may continue lower toward the demand zone at ~3218.046.📌 Trade Setup:Entry (Sell): Around 3278 level.Stop Loss (SL): Placed above the supply zone, around 3296.Take Profit (TP): Targeting the demand zone near 3218.This setup offers a good risk-to-reward ratio.📊 Conclusion:✅ Primary Scenario: Bearish continuation toward the demand zone (~3218), with selling pressure likely to dominate below the trendline.⚠️ Alternative Scenario: If price breaks and closes above 3296, the bearish structure may be invalidated, and a shift back to bullish momentum is possible.
Disclaimer
Any content and materials included in Sahmeto's website and official communication channels are a compilation of personal opinions and analyses and are not binding. They do not constitute any recommendation for buying, selling, entering or exiting the stock market and cryptocurrency market. Also, all news and analyses included in the website and channels are merely republished information from official and unofficial domestic and foreign sources, and it is obvious that users of the said content are responsible for following up and ensuring the authenticity and accuracy of the materials. Therefore, while disclaiming responsibility, it is declared that the responsibility for any decision-making, action, and potential profit and loss in the capital market and cryptocurrency market lies with the trader.