Technical analysis by Sajefallah about Symbol KAS: Buy recommendation (6/28/2025)

Sajefallah
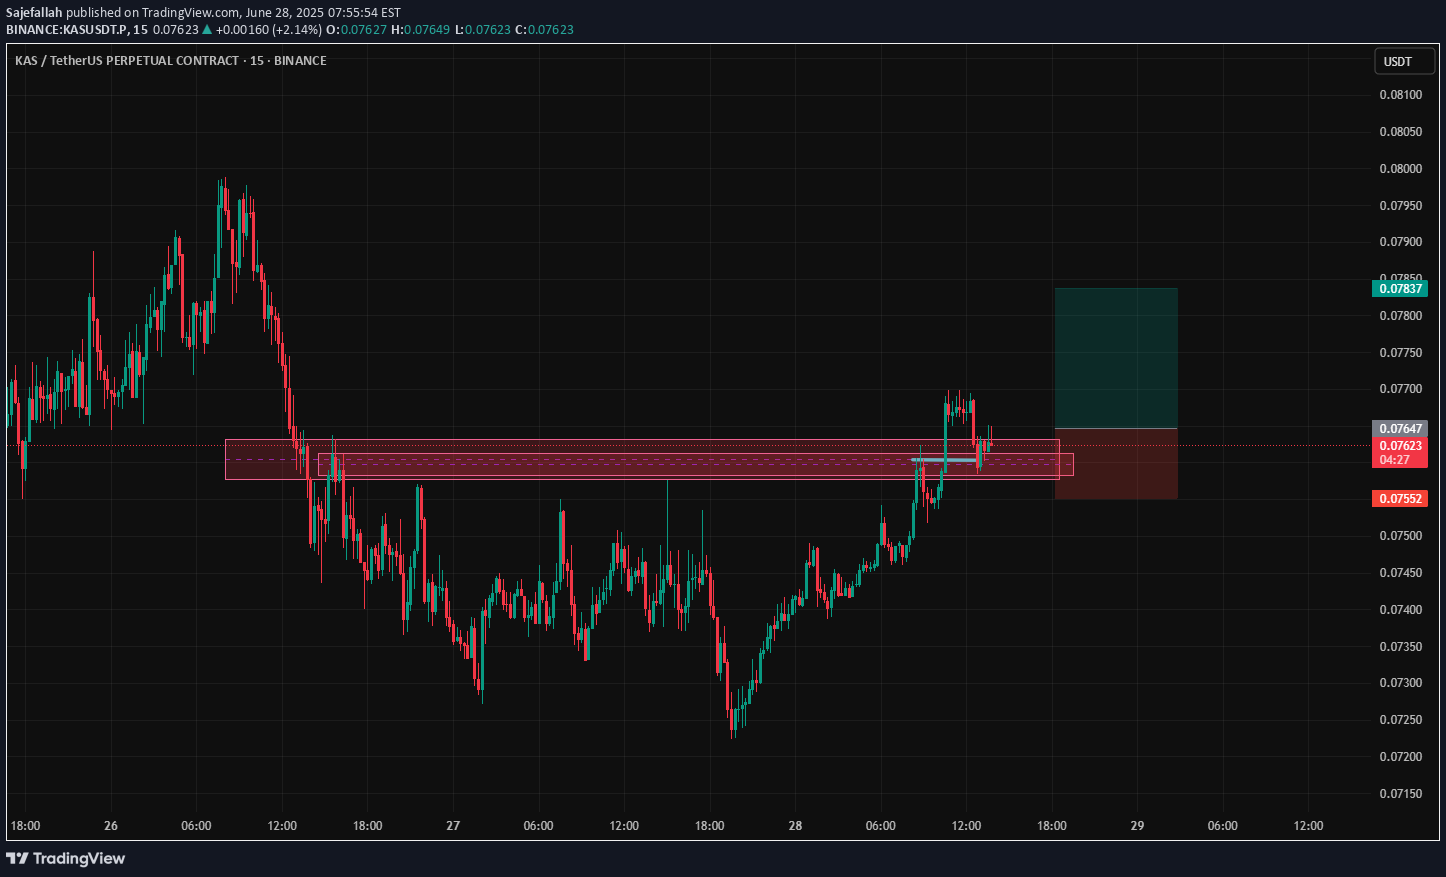
Key Levels on the Chart:Broken Resistance Turned Support:Around the 0.07520 – 0.07600 zone, there was a significant resistance area that has now been broken and is acting as new support (shown as a red box on the chart). Price broke above it with a strong candle and is currently consolidating above this zone.Current Price Level:The current price shown on the chart is 0.07647, sitting above the new support zone. This indicates buyers are still in control in the short term.Target Area:The green box on the chart marks a potential target zone, approximately around 0.07900 – 0.08000.Stop Loss:The stop-loss zone is set below the support area (within the red box), likely around 0.07520.Technical SummaryThe short-term trend on the 30-minute chart is bullish.A confirmed breakout above resistance suggests potential continuation upward.As long as price stays above ~0.07600, targets near 0.07900 – 0.08000 are reasonable.A drop back below ~0.07520 would invalidate the bullish setup and could trigger a deeper correction.Trading Perspective✅ If you’re already in a long trade around 0.07620 – 0.07640:Keep your stop-loss below 0.07520.Reasonable target is 0.07900 – 0.08000.If candles start closing weakly back below the support zone, consider exiting early.⚠️ Important Note:Volume was strong on the breakout candle but has decreased slightly afterward. If volume remains low, there’s a risk of a deeper pullback.Since this is a lower timeframe, price can be volatile, so always manage your risk properly.
