
SafeCryptoSignals
@t_SafeCryptoSignals

What symbols does the trader recommend buying?
Purchase History
پیام های تریدر
Filter
SafeCryptoSignals
BNB Surges by 131% to $721 – A Prediction Fulfilled!

The cryptocurrency BNB has delivered an extraordinary rally, soaring by 131% to reach an impressive price of $721. This massive rise is a testament to the strength of the market and the accuracy of our analysis. In our **last signal published on May 30, 2023, we forecasted this bullish move when BNB was trading at just $312. The anticipated growth materialized perfectly, aligning with our detailed analysis and market projections. This achievement underscores the importance of strategic insights and the ability to identify potential opportunities in the cryptocurrency space. As BNB continues to gain momentum, we remain confident in its long-term potential. For those who followed our signal, this is a moment of triumph, validating the power of precise predictions.
SafeCryptoSignals
ALGOUSDT Surges by 82.83%

The cryptocurrency ALGOUSDT has experienced a powerful rally, rising by an impressive 82.83% and achieving a price of $0.21900. This significant growth marks the successful attainment of the second target, reinforcing its bullish momentum. Despite reaching this milestone, ALGOUSDT shows no signs of slowing down, with the uptrend still intact. The trade remains open, as further potential for upward movement is anticipated. This remarkable performance highlights the strength and optimism in the market for ALGOUSDT. Traders are encouraged to monitor this dynamic asset closely.
SafeCryptoSignals
Bitcoin Skyrockets to $93,000: A Predicted Rally

Bitcoin has recently surged to an impressive $93,000, marking a significant growth percentage since our last forecast. Back in our August 4th signal, we anticipated this substantial increase when Bitcoin was trading at $58,000. At that time, market indicators showed strong bullish momentum, which aligned with our analysis and suggested an upcoming rally. We highlighted that if Bitcoin sustained its momentum, it could reach new highs. Today, those projections have materialized, proving the accuracy of our insight. This rally reinforces the positive sentiment surrounding Bitcoin and the broader digital asset market, affirming our strategic outlook for Bitcoin's price movement.
SafeCryptoSignals
ALGO/USDT Prime Buy Opportunity Strong Rebound Potential

The cryptocurrency pair ALGO/USDT has shown significant signs of potential upward momentum, making it an intriguing opportunity for buyers in the medium term. Currently priced at 0.11975, ALGO appears to be forming a strong support level at this price range after a series of corrective moves. Several technical indicators signal a promising scenario for a price rebound. The Relative Strength Index (RSI) is hovering in the oversold territory, suggesting that selling pressure may be diminishing, which often precedes a reversal or a bounce-back in price. Furthermore, the Moving Average Convergence Divergence (MACD) has shown signs of bullish divergence on the daily chart, with the MACD line nearing a crossover above the signal line. This movement hints at a potential change in momentum from bearish to bullish. In addition, ALGO's price is nearing the lower Bollinger Band, which typically acts as a support level, indicating that it could be undervalued at the current price. Volume analysis further strengthens this outlook; there has been a gradual increase in buying volume, suggesting that traders are beginning to accumulate positions at these low levels. This could lead to an upward move as the market digests this accumulation phase. Given these indicators, the current pullback may be a compelling entry point for long-term buyers looking to capitalize on a medium-term upward trend. Investors might consider this price level a buying opportunity, with expectations for a strong bullish movement as ALGO/USDT gains momentum.
SafeCryptoSignals
DOGSUSDT: A Bullish Breakthrough Awaits

DOGSUSDT has recently shown promising upward momentum, currently trading at $0.000733. Several indicators suggest that this trend could continue. Firstly, the Relative Strength Index (RSI) is hovering around 65, indicating that DOGSUSDT is approaching the overbought territory but still has room for growth before hitting resistance. A reading above 70 typically signals overbought conditions, suggesting potential profit-taking; however, the current RSI indicates that bullish momentum is still prevalent. Secondly, moving averages (MAs) paint a positive picture. The short-term 20-day MA has crossed above the longer-term 50-day MA, a pattern often referred to as a "golden cross." This is a classic bullish signal suggesting that the upward trend is likely to gain further strength. Additionally, trading volume has significantly increased over the past few days, which typically confirms the sustainability of a price increase. A rise in volume often indicates heightened interest and investor confidence in the asset, reinforcing the bullish outlook. Lastly, the overall market sentiment remains optimistic, driven by growing interest in meme coins, of which DOGSUSDT is a part. Social media discussions and community engagement have surged, which historically correlates with price rallies for cryptocurrencies in this niche. In conclusion, based on the RSI, moving averages, and trading volume, the indicators are favoring a bullish outlook for DOGSUSDT. If the price maintains above $0.000700, it could set the stage for further gains, potentially reaching new resistance levels in the near term.
SafeCryptoSignals
BBUSDT Set for a Bullish Breakout Key Indicators Signal Growth

The recent upward trend in BBUSDT's price, currently at 0.3076, indicates a potential bullish movement. Several technical indicators support this trend. First, the Relative Strength Index (RSI) is showing values near the 70 mark, suggesting increasing buying pressure and the possibility of entering an overbought zone. This often indicates that momentum is building, pushing the price higher. Additionally, the Moving Averages (MA) show positive signals. The 50-day MA is currently below the price, which often suggests a continuation of upward momentum. If the 200-day MA crosses below the 50-day MA in a Golden Cross pattern, it could be a strong signal for a longer-term bullish trend. The Moving Average Convergence Divergence (MACD) is another crucial indicator that supports the upward movement. The MACD line has recently crossed above the signal line, which is typically a bullish signal, indicating that the coin is gaining momentum. Lastly, the Bollinger Bands suggest increased volatility with the price touching the upper band, which could indicate that BBUSDT is in an upward breakout. With growing volume and positive sentiment in the broader market, the price of BBUSDT may continue to rise in the short term. However, traders should also monitor resistance levels and market conditions to avoid sudden corrections.
SafeCryptoSignals
ZROUSDT Poised for a Breakout: Bullish Indicators Signal Growth
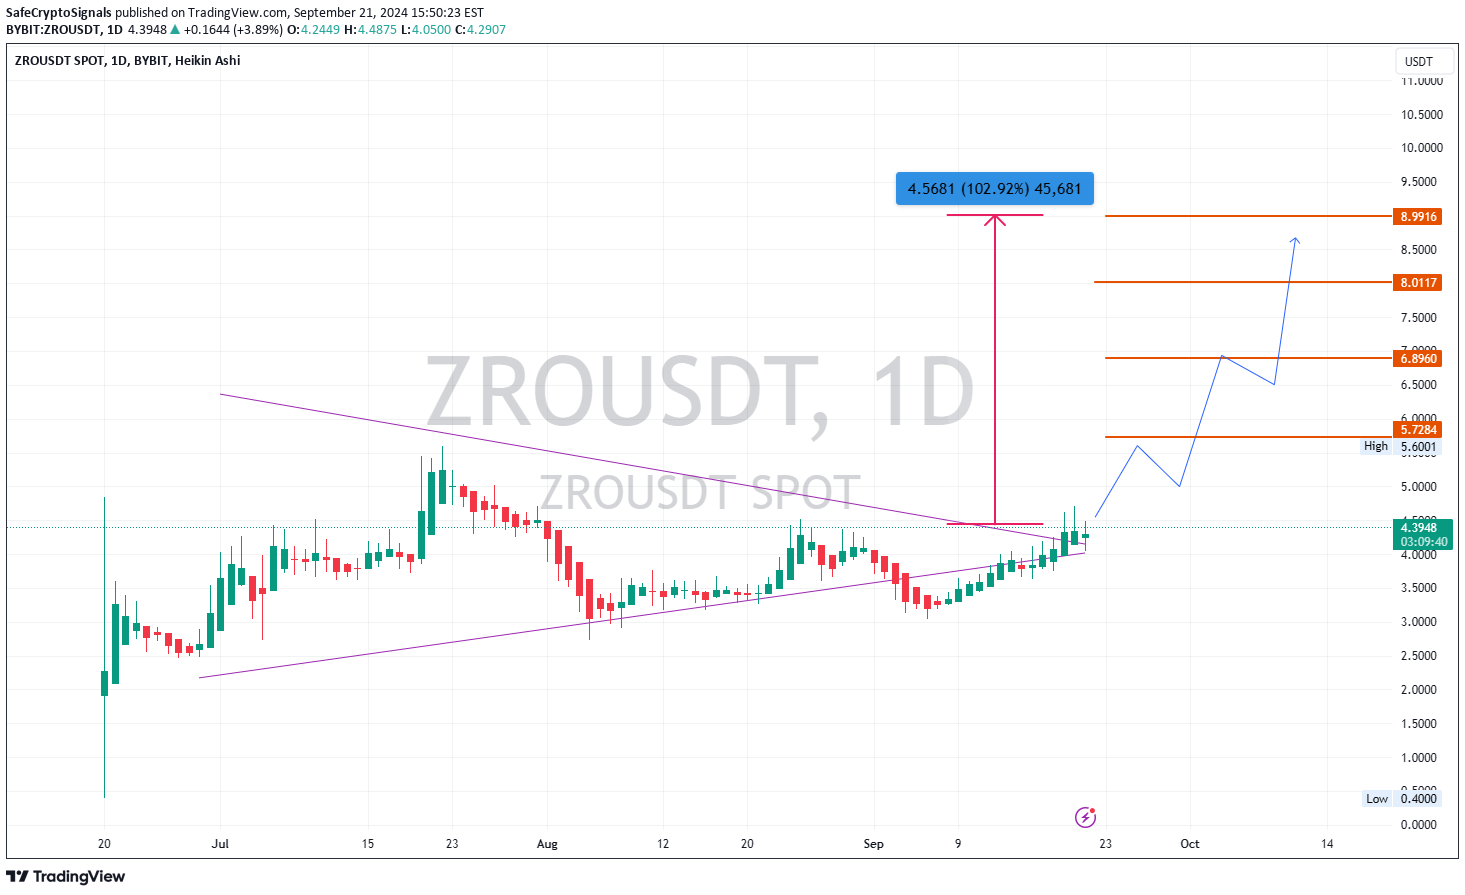
The recent upward movement in ZROUSDT, currently priced at 4.4000, is showing strong bullish momentum supported by several key technical indicators. First, the **Relative Strength Index (RSI)** is hovering around the 65-70 range, which suggests that the asset is nearing overbought territory but still has room to grow before a potential correction. Historically, ZRO has seen continued growth when the RSI moves above 70, indicating potential for further upward movement. Additionally, the **Moving Average Convergence Divergence (MACD)** line has crossed above the signal line, a classic bullish signal indicating a shift in market sentiment toward buying pressure. The MACD histogram is also expanding, reflecting increasing momentum. The **50-day Simple Moving Average (SMA)** has crossed above the 200-day SMA in a "Golden Cross" pattern, signaling the potential for a long-term uptrend. This is often viewed as a strong buy signal for traders looking to capture gains during extended rallies. Volume levels have been increasing consistently, confirming that this rise in price is supported by significant market participation. This uptick in volume suggests that the buying interest is genuine and not the result of low-volume market manipulation. With these indicators aligning, the likelihood of ZROUSDT breaking above key resistance levels in the near future is high, suggesting continued upward potential for the asset.
SafeCryptoSignals
XLMUSDT LONG scalping

XLMUSDT LONG Entry : 0.0892 / 0.0893 Leverage : Cross X20 Stop loss : 3.5% Targets : 0.0924255 Capital invested : 1%
SafeCryptoSignals
WLDUSDT Bullish Momentum Building Toward $1.60

WLDUSDT is currently trading at $1.4585, and several technical indicators suggest a bullish trend is forming. The Relative Strength Index (RSI) is approaching the 60 level, indicating growing bullish momentum and suggesting that buyers are gaining control. The Moving Average Convergence Divergence (MACD) line is also nearing a bullish crossover with the signal line, which is a classic sign of a potential upward movement. Additionally, WLDUSDT has established a strong support zone around $1.45, which has been tested multiple times and held firm, indicating a solid foundation for further price increases. The price is currently holding above its 50-day Moving Average, which has started to trend upwards, reinforcing the bullish outlook. This upward movement is also supported by an increase in trading volume, signaling strong accumulation at the current price level. The Bollinger Bands are beginning to narrow, suggesting that a breakout could be imminent. If the price breaks above the upper band, it could trigger a stronger upward move. Given these indicators, WLDUSDT appears to be on the verge of a significant rally, with the next potential target around the $1.55-$1.60 range. This makes the current price an attractive entry point for traders looking to capitalize on the anticipated upward momentum.WLDUSDT Soars by 96.90% and Hits Second Target! The cryptocurrency WLDUSDT has seen an impressive surge of 96.90% , reaching a new price of $2.8687 This remarkable rise confirms the second target was successfully hit, reflecting strong momentum in the market. Despite achieving this milestone, the trend indicates continued upward movement, showing no signs of slowing down. The trade remains open with potential for even further gains on the horizon. Traders are advised to stay vigilant as WLDUSDT continues its bullish trajectory. This rally showcases the strength and optimism surrounding the asset.
SafeCryptoSignals
TIAUSDT Soars to New Heights, Hitting All Targets at 5.900!

TIAUSDT has experienced a remarkable rally, reaching all set targets and surging to a price of 5.900. This bullish movement reflects strong market demand and positive sentiment among traders. The coin broke through multiple resistance levels, confirming the strength of its upward trend. Several technical indicators, including moving averages and RSI, signaled bullish momentum. The rally has attracted increased buying interest, pushing the price to new highs. Investors are now eyeing the next potential moves as TIAUSDT establishes itself at this elevated level.
Disclaimer
Any content and materials included in Sahmeto's website and official communication channels are a compilation of personal opinions and analyses and are not binding. They do not constitute any recommendation for buying, selling, entering or exiting the stock market and cryptocurrency market. Also, all news and analyses included in the website and channels are merely republished information from official and unofficial domestic and foreign sources, and it is obvious that users of the said content are responsible for following up and ensuring the authenticity and accuracy of the materials. Therefore, while disclaiming responsibility, it is declared that the responsibility for any decision-making, action, and potential profit and loss in the capital market and cryptocurrency market lies with the trader.