
SaeidKarimzadeh
@t_SaeidKarimzadeh

What symbols does the trader recommend buying?
Purchase History
پیام های تریدر
Filter
SaeidKarimzadeh
Mr.Zecash Loves 61.8
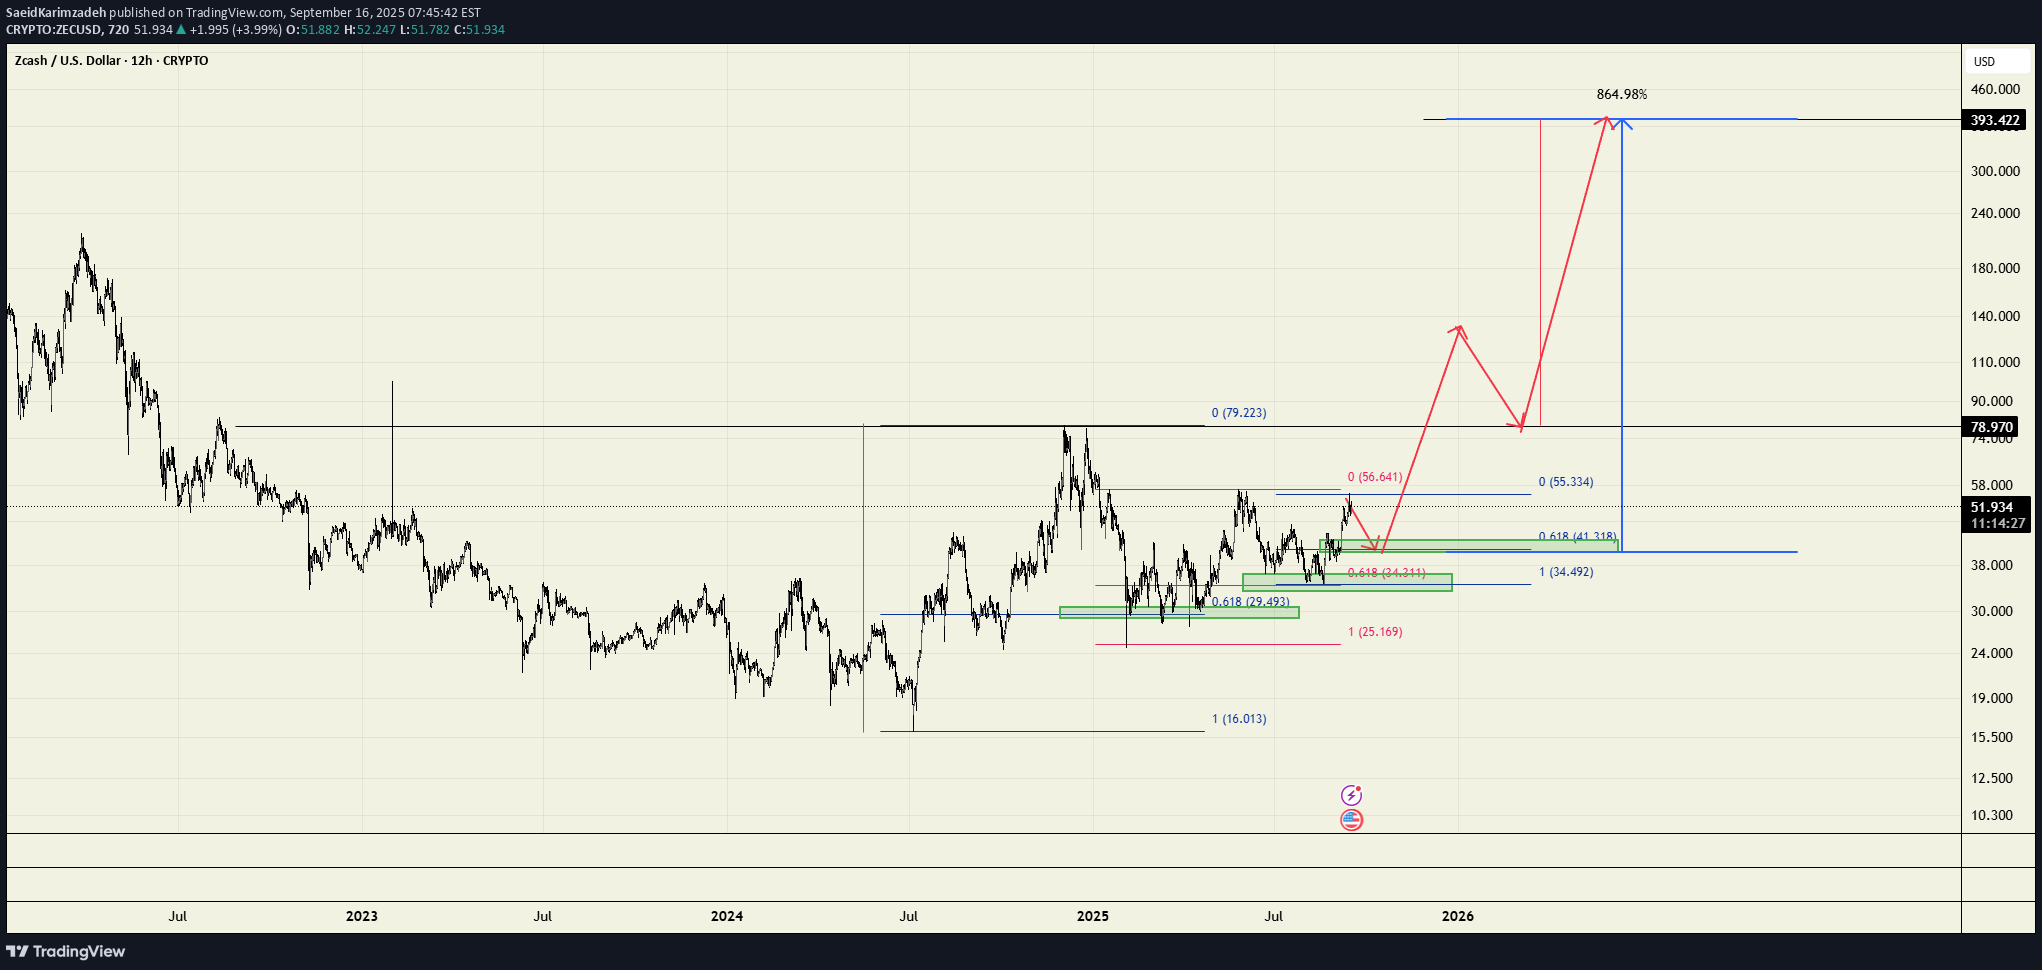
Zcash has provided us with a very rare pattern its 3 cup and handles inside one another. we now know that it loves to hold support at the 61.8 % fib level on the previous 2 retracements. so we have to wait and respect its wishes and join it at the 61.8 % fib level. the target on this move is pretty decent .
SaeidKarimzadeh
short setup on aave

after a monster rally , we can expect the pullback to continue to the 38.2% fib potential move to 36 usd
SaeidKarimzadeh
Verge on the verge of a massive Run

A simple EW structure. RSI monthly break out is the confirmation
SaeidKarimzadeh
Dash - The forgotten beast

A very simple Elliot wave count for dash. Dash finds itself at a very critical level right above the 16 usd Wave 1 Top. following the rules of EW we know that it must hold above wave 1 top. A clear ABC correction structure can be observed down from its 1600 usd high of wave3. If dash starts a new impulse wave ( wave 5) we could expect it do have a very significant rally from these lows. Ideally we could see it retest and break its ATH at 1600 .
SaeidKarimzadeh
Accumulation: Wyckoff Storj Usdt

Storj is showing signs of Wyckoff Accumulation. 55 cent is a strong support. a good spot buy for the duration of the bull run and could look for the taking out the highs around 1.2 and then 3.1 usd
SaeidKarimzadeh
Cup and handle ACHUSD

A very simple cup and handle set up on ACH with target. price is currently retesting support and a long could be done on the retest of the 4 hour 233 ema
SaeidKarimzadeh
Xrp Analysis

Looking back at the previous cycle. price tested the established support 2 times before starting the next big impulsive move up. for this cycle the Establishing support seems to be around (0.1-0.2 usd) one last test of this area would provide an excellent risk reward ratio to formulate a position. price is currently in a bear flag with the target of 0.12 usd. upper range of the bear flag could be tested 1 more time around 60 cents for the eventual break down. the price projections are only for visual purposes. the actual impulse could be a lot larger or even smaller(hopefully not) than that. good luck
SaeidKarimzadeh
BTC - a Wild speculative dream

simply a random crazy speculative chart . not financial advice :)
SaeidKarimzadeh

SaeidKarimzadeh
GRAND MASTER PLAN FOR EOS. Time to rise

Hello , This Idea on Eos is based on a simple Elliot wave count. The chart is pretty self explanatory as I have done most of the explanation on the chart the last wick down to approximately 2 usd , was a good test of the monthly support , if price can hold this 2 dollar level , we could be poised for a good impulse wave up. Start of intermediate wave 3 of the primary wave 3 , which is often the longest wave in the cycle. The risk reward here is very good as the covid lows have proven to be major support level across the crypto markets. A break of the march 2020 lows would be an invalidation of the trade setup I will update the idea with time, Disclaimer : This is not trading advice :) If this idea helps you and you feel generous would like tip me. here is my EOS address : binancecleos memo : 107043523 Any help is greatly appreciate. Best of luck and happy trading folks
Disclaimer
Any content and materials included in Sahmeto's website and official communication channels are a compilation of personal opinions and analyses and are not binding. They do not constitute any recommendation for buying, selling, entering or exiting the stock market and cryptocurrency market. Also, all news and analyses included in the website and channels are merely republished information from official and unofficial domestic and foreign sources, and it is obvious that users of the said content are responsible for following up and ensuring the authenticity and accuracy of the materials. Therefore, while disclaiming responsibility, it is declared that the responsibility for any decision-making, action, and potential profit and loss in the capital market and cryptocurrency market lies with the trader.