
SadarExplore
@t_SadarExplore

What symbols does the trader recommend buying?
Purchase History
پیام های تریدر
Filter
SadarExplore
GOLD New High Record Break
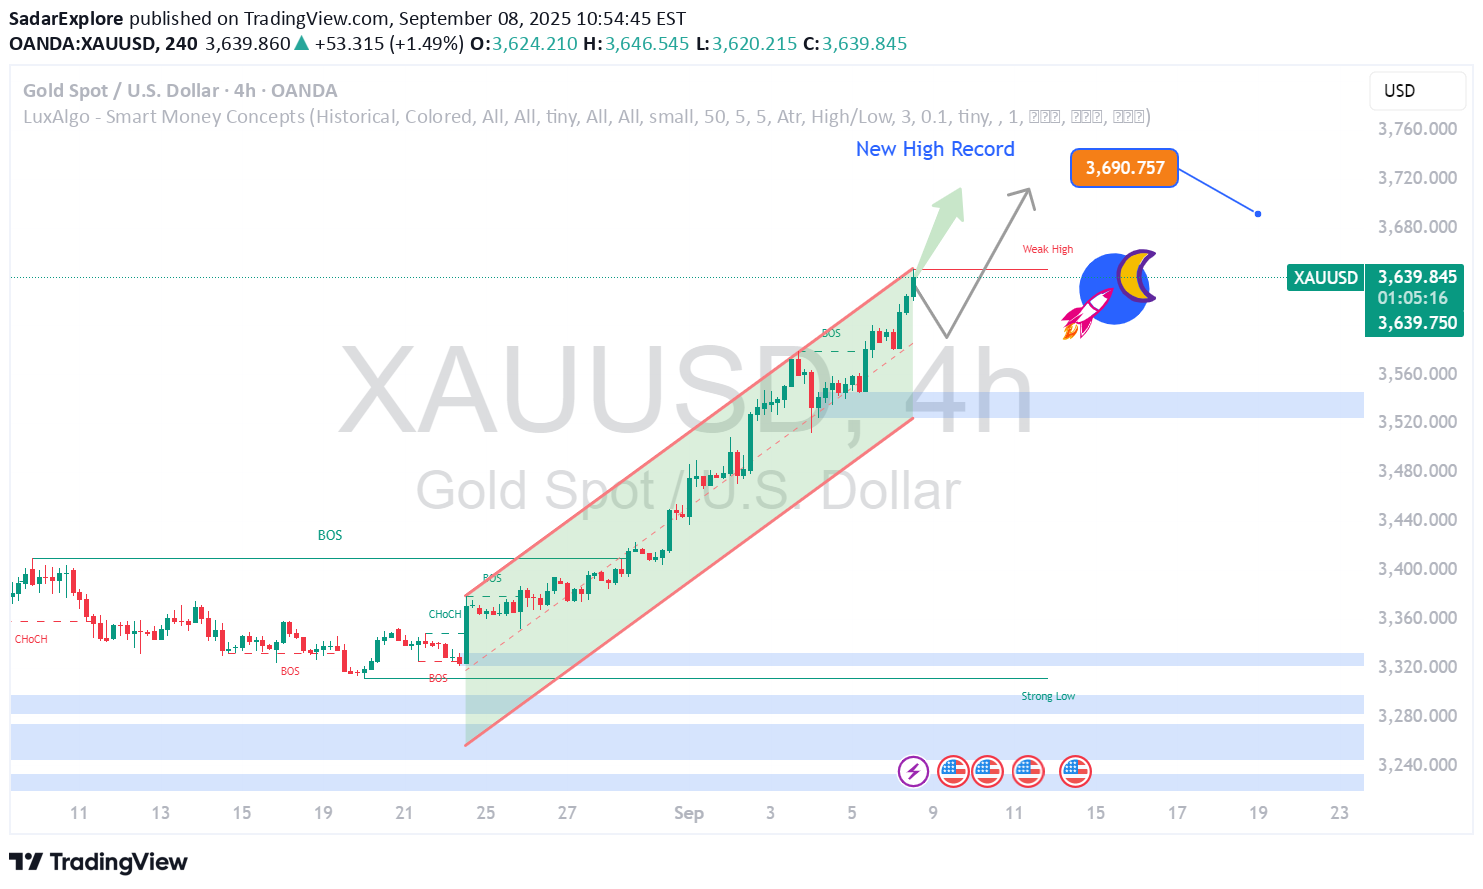
Gold New High on the Way! 🔥 Current Price: 3635 📈 Buy Entry Active — Target 3690 ✨ Gold is in full bullish control. ✨ Buyers pushing strongly toward new record highs. ✨ Market confidence remains unshaken. ✨ Every dip is being bought instantly. ✨ Strong fundamentals + technicals support upside. ✨ Next resistance is ready to be tested soon. ✨ A breakout above 3690 can open doors for even higher levels. ✨ This could be the start of another major rally. ⚡ Don’t wait — secure your position now before the breakout run begins!need your feed about this target
SadarExplore
Gold Under Pressure Time To Short XAUUSD?
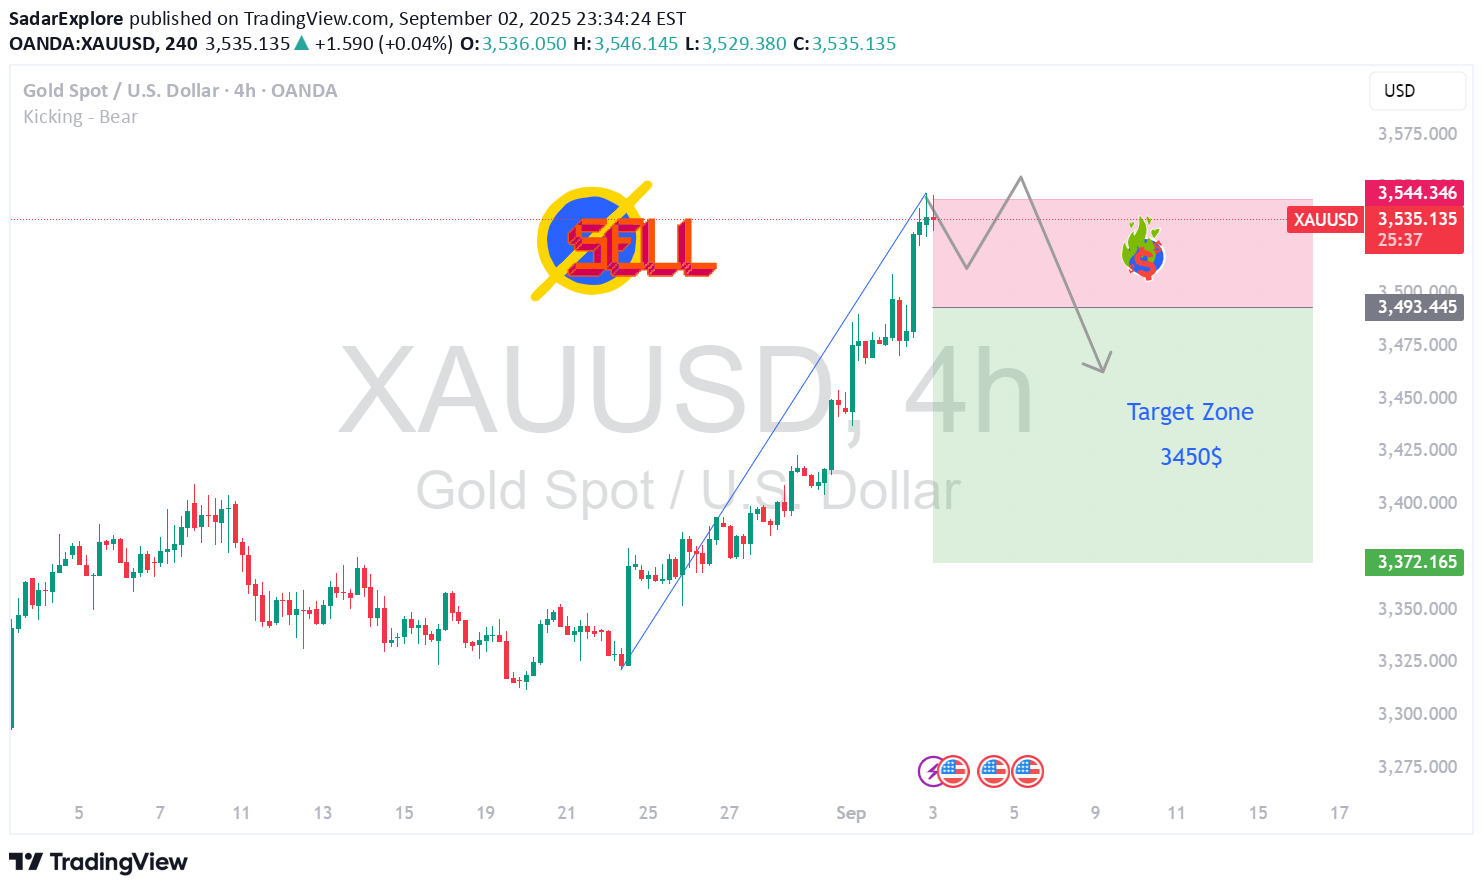
Gold (XAUUSD) is currently trading around 3533, and bearish momentum is gaining strength as sellers dominate the market. Price action indicates a strong rejection from the recent highs, signaling potential continuation to the downside. The next major target is 3450, and if selling pressure remains strong, we could see further dips toward deeper support zones. Keep an eye on key levels and trend confirmations before entering positions. Maintain strict risk management and adjust positions according to volatility. A break below current support could open the way for extended bearish movement, making this a crucial opportunity for short traders."
SadarExplore
BTCUSD Short Opportunity, Bears Take Control
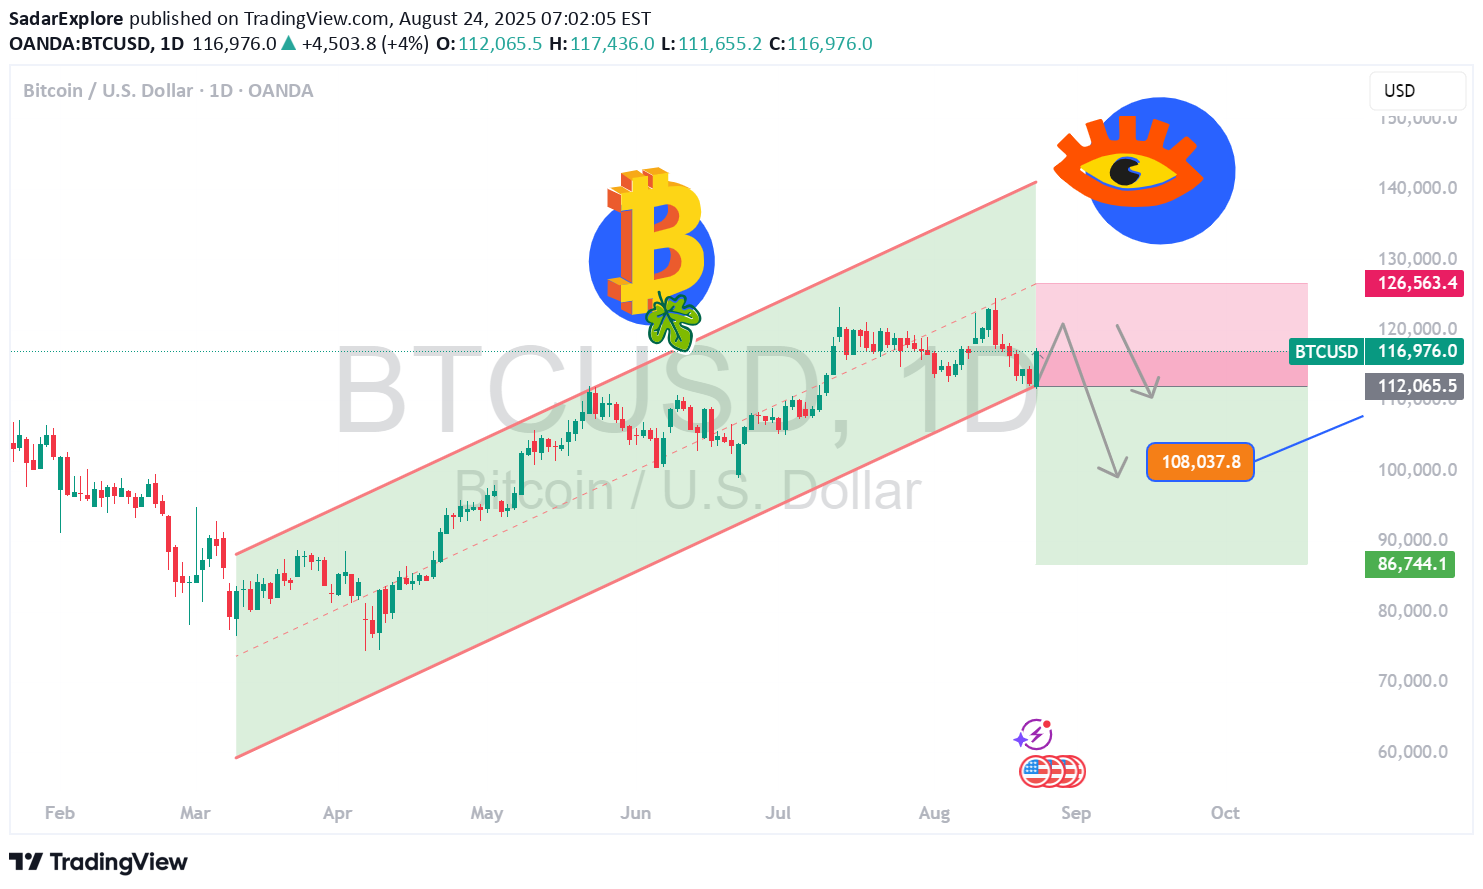
BTCUSD is currently trading around 116,980, facing strong rejection near the 117,200–117,500 resistance zone. The recent price action suggests that sellers are gaining control as bullish momentum fades. A sustained move below 116,800 could trigger further downside pressure, pushing Bitcoin toward 115,500 and 114,800 in the short term. If the bearish structure remains intact, the next major target lies near the psychological level of 110,000, which aligns with previous demand zones and a key Fibonacci retracement level. Stop-loss should ideally be placed above 117,600 to protect against any false breakouts. Watch for increased volatility during US trading hours and upcoming macroeconomic data releases, as these could accelerate the move. Overall bias remains strongly bearish as long as BTC trades below 117,500.hello guys are you happy with this target ?
SadarExplore
Gold Shines Bright - Strong Buy Zone
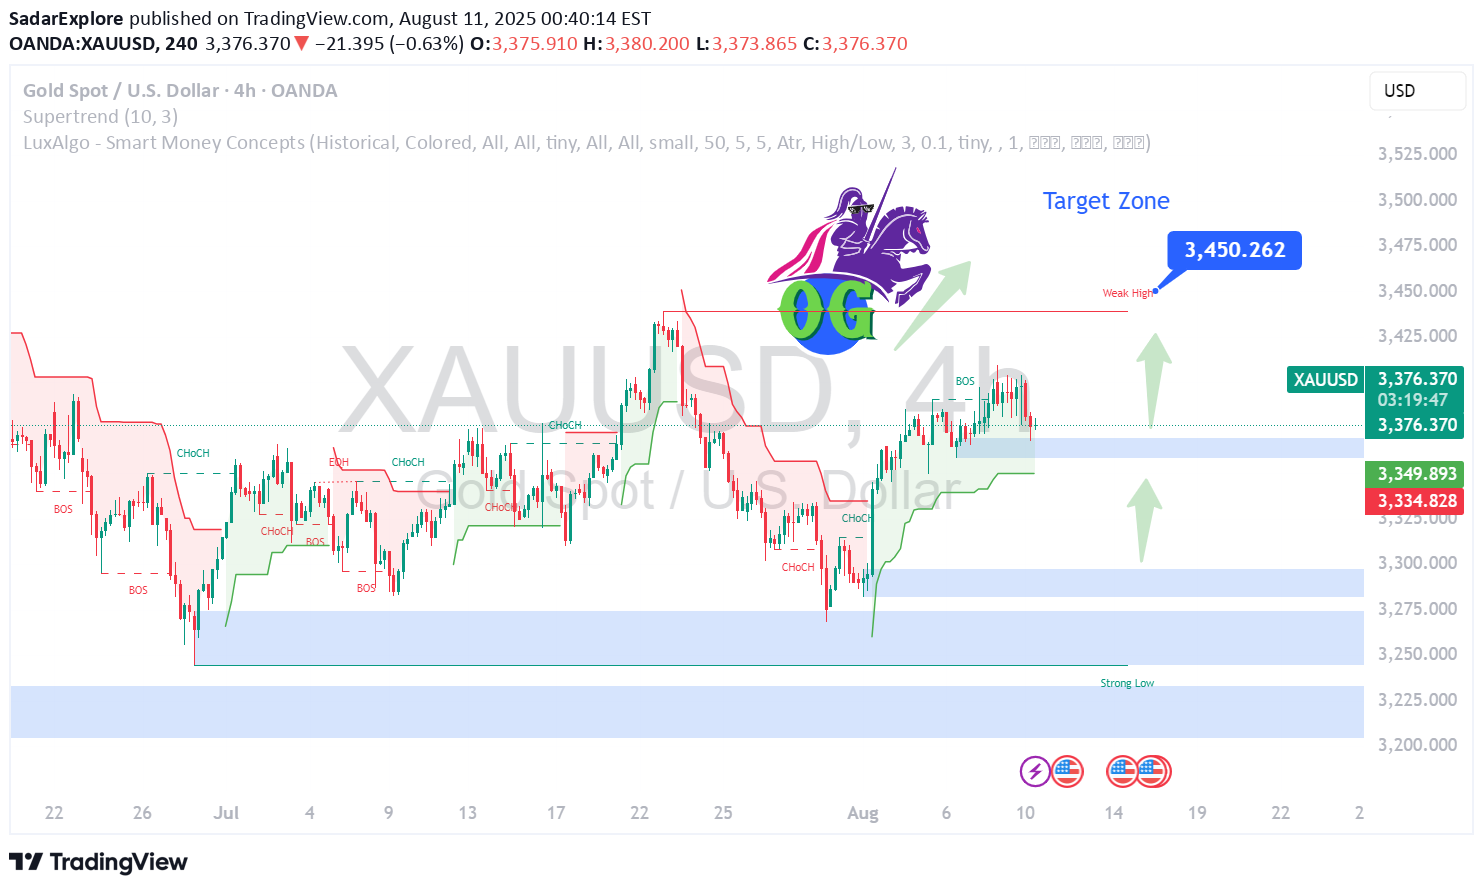
XAUUSD Buy Setup – Gold is maintaining strong bullish momentum after holding the 3375 support level. Market sentiment remains positive, with buyers stepping in and pushing price higher. As long as price sustains above 3375, the path of least resistance remains to the upside. The next bullish targets are set at 3425 and 3450, where we expect potential profit-taking. A break and close above 3425 could accelerate momentum toward 3450. Traders should monitor intraday pullbacks for fresh buying opportunities, keeping stop-losses below the support zone to protect capital.Fnally target hitting done
SadarExplore
BITCOIN- Charging Towards 122k Momentum Building
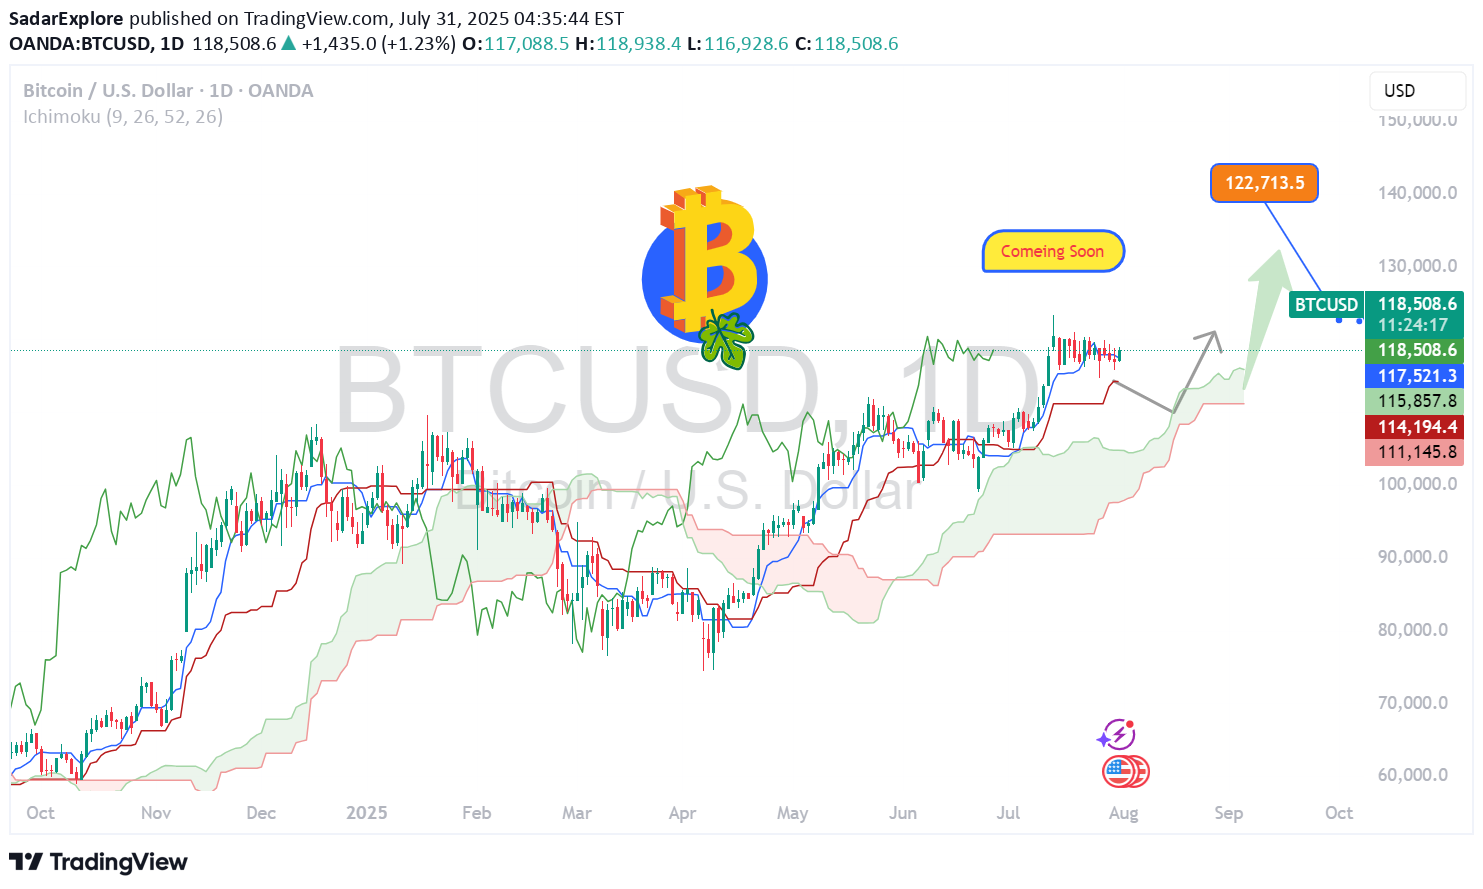
BTC/USD Long Setup – Targeting 122K 🔥 Bitcoin is holding strong above 118500, signaling bullish momentum. ✅ Price broke key resistance & forming higher lows. 🟢 Current structure favors buy-side continuation with next major target at 122000. Support Zones: 🔹 117800 – intraday bullish retest 🔹 116500 – strong demand zone Resistance Ahead: 🔸 120200 – short-term reaction 🔸 122000 – major target 🚀 Expecting bullish wave continuation. If momentum sustains above 118K, 122K breakout highly probable! #BTC #Bitcoin #CryptoSetup #BTCUSD #CryptoTrading #BTC122K #ChartAnalysis #BullishBreakoutcongratulation guys finally we got target
SadarExplore
MOST ACCURATE XAUUSD GOLD FORECAST ANALYSIS MARKET
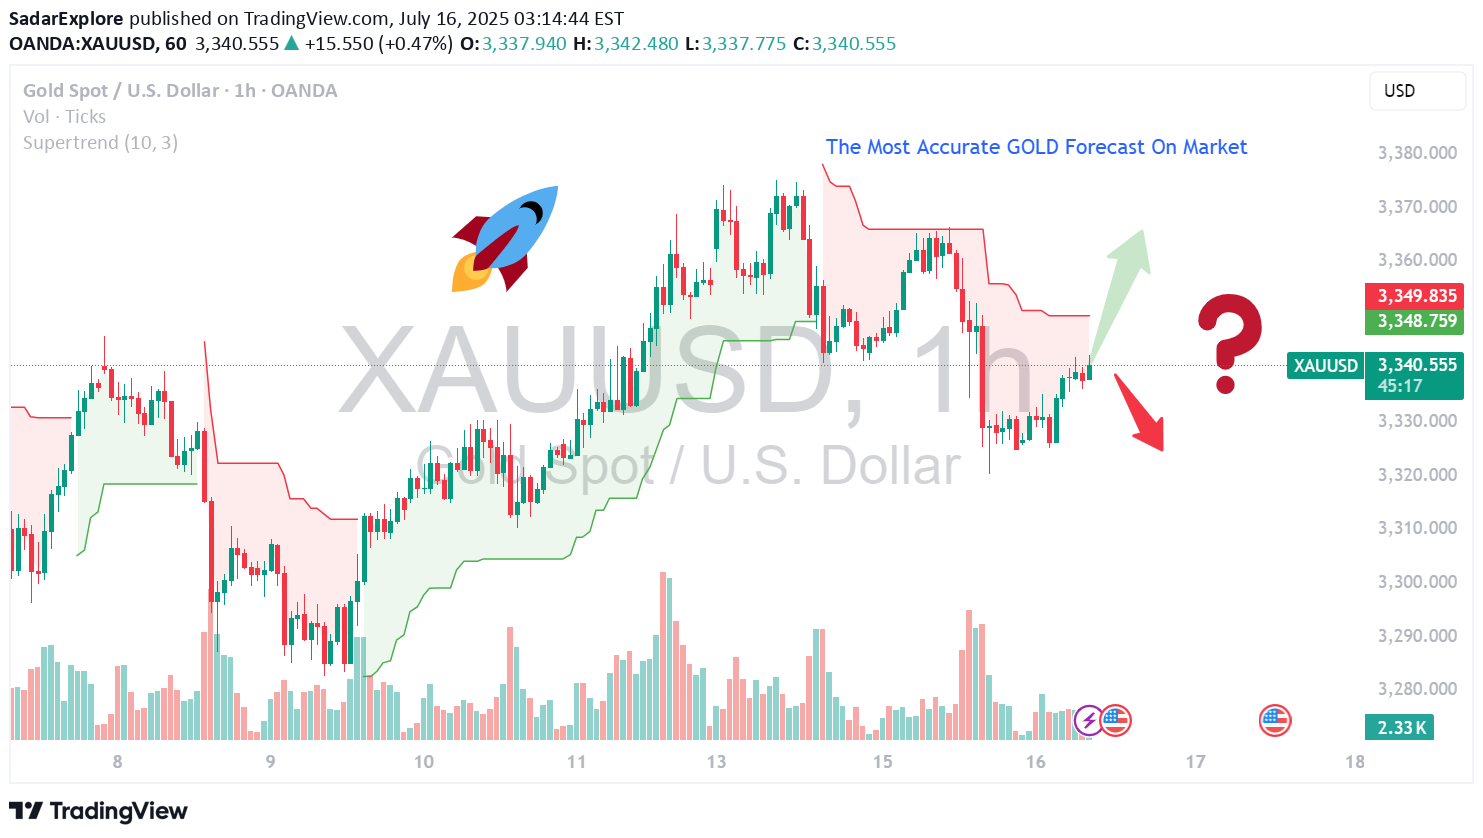
Current Setup & Technical Outlook Consolidation & Pennant Formation: Gold is building a bullish pennant and trading above its 50‑day MA — a classic continuation pattern suggesting a breakout toward new highs if momentum resumes . Key Levels: Support: $3,330–3,340 — confirmed by multiple technical sources . Resistance/Breakout Zone: $3,360–3,375 — clearing this could trigger a rally toward $3,400+ . Upside Targets: $3,390, then possibly $3,500–$3,535 per weekly forecast . Alternate Bearish Scenario: A failure around the 0.618 Fibonacci resistance (~$3,374) and overbought RSI could spark a pullback to $3,356 or lower . --- 🧠 Fundamental Drivers Inflation & U.S. Macro Data: Market awaits June CPI/PPI and Fed commentary — cooler inflation could boost gold via dovish expectations, while hotter data may strengthen the USD and weigh on bullion . Geopolitical & Safe-Haven Demand: Trade tensions (e.g., tariffs) are keeping gold elevated near $3,350–$3,360 . Central Bank & Real Yields Watch: Continued gold purchases and lower real rates are supportive, although mid-term easing in risks (like global trade) could curb momentum .gold move up soon stay tuned with our analysisare you happy with our analysis guys finally done
SadarExplore
BITCOIN NEXT TARGET 120500

1. Professional & Direct: BTC Long in Play – Eyes on 120,500 🔥 Momentum building strong. Stay in the trend — next target: 120.5K. --- 2. TradingView Style (Engaging): Bitcoin Bulls Gaining Strength 🚀 Long position active. Targeting next major level at $120,500 — hold tight! --- 3. VIP Signal Tone: BTC BUY Signal Active ✅ We’re riding the wave to $120,500. Strong confirmation on higher timeframes.target finaly reached on our zone if you agree then close it or keep continue buy next target 25k hopeSTIL VAILID FOR NEXT TARGET 125K
SadarExplore
XAUUSD GOLD buy hold

XAUUSD GOLD BUY NOW – LONG TRADE SETUP ACTIVE 🟡📈Gold has pulled back to a key support area and is now showing signs of strength at the current price of $3301.This zone is acting as a strong base for buyers, signaling a potential bullish continuation in the coming sessions.We are entering a LONG position with a favorable risk-to-reward ratio, supported by market structure and technical confirmation.🔹 Current Price: $3301🎯 Target Levels: First target at $3350, extended target at $3400+🛑 Stop Loss: Recommended below $3275 to protect capitalAs long as price holds above the support zone, bulls remain in control.Patience, discipline, and proper risk management are key — let the trend do the work.Gold is poised for upside — time to ride the wave!
SadarExplore
BTC NEXT TARGET BUY 110K MORE

Bitcoin Alert! 🚨 BTC is showing strong momentum and the market is heating up! 🔥 Current levels present a strategic buy opportunity before the next big move. 📈 Targeting $110K–$115K in the coming wave — and the breakout could be explosive. 💰 Accumulate now before the FOMO kicks in. 📊 Smart traders are already positioning. ⏳ Time is limited — don’t watch from the sidelines. This could be the move that defines the next phase of the bull run. Stay ahead. Stay informed. Stay invested. 🧠🚀 #Bitcoin #BTC #CryptoAlert #BullRun #CryptoNews #BitcoinTarget #BTCNextMove #CryptoTradinits touched 107k left 3kcomingFinally reached target al most done
SadarExplore
ETH HIT THE LIKE TO MANIFEST THIS

ETH/USD is teasing the breakout zone again... 👀Are we finally ready for liftoff, or is it another fakeout? 🚀🔄The chart’s looking spicy, and the energy feels right. 🌌Hit that like to manifest the pump — we’re in this together. 💎🙏Let’s speak green candles into existence! 📈✨#ETH #Ethereum #CryptoVibes #ManifestMoneyMoves #ETHUSD #ToTheMoon"stil valid
Disclaimer
Any content and materials included in Sahmeto's website and official communication channels are a compilation of personal opinions and analyses and are not binding. They do not constitute any recommendation for buying, selling, entering or exiting the stock market and cryptocurrency market. Also, all news and analyses included in the website and channels are merely republished information from official and unofficial domestic and foreign sources, and it is obvious that users of the said content are responsible for following up and ensuring the authenticity and accuracy of the materials. Therefore, while disclaiming responsibility, it is declared that the responsibility for any decision-making, action, and potential profit and loss in the capital market and cryptocurrency market lies with the trader.