
SUBROOFFICIAL
@t_SUBROOFFICIAL

What symbols does the trader recommend buying?
Purchase History
پیام های تریدر
Filter
SUBROOFFICIAL
پیشبینی انفجاری قیمت SEI تا ۲۰۲۷: آیا الگوی گوه نزولی شما را به سود کلان میرساند؟
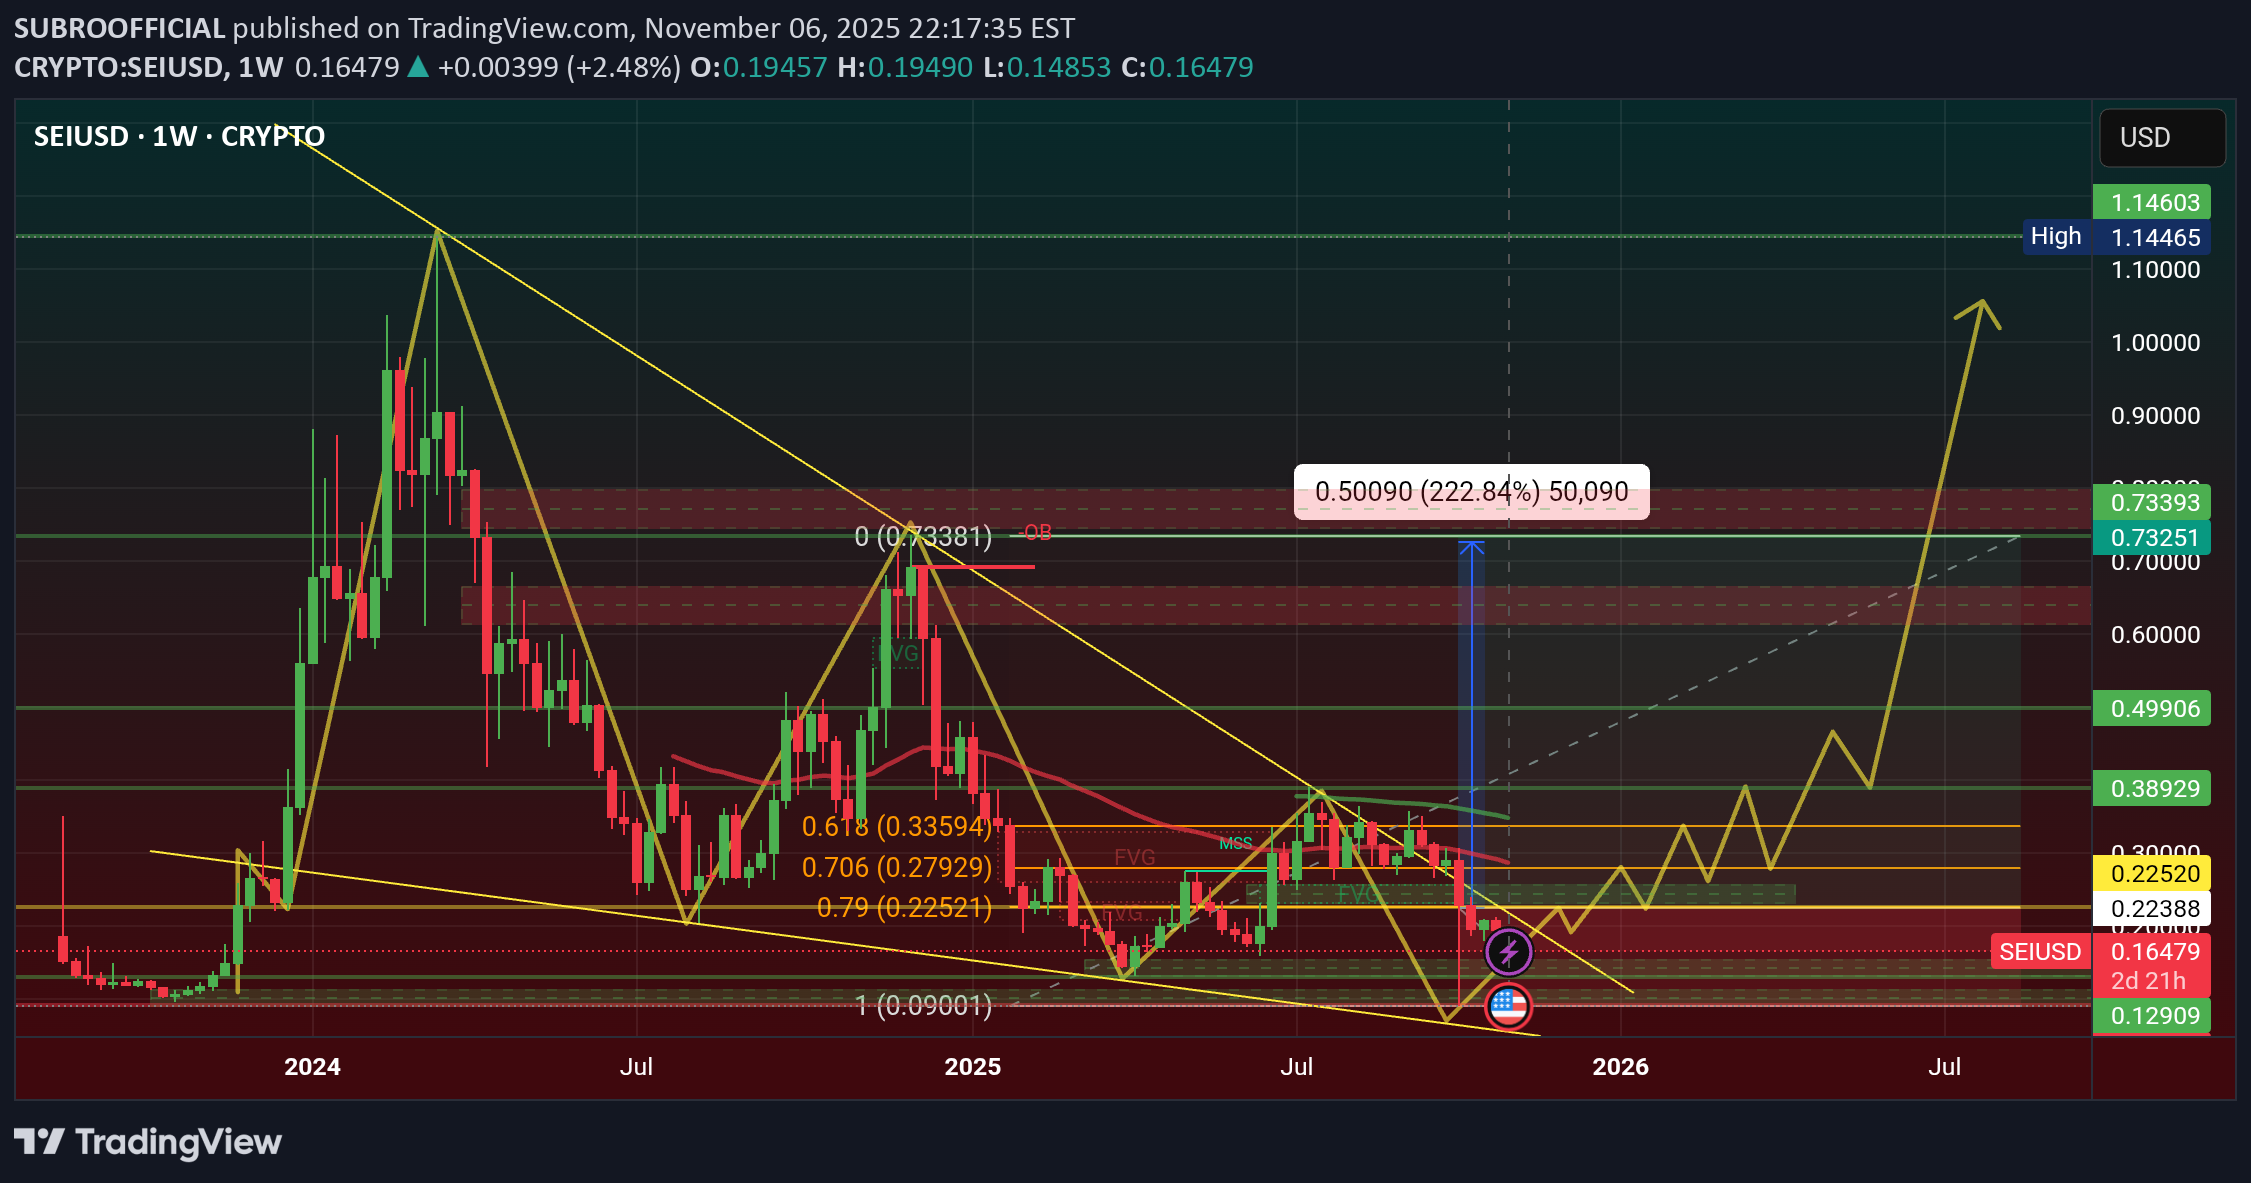
SEI price is showing a Bullish Pattern of Falling Wedge Pattern, when this pattern will create on chart after price will be upward direction. Price Will hit $1.11 in 2026 and 2027 is $2.22, $3.33 Entry Point is $0.22, $0.27, $0.33 and Stoploss point $0.09 2026 Target point $0.49, $0.77, $1.11 2027 Target point $2.22, $3.33 #trending #Highlight #trendingideas #SEI #SUBROOFFICIAL Disclaimer: This article is for informational purposes only and does not constitute financial advice. Always conduct your own research before making any investment decisions. Digital asset prices are subject to high market risk and price volatility. The value of your investment may go down or up, and you may not get back the amount invested. You are solely responsible for your investment decisions and Binance is not available for any losses you may incur. Past performance is not a reliable predictor of future performance. You should only invest in products you are familiar with and where you understand the risks. You should carefully consider your investment experience, financial situation, investment objectives and risk tolerance and consult an independent financial adviser prior to making any investment.
SUBROOFFICIAL
پیشبینی انفجاری قیمت PUMP: آیا رسیدن به ۰.۰۱ دلار در سال ۲۰۲۶ ممکن است؟
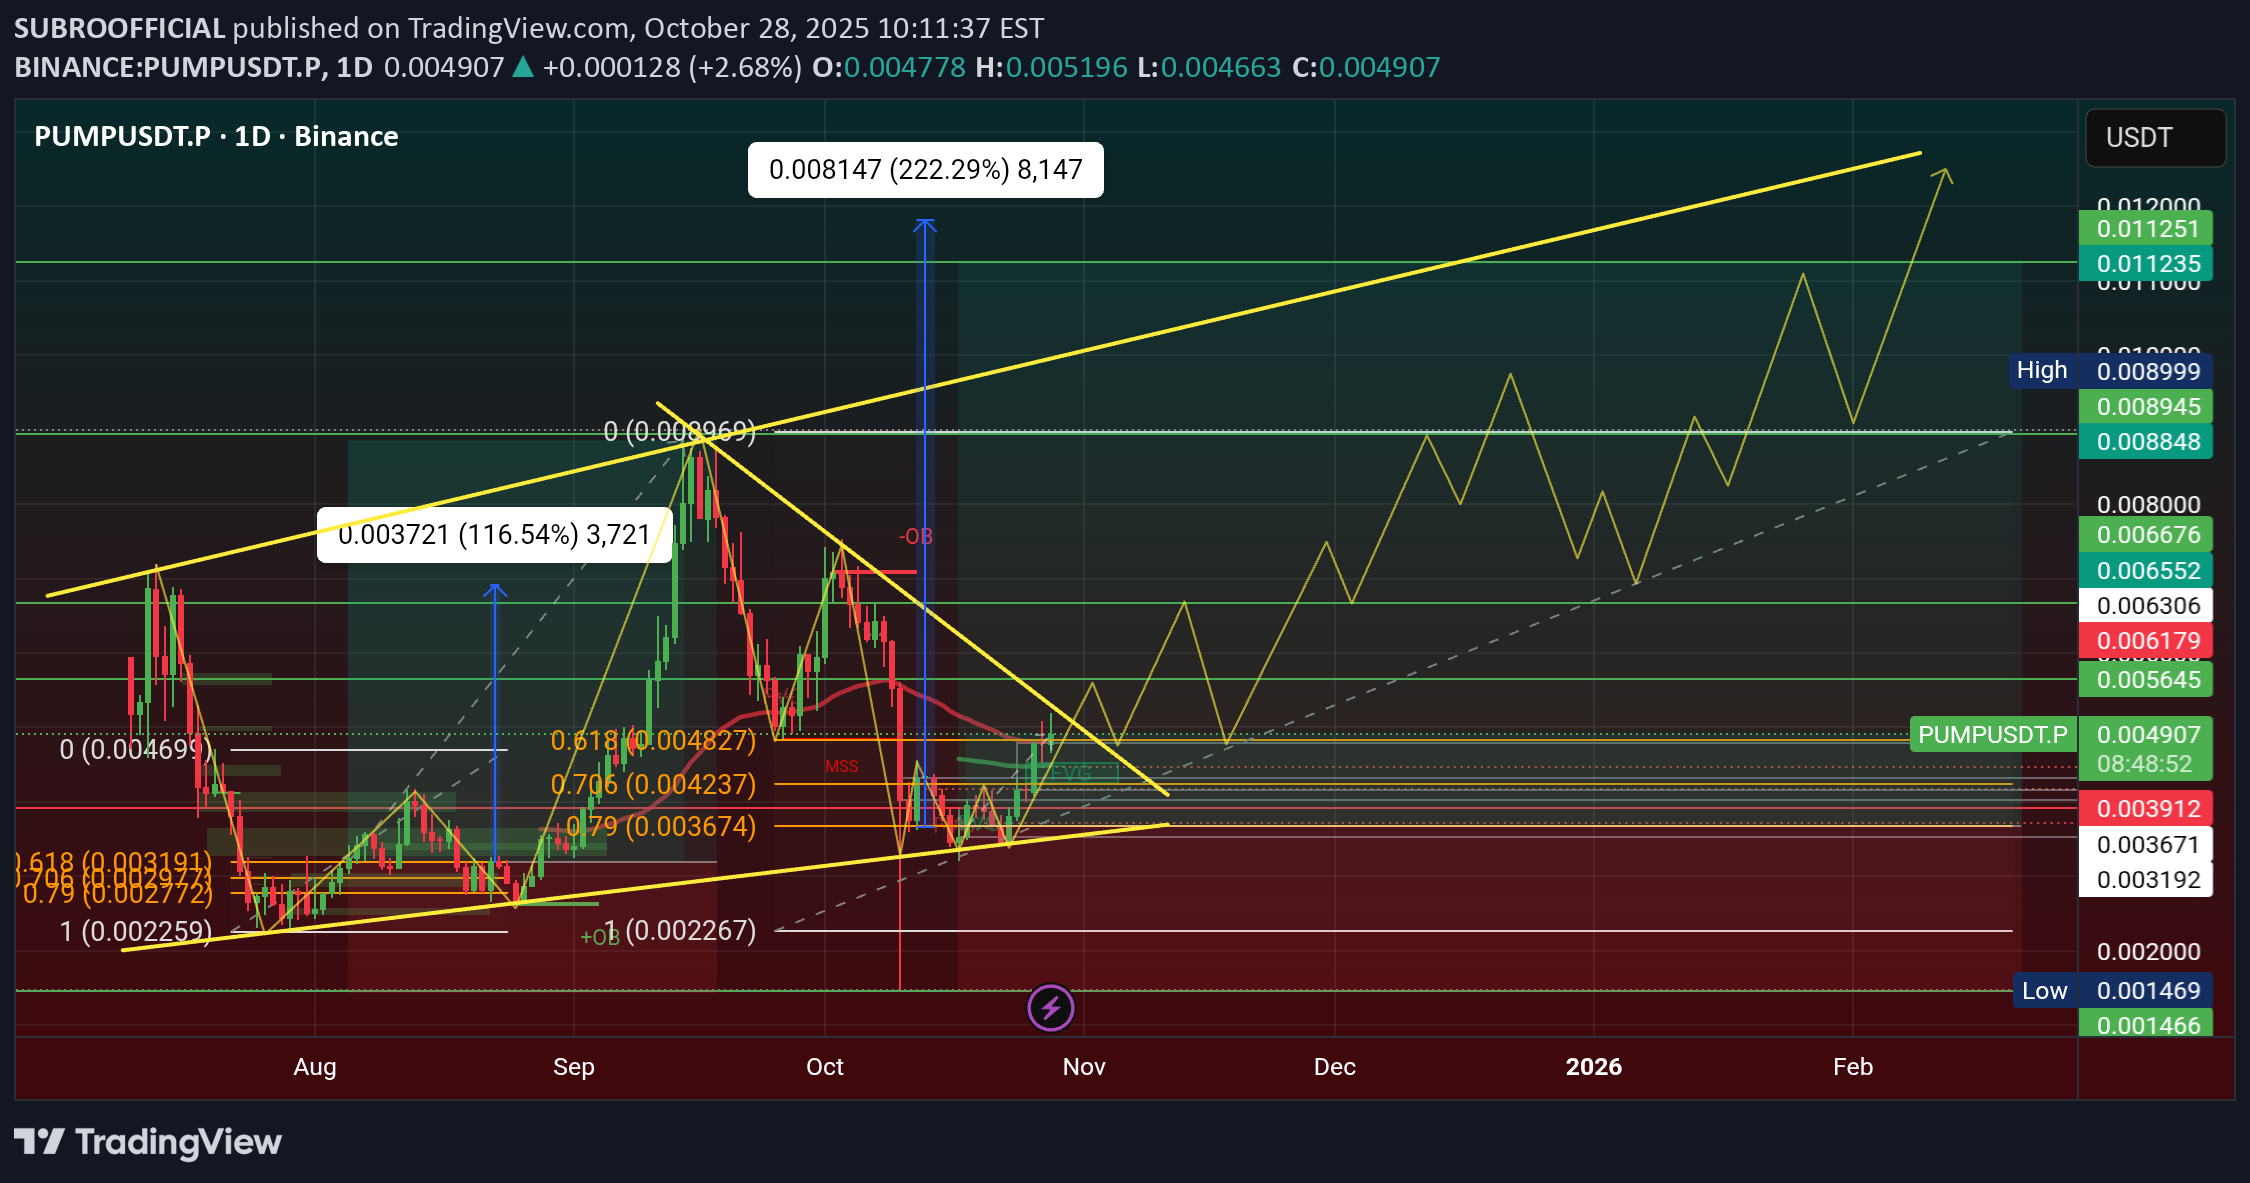
PUMP COIN INFO Support Level Price $0.002259 and Resistance level price $0.008969 and it's a Historical ATH level price $0.008999 , in 2026 parabalic bull run price will rising $0.011222 surge 222% Roi in 3 months Pump.fun’s native token PUMP has quickly become one of the most talked-about memecoins in the Solana ecosystem. Built as a creator-first launchpad, Pump.fun lets communities directly back their favorite creators while sharing in their success. With its viral “no-code” model, Pump.fun aims to disrupt traditional Web2 social platforms and carve a dominant role in Solana’s DeFi landscape.As of writing, the PUMP price has proven to be a bigger attraction after showing fantastic price action in Q3 2025. As a result, the token has surged in popularity across exchanges and social media, and many experts are raising questions about its potential to climb even higher in the coming years. Major Developments That Fueled PUMP’s Rally The Q3 saw many altcoin’s rally including PUMP, this happened with a trigger from Binance US listing. It turned out as a major catalyst for the surge in PUMP price, accompanied by a 350 million PUMP reward campaign that caught traders’ attention. In September alone, PUMP gained over 180% to $0.00899 creating a new ATH before a pullback. Meanwhile, Pump.fun has been using more than 98% of its platform revenue to buy back tokens, directly supporting price action. This aggressive strategy has turned Pump.fun into one of the most profitable DeFi projects on Solana, boosting trader confidence. PUMP.Fun Price Analysis For October 2025 From a short-term technical viewpoint, the PUMP price chart showed significant strength in Q3, marked by a breakout from a slanted double-bottom pattern. This bullish momentum successfully drove the price to an All-Time High (ATH) of $0.00899 by mid-September. Following the ATH, a period of profit-taking began, which was severely accelerated and worsened by a massive market liquidation event from Oct. 10 to 11. This event was triggered by the re-emergence of conflicts between the US and China over trade tariffs, which rattled not just the crypto sector but the entire financial landscape. This pressure pushed the PUMP price down sharply to the critical support area of $0.0035 to $0.0036. Investors are trying to sustain the price damages at this foundational support, as a reason why its consolidating at support, currently. Pump.fun Price Surges – Is $0.0075 Possible? Pump.fun has walked into October with a powerful burst, as its price jumps up by 16.55% overnight to $0.006422. With a market cap now towering at $2.26 billion and trading volume spiking 37.53% in 24 hours, Pump.fun sits squarely in the crypto spotlight. This momentum isn’t coming out of nowhere, as I’m seeing decisive moves by major holders, explosive social buzz, and promising technical signals. Let’s break down what’s fueling this trend and what could come next. Why is PUMP’s Price Up? Pump.fun’s recent price surge is rooted in three interconnected factors. First, whale accumulation is picking up big-time. Over 24,000 wallet addresses now hold at least 10,000 PUMP tokens, matching a massive 70% price run in September. In my view, when whales move in sync, it often sparks broader investor confidence and can preface new highs. However, with 60% of ICO-era whales still in play, there’s the risk of sudden profit-taking if these giants decide to cash out. Second, social media is supercharging attention, but not without controversy. Solana’s Anatoly Yakovenko recently called Pump.fun a contender to rival TikTok. Thereby, citing its livestreaming tools and crypto-native monetization twist. That comment alone stoked a fresh wave of speculation and saw the token climb 90% over the past month. Still, protocol revenue has actually fallen 72% in the last two weeks, and fewer fresh tokens are launching, signaling a possible cooling off beneath all the hype. PUMP Price Analysis Technically speaking, Pump.fun price has reclaimed its 7-day SMA at $0.0055 and now eyes the $0.0075 resistance. The 4-hour chart shows a clear ascending channel, suggesting traders expect more upside. The RSI sits at 64.95, under the classic overbought threshold, which means there’s still some runway before euphoria peaks. Is it safe to invest now, considering whale activity? Whale moves can lift prices but also cause sharp drops if they exit. If Pump.fun holds above $0.0065, it could be bullish, but watch for signs of profit-taking or declining protocol engagement. Where is resistance, and what comes next? Immediate resistance sits around $0.0075, breaking above this could confirm a new uptrend. #Write2Earn #BinanceSquareFamily #Binance #PUMP #SUBROOFFICIAL Disclaimer: This article is for informational purposes only and does not constitute financial advice. Always conduct your own research before making any investment decisions. Digital asset prices are subject to high market risk and price volatility. The value of your investment may go down or up, and you may not get back the amount invested. You are solely responsible for your investment decisions and Binance is not available for any losses you may incur. Past performance is not a reliable predictor of future performance. You should only invest in products you are familiar with and where you understand the risks. You should carefully consider your investment experience, financial situation, investment objectives and risk tolerance and consult an independent financial adviser prior to making any investment.
SUBROOFFICIAL
پیشبینی انفجاری سولانا (SOL): آیا هدف ۳۳۳ دلار در سال ۲۰۲۶ محقق میشود؟
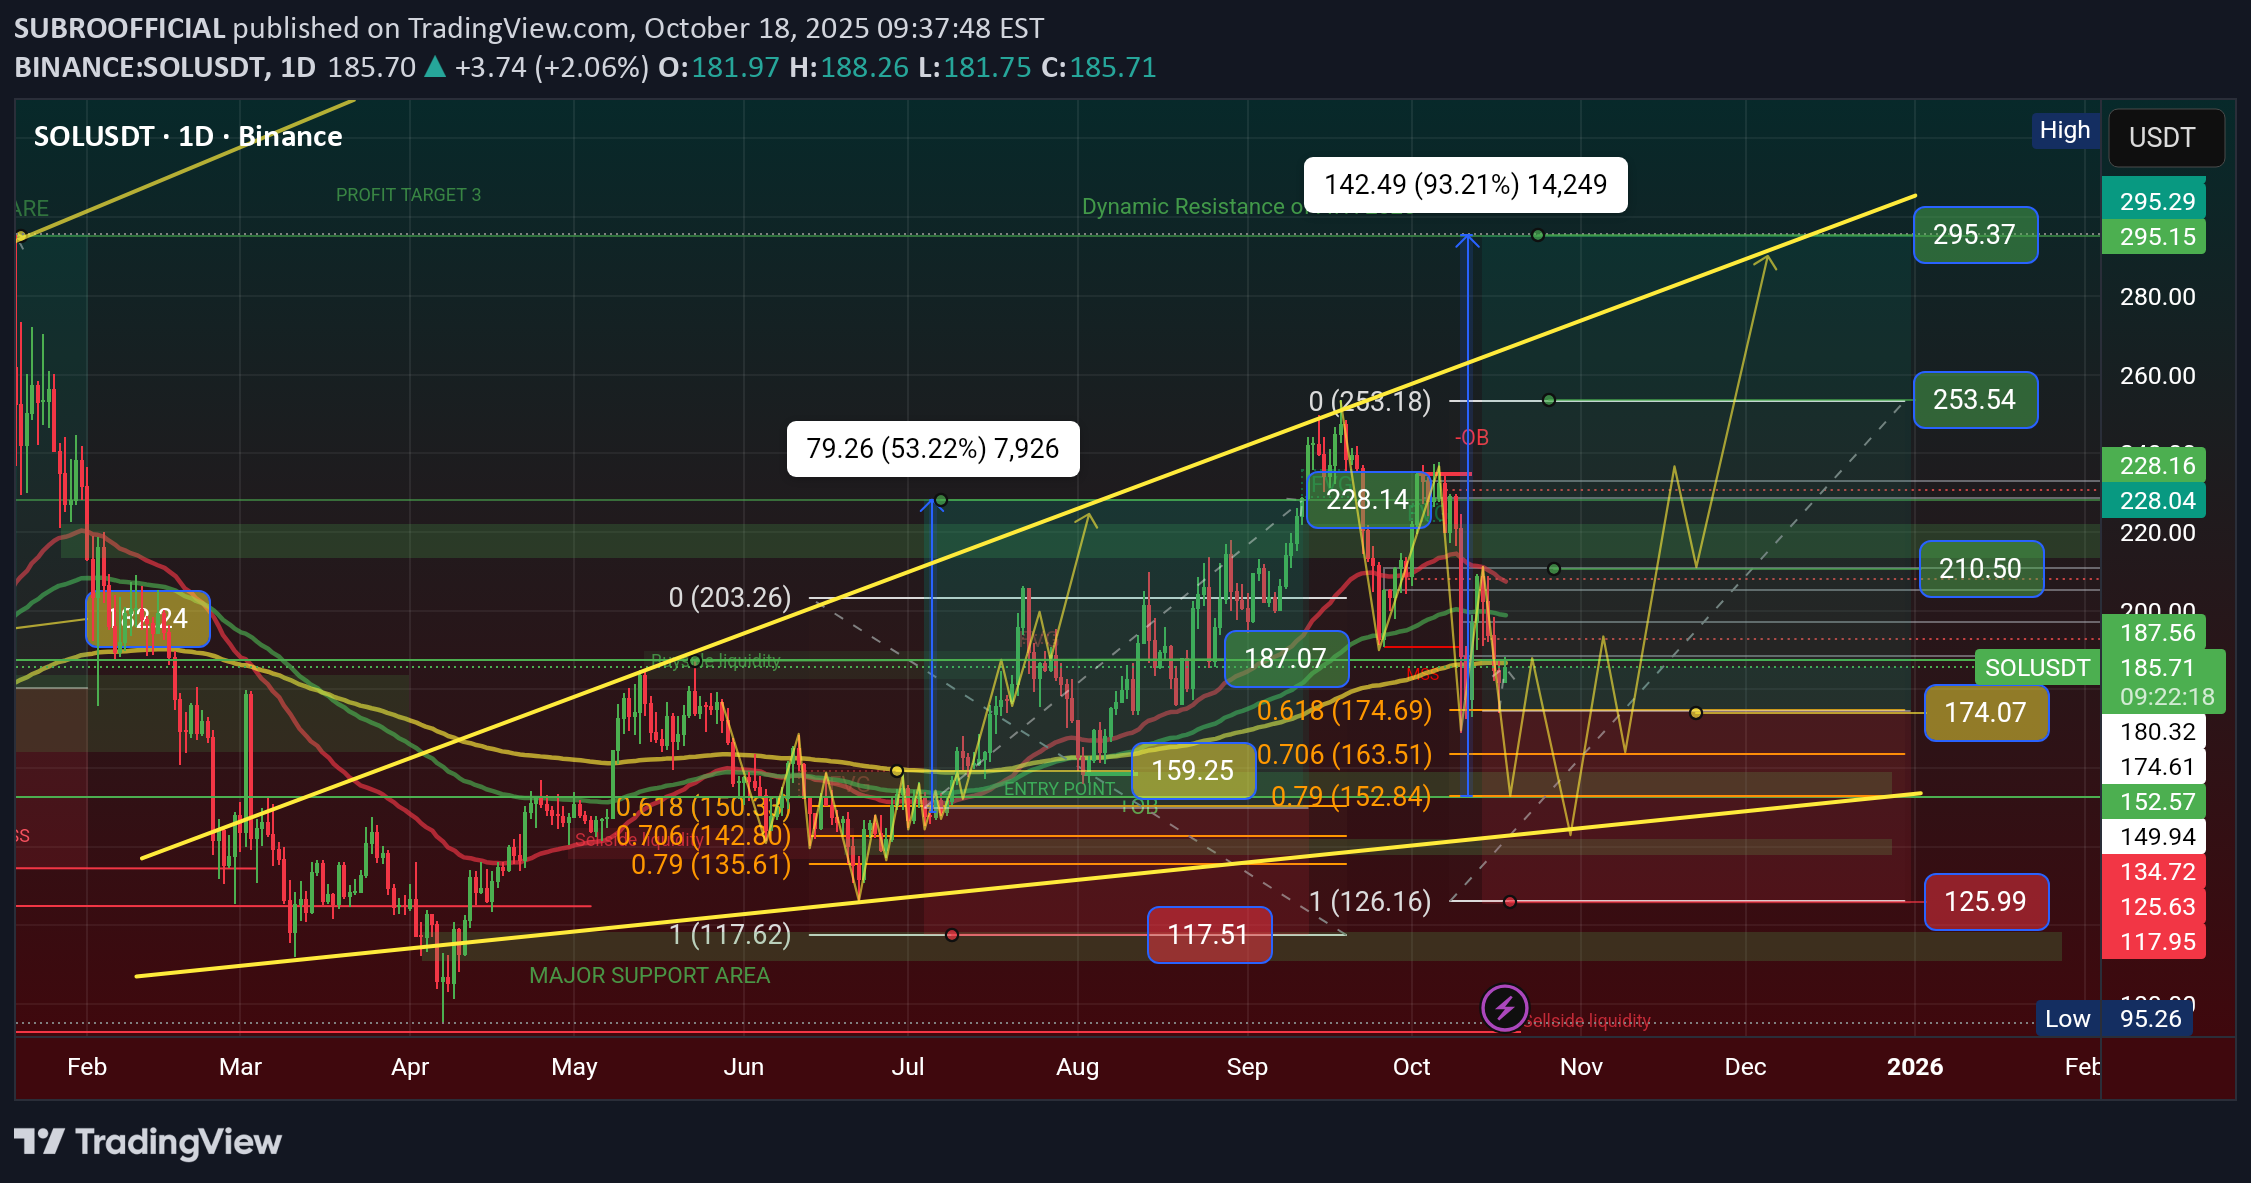
SOL Showing Inverse Descending Triangle Pattern, $333 in 2026 💹 Inverse Descending Triangle Pattern When This pattern will showing a chart than Price is waveing Descending Triangle Range of areas. Price will showing inverse and price moved too. we can make a trade plan to High area and low area. I'm using my Golden Fibonacci Tool, there are 3 point area of Buy position. 💲Position Setup: Open Long Position have 3 point areas, $152, $163, $174 and stoploss below area is $117. The Major Support Area is $101—$111 and Dynamic Resistance of ATH area is $293. My Long Position Target areas $210, $253, $293 and Incredible Price Target $333 areas in 2026 My Previous Long Setup will Hit $228 and complete my Trades. you can see my Previous analysis on this chart and now Waiting for confirmation of golden zone of Golden Fibonacci tool areas. #Write2Earn #BinanceSquareFamily #Binance #SOL #SUBROOFFICIAL Disclaimer: This article is for informational purposes only and does not constitute financial advice. Always conduct your own research before making any investment decisions. Digital asset prices are subject to high market risk and price volatility. The value of your investment may go down or up, and you may not get back the amount invested. You are solely responsible for your investment decisions and Binance is not available for any losses you may incur. Past performance is not a reliable predictor of future performance. You should only invest in products you are familiar with and where you understand the risks. You should carefully consider your investment experience, financial situation, investment objectives and risk tolerance and consult an independent financial adviser prior to making any investment.
SUBROOFFICIAL
الگوی صعودی خاص بیت کوین در اوج تاریخی: آیا قیمت به ۱۳۶ هزار دلار میرسد؟
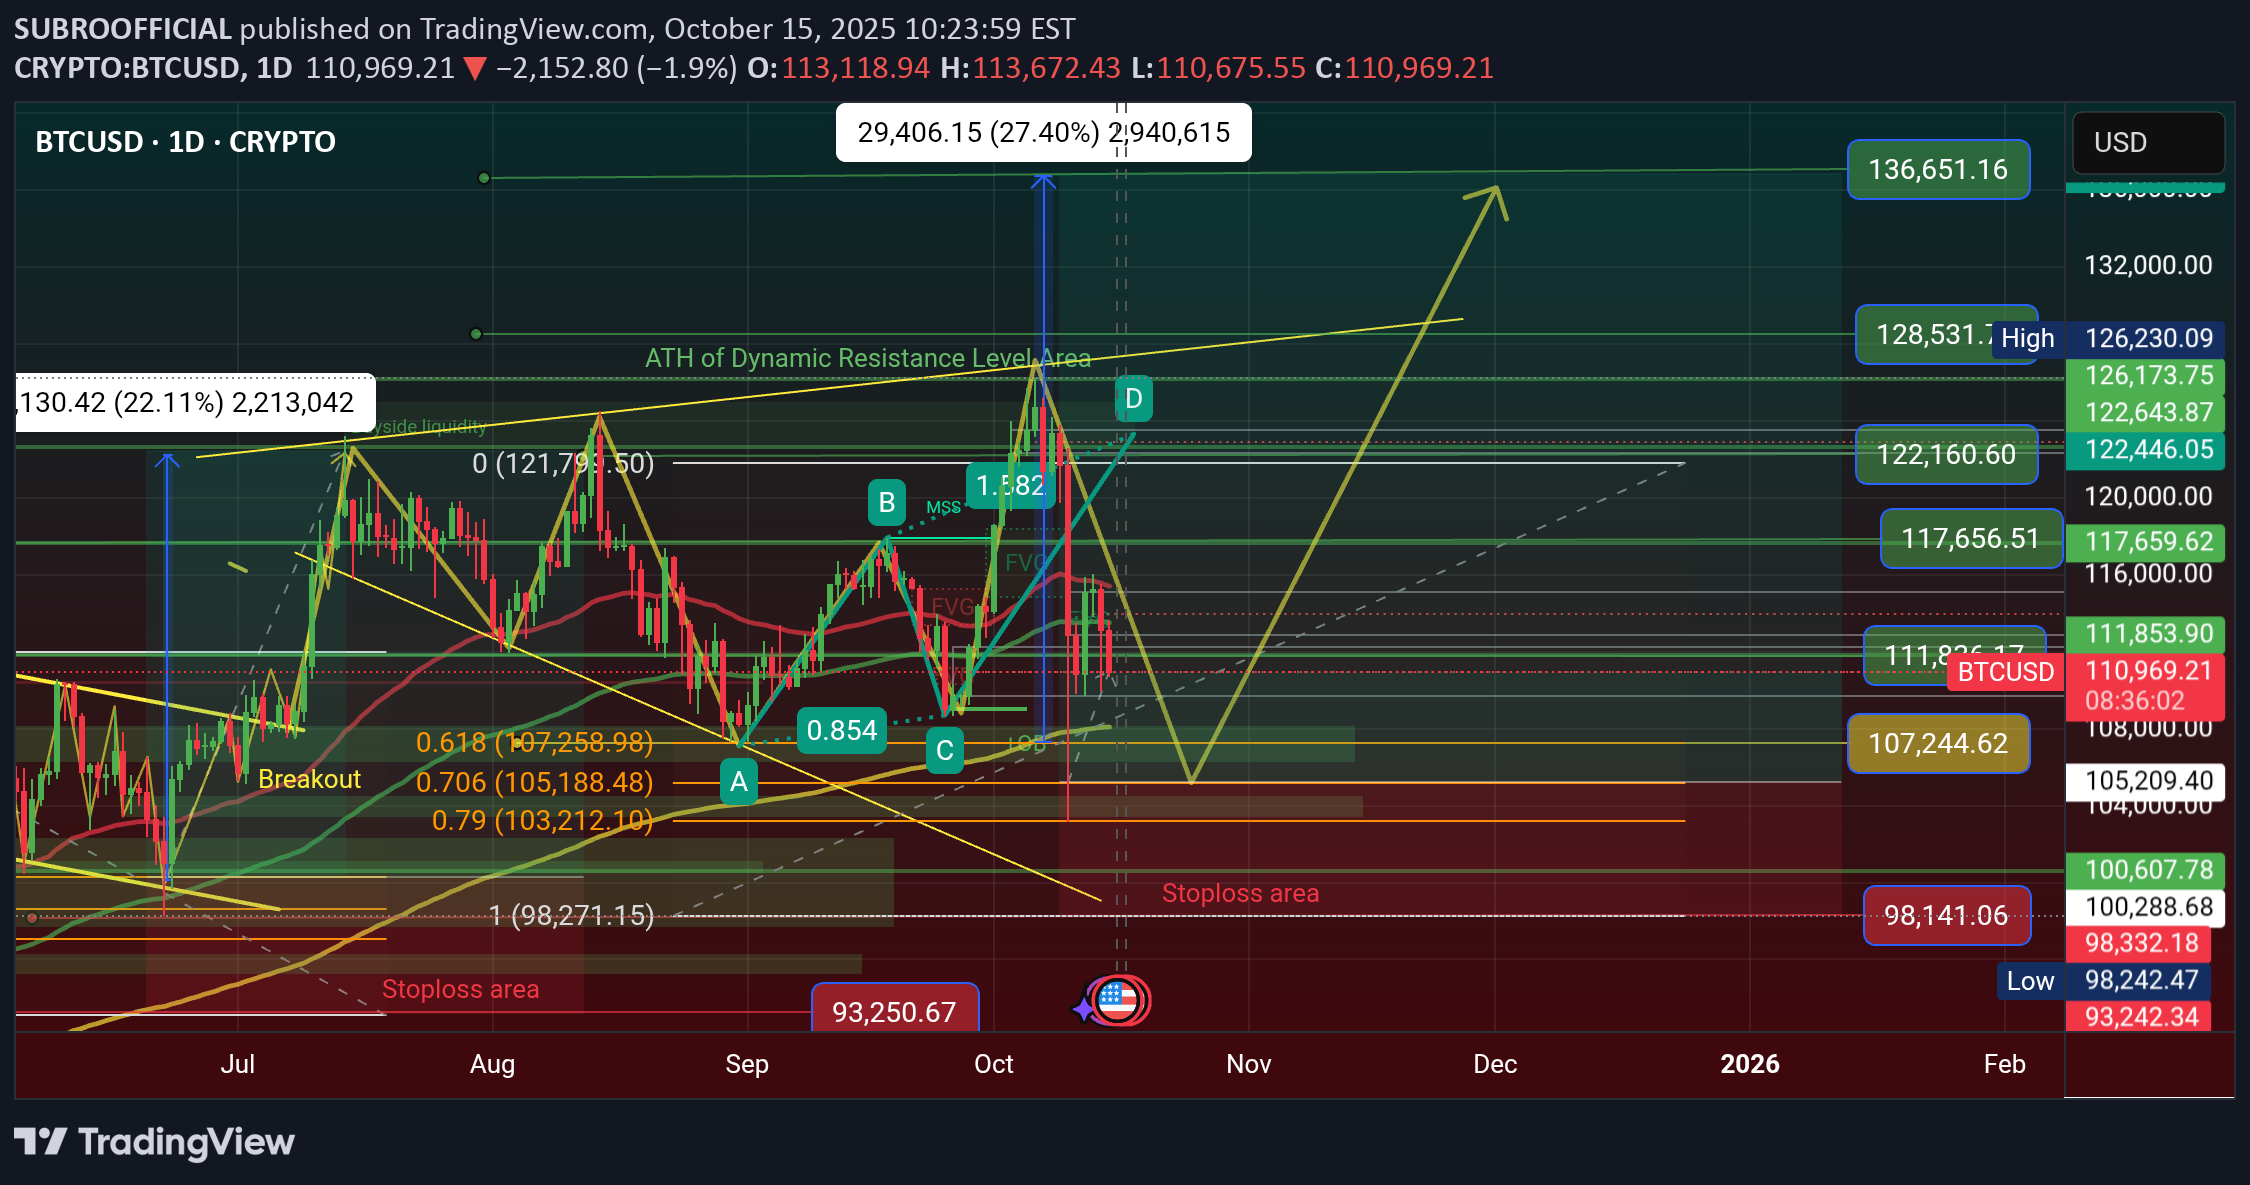
BTC is showing a Unique Bullish Megaphone Pattern in ATH area, Price will Hit $136K soon 2026 🚀 Dear, Binancians, My BTC Price Prediction will hit $136K in 2026 see on chart. 📈 Chart Analysis: Price is showing a Unique Bullish Megaphone Pattern and this is a Continuation Bull run Pattern. This Pattern is Very Rarely and it's made with on ATH areas. There is a False Breakout after the price will drop to support areas $105K - $108K and than pumping price very sharply. The price goes ATH area than falls breakout to Retested after Price will Break ATH areas. ATH area is a Dynamic Resistance area. When Fill this pattern it will be happened for $136K price areas 2026. 📊 Trading Setup: BTC Long Position setup guidelines: Major Support Areas is $98K and Dynamic Resistance area is ATH areas $126K, I'm using my Golden Fibonacci level for entry. There is 3 point of entry area is $103K, $105K, $108K and it's a Spot Position Entry point areas. Stoploss area is $98K and it's a support area. Profit the Target area is $111K $117K $122K $128K $136K. #Write2Earn #TrumpTariffs #BTC #MarketPullback #SUBROOFFICIAL Disclaimer: This article is for informational purposes only and does not constitute financial advice. Always conduct your own research before making any investment decisions. Digital asset prices are subject to high market risk and price volatility. The value of your investment may go down or up, and you may not get back the amount invested. You are solely responsible for your investment decisions and Binance is not available for any losses you may incur. Past performance is not a reliable predictor of future performance. You should only invest in products you are familiar with and where you understand the risks. You should carefully consider your investment experience, financial situation.
SUBROOFFICIAL
پیشبینی حیرتانگیز اتریوم: نمودار نشان میدهد قیمت در سال 2026 به 6000 دلار میرسد!
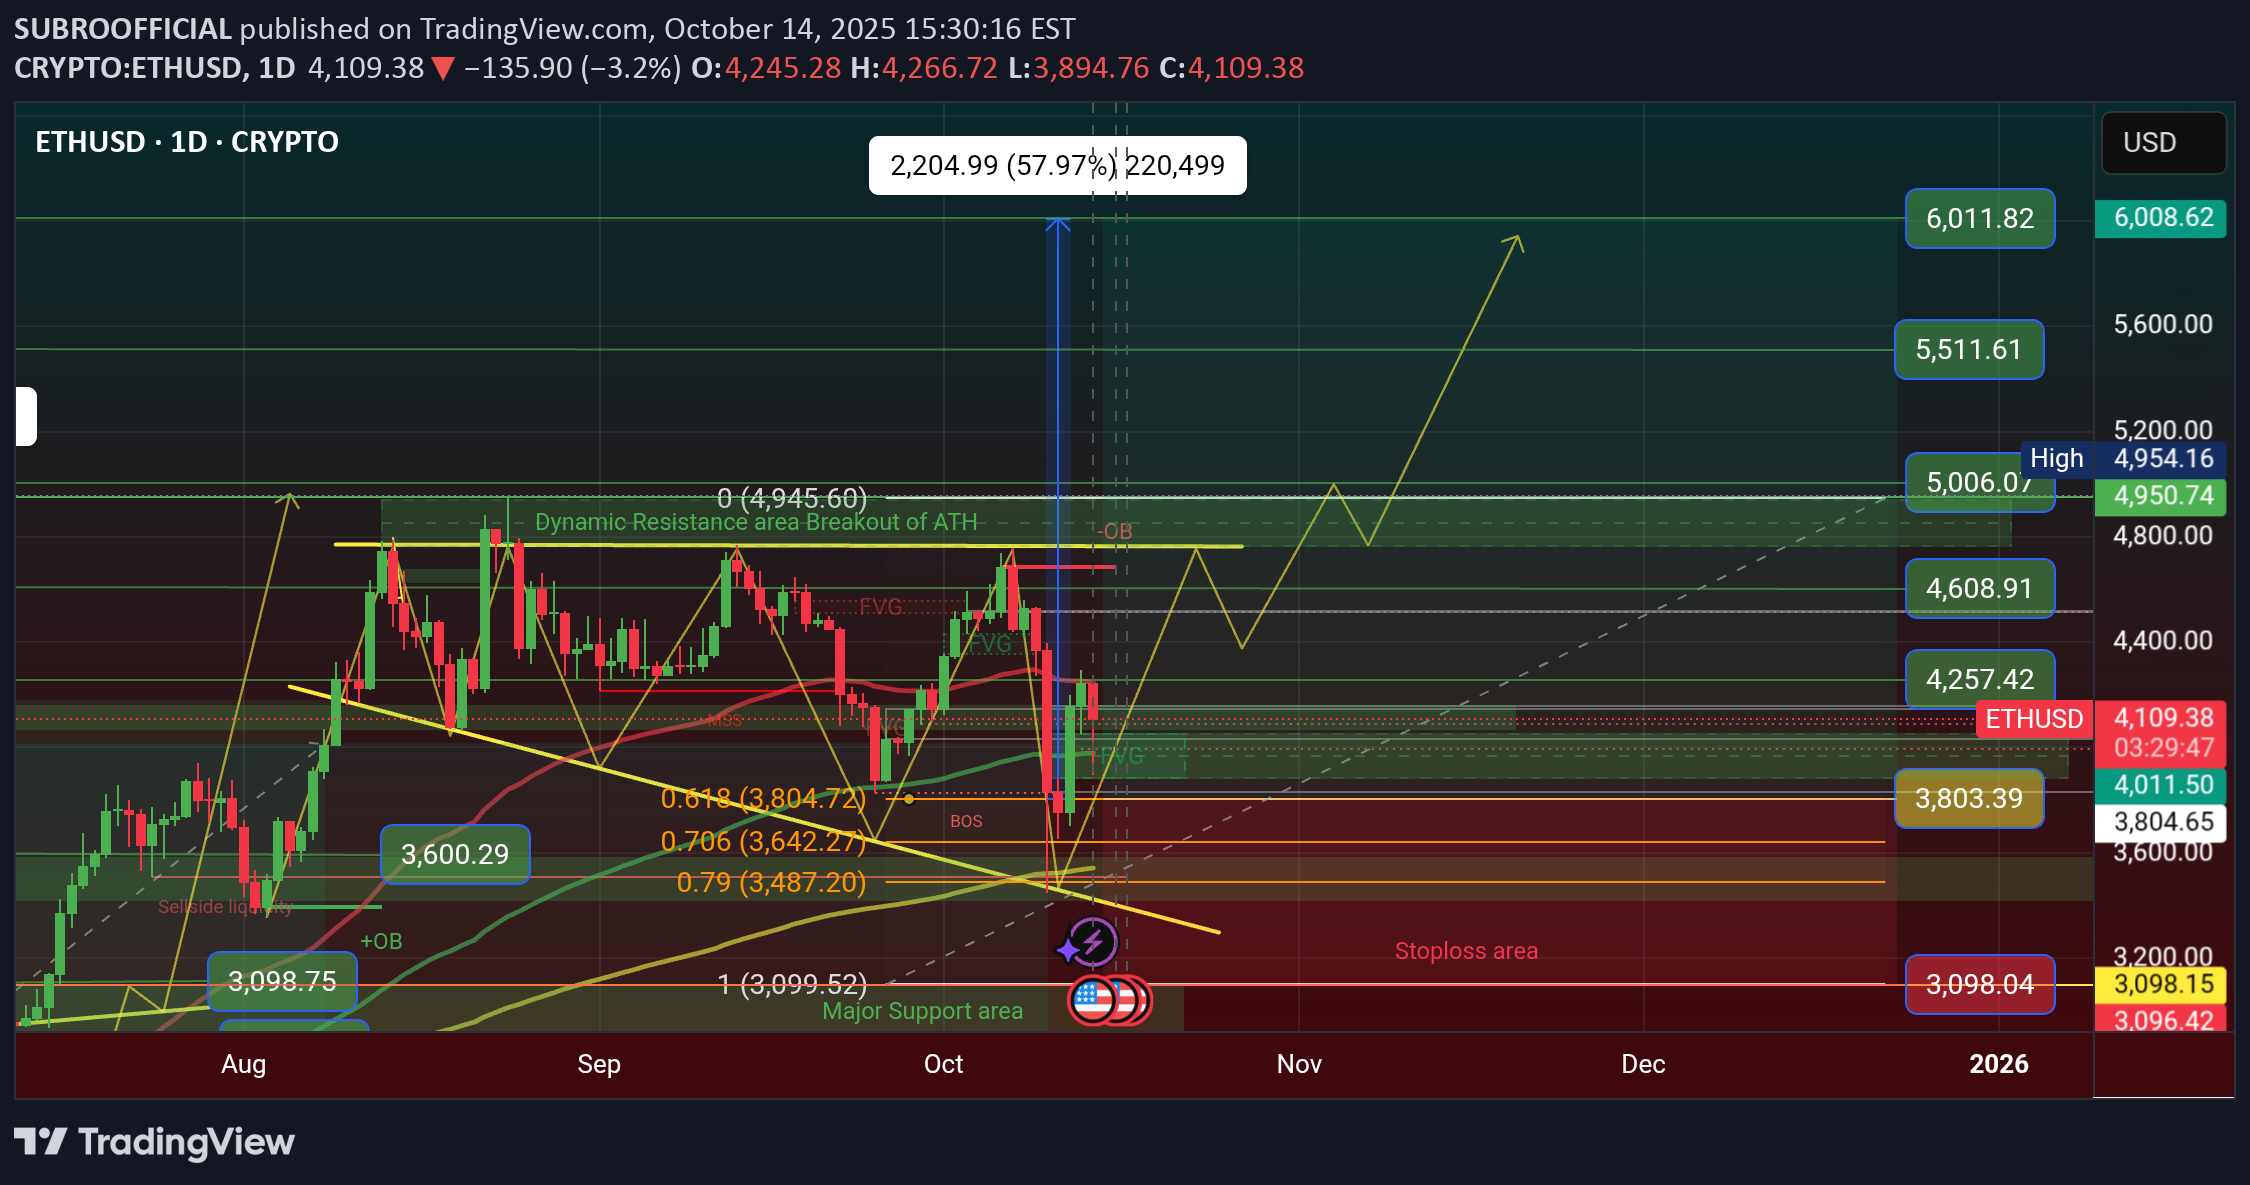
📈 Chart Analysis: Price is showing a Unique Bullish Megaphone Pattern and this is a Continuation Bull run Pattern. This Pattern is Very Rarely and it's made with on ATH areas. There is a False Breakout after the price will drop to support areas $3K - $3.5K and than pumping price very sharply. The price goes ATH area than falls breakout to Retested after Price will Break ATH areas. ATH area is a Dynamic Resistance area. When Fill this pattern it will be happened for $6K price areas 2026. 📊 Trading Setup: ETH Long Position setup guidelines: Major Support Areas is $3K and Dynamic Resistance area is ATH areas $4.9K, I'm using my Golden Fibonacci level for entry. There is 3 point of entry area is $3.4K, $3.6K, $3.8K and it's a Spot Position Entry point areas. Stoploss area is $3K and it's a support area. Profit the Target area is $4.2K $4.6K $5K $5.5K $6K. 🌍 Dominance Analysis: ETH Dominance is dumping ETH price will Pumping. The Dominance ATH is 22.38% of Resistance area in December 2021 and Support area is 6.95% in April 2025. #Write2Earn #BinanceSquareFamily #Binance #BTC☀ #SUBROOFFICIAL Disclaimer: This article is for informational purposes only and does not constitute financial advice. Always conduct your own research before making any investment decisions. Digital asset prices are subject to high market risk and price volatility. The value of your investment may go down or up, and you may not get back the amount invested. You are solely responsible for your investment decisions and Binance is not available for any losses you may incur. Past performance is not a reliable predictor of future performance. You should only invest in products you are familiar with and where you understand the risks. You should carefully consider your investment experience, financial situation, investment objectives and risk tolerance and consult an independent financial adviser prior to making any investment.
SUBROOFFICIAL
پیشبینی قیمت BNB: آیا این ارز تا پایان ۲۰۲۵ به ۱۵۱۵ دلار میرسد؟ (تحلیل نمودار)
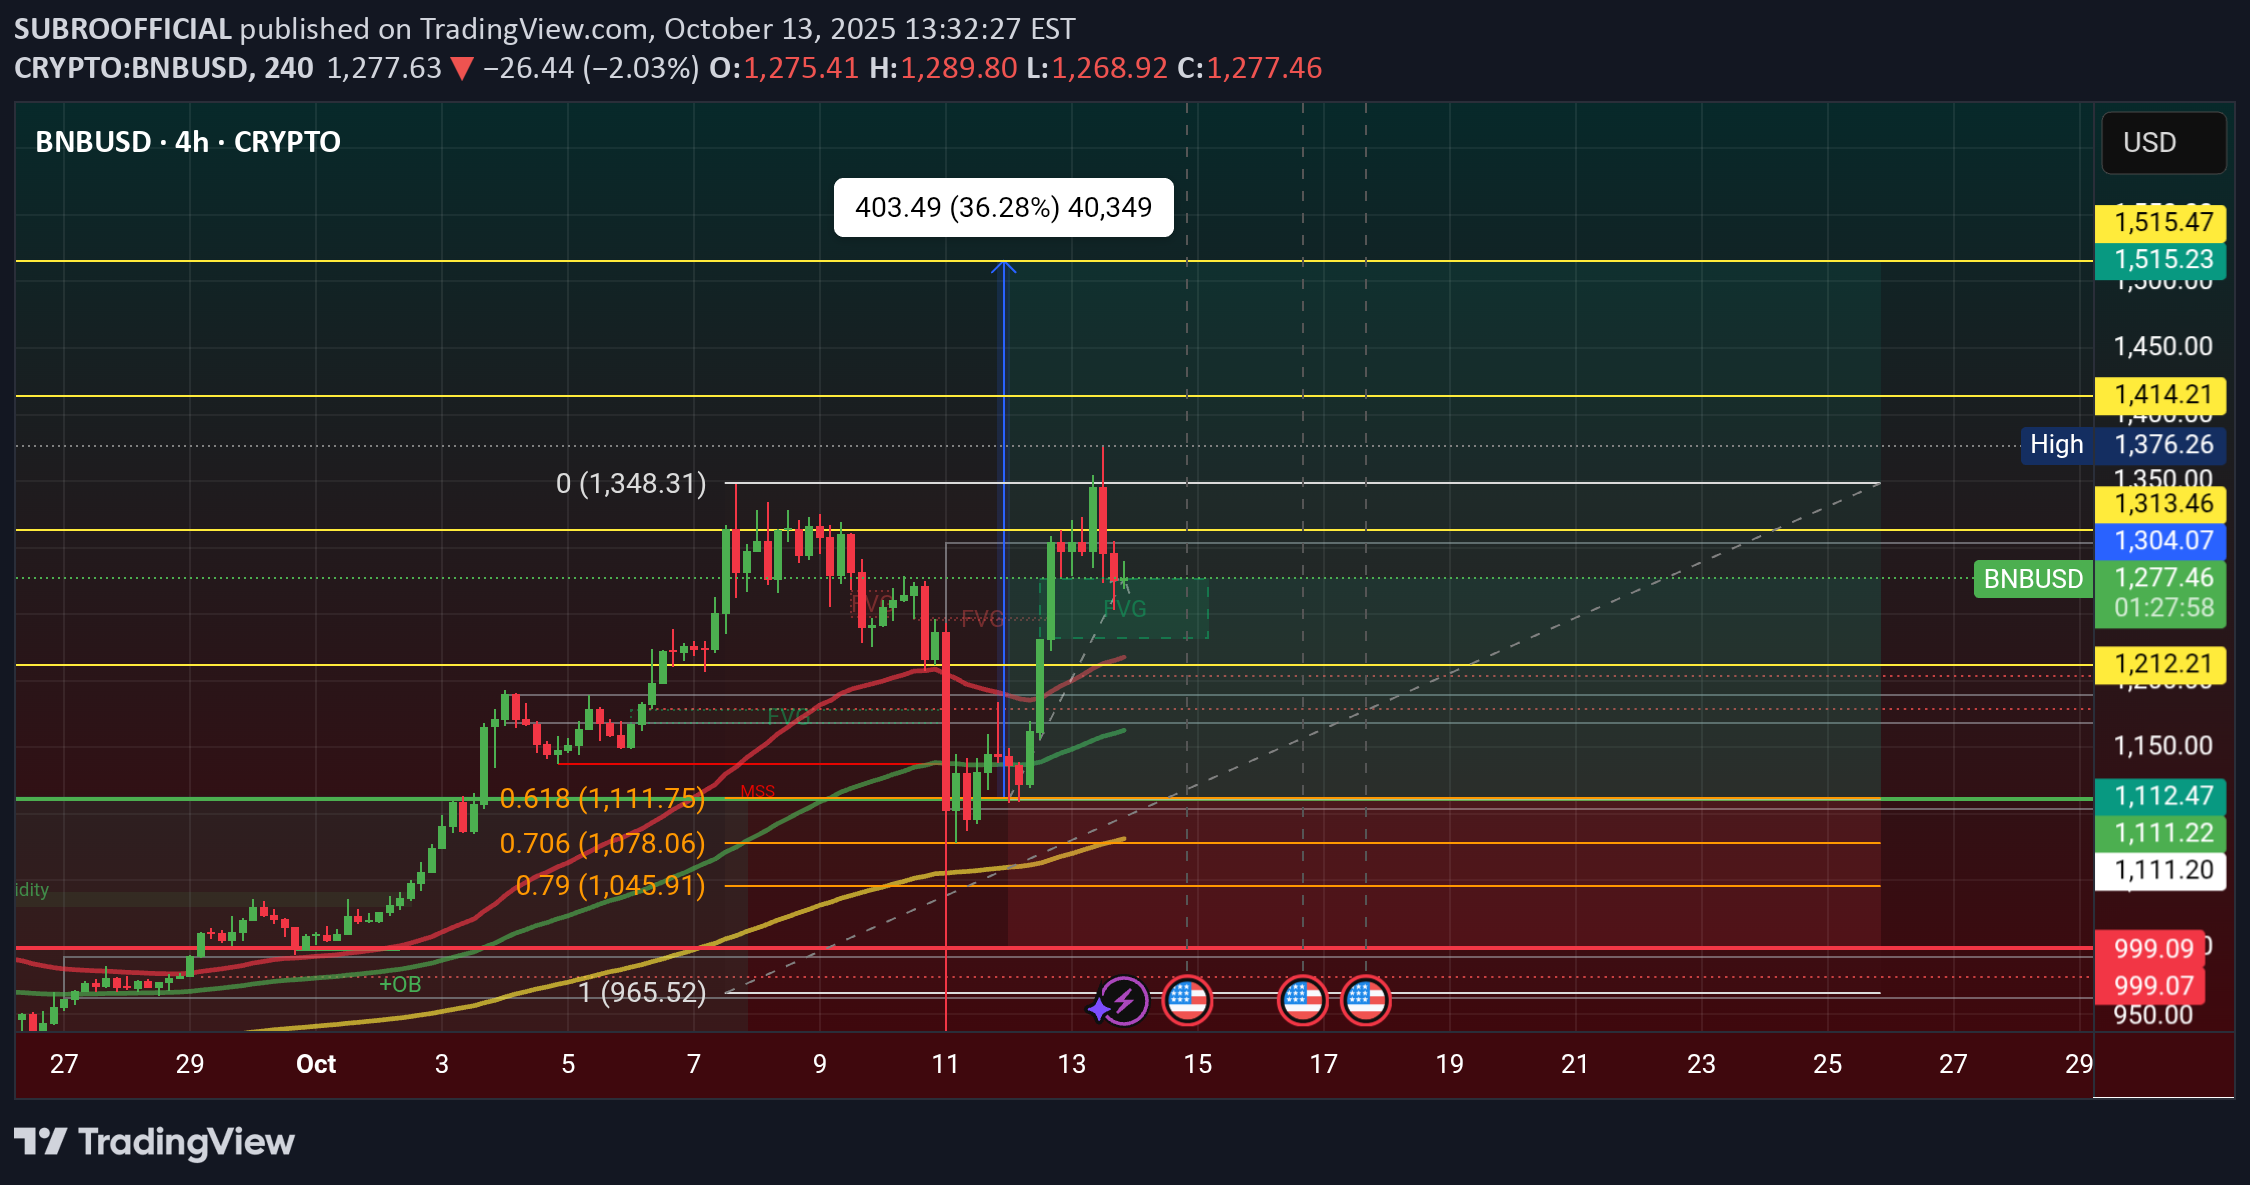
BNB Price Will Hit $1,515 in this Q4 of 2025, See more chart...The previous Resistance area is $888 and now it's Strong Support Zone. Chart is Showing the Price order block area is $999 area. The Main Enty is $1,111 this area. The Major Resistance is $1,212 area and last think this and The Dynamic Resistance is $1,313 area. The 4 Point of Profit area. 1st Target will $1,212 area, 2nd Target will $1,313 and 3rd Target will $1,414 area, 4th Target will $1,515 area. Stoploss will $999 area oand always use it. Never losing your all assets. just every trade using your strategy but it's will have using Stoploss and setup your Mind. The Losing Trade you will get if you don't use Stoploss on everyone. Now Price Bounce Back $1,212 but if it's break the Resistance Area than it's will happened Fake Breakout. But price will Downfall again, if its breakout the ATH area than confirmed price goes to the $1,515 will touch Price level area. #Write2Earn #BinanceSquareFamily #Binance #BNB #SUBROOFFICIAL Disclaimer: This article is for informational purposes only and does not constitute financial advice. Always conduct your own research before making any investment decisions. Digital asset prices are subject to high market risk and price volatility. The value of your investment may go down or up, and you may not get back the amount invested. You are solely responsible for your investment decisions and Binance is not available for any losses you may incur. Past performance is not a reliable predictor of future performance. You should only invest in products you are familiar with and where you understand the risks. You should carefully consider your investment experience, financial situation, investment objectives and risk tolerance and consult an independent financial adviser prior to making any investment.
SUBROOFFICIAL
الگوی پرچم صعودی در نمودار SUI: آیا قیمت تا 7 دلار جهش میکند؟

SUI Showing a Bullish Flag Pattern Day Chart $7 Soon 2026 SUI was Showing a Reversal Pattern and now Reverse the Price. 3 Weekly showing a Bullish Flag Pattern in Day Chart. It's a Continuation Pattern. It's going to Upward Movement on Directly. SUI Strong Support $2, Open position $3 and Strong Resistance $5, Never forget Target $7 and $11 in 2026 #Write2Earn #BinanceSquareFamily #Binance #SUI #SUBROOFFICIAL Disclaimer: This article is for informational purposes only and does not constitute financial advice. Always conduct your own research before making any investment decisions. Digital asset prices are subject to high market risk and price volatility. The value of your investment may go down or up, and you may not get back the amount invested. You are solely responsible for your investment decisions and Binance is not available for any losses you may incur. Past performance is not a reliable predictor of future performance. You should only invest in products you are familiar with and where you understand the risks. You should carefully consider your investment experience, financial situation, investment objectives and risk tolerance and consult an independent financial adviser prior to making any investment.
SUBROOFFICIAL
بیت کوین روی ۱۲۳ هزار دلار؛ آیا "ماهصعودی" (Uptober) رکورد جدیدی میسازد؟

BTC SURPRISED STEP BY STEP $111K $115K $122K 2026 WILL MORE SURPRISED 2028 OF FUTURE $122K $133K $144K $155K $166K $177K $188K $199K $211K Bitcoin (BTC) to Hit Standard Chartered Predicts At press time, it is trading within striking distance of a neW record high at $123,646. The cryptocurrency's current record high of $124,517 was logged on Aug. 14 on Bitsamp. tandard Chartered believes that a prolonged shutdown will be bullish for Bitcoin. Kendrick has noted that Bitcoin has a positive correlation with U.S. Treasury term premiums, which represent the extra yield that comes with holding longer-term bonds. They are currently on the rise due to significant uncertainty caused by the U.S. government shutdown. Polymarket odds According to Polymarket bettors, Bitcoin currently has a 7% chance of surpassing $200,000. At the same time, the odds of Bitcoin surpassing $135,000 as early as this October currently stand at 32%. Meanwhile, there is also a 5% chance of Bitcoin dropping back below $100,000 this October. #Write2Earn #BinanceSquareFamily #Binance #BTC☀ #SUBROOFFICIAL Disclaimer: This article is for informational purposes only and does not constitute financial advice. Always conduct your own research before making any investment decisions. Digital asset prices are subject to high market risk and price volatility. The value of your investment may go down or up, and you may not get back the amount invested. You are solely responsible for your investment decisions and Binance is not available for any losses you may incur. Past performance is not a reliable predictor of future performance. You should only invest in products you are familiar with and where you understand the risks. You should carefully consider your investment experience, financial situation, investment objectives and risk tolerance and consult an independent financial adviser prior to making any investment.Bitcoin Weekly Forecast: Will "Uptober" deliver? Bitcoin rallies nearly 7% so far this week as a strong month in terms of Bitcoin performance begins. Institutional demand rises, with $2.25 billion in spot ETF inflows, as well as continued BTC purchases from big corporates. Risk-on sentiment strengthens as traders fully price in a Fed rate cut in October despite the uncertainty from the US government shutdown. Bitcoin (BTC) price hovers around $120,000 at the time of writing on Friday, following a strong weekly rally of nearly 7% amid optimism surrounding the ‘Uptober’ narrative. Institutional demand supports the price rise, with BTC’s spot Exchange Traded Funds (ETFs) recording a weekly inflow of over $2 billion, while firms such as Metaplanet and Strategy add BTC to their reserves. Adding to this bullish outlook, risk-on sentiment strengthens as market participants price in an over 97% chance that the US Federal Reserve (Fed) will lower borrowing costs on October 29. Positive returns in Q3, strong Q4 ahead? Bitcoin price closed September on a positive note, with a 5.16% gain, finishing above $114,000. Looking at the quarterly results, BTC’s third quarter as a whole delivered a modest 6.31% gain, as shown in the Coinglass chart below. Historical data for Bitcoin shows that October has generally delivered a high return for the cryptocurrency, averaging 20.62%, hence the market terming it as a ‘Uptober’ rally. For the past 11 years (from 2013 to 2024), BTC has had a positive return nine times. Adding to this optimism, the fourth quarter (Q4) has also been the best quarter for BTC , with an average of 78.88% gains. If such a pattern repeats in 2025, BTC could reach new highs by the end of the year. Macroeconomic conditions support Bitcoin Bitcoin price rally was supported by favorable macroeconomic conditions this week even as the US government began a shutdown after Congress failed to pass a funding bill. The news pressured the US Dollar (USD), which slipped under modest selling pressure, and with BTC’s inverse correlation to the USD, the cryptocurrency surged. Adding to this, the Automatic Data Processing (ADP) reported on Wednesday that private-sector employers shed 32,000 jobs in September, marking the biggest drop since March 2023. Moreover, the August payrolls number was revised to show a loss of 3,000, compared to an increase of 54,000 initially reported. The data reinforced bets for two more interest-rate cuts by the Federal Reserve by the year-end. According to the CME Group’s FedWatch tool, traders are pricing in an over 97% chance that the US Federal Reserve will lower borrowing costs by 25 basis points on October 29. Return of institutional investors Bitcoin price surge was also supported by strong institutional demand this week. According to SoSoValue data (chart below), Bitcoin spot ETFs recorded a total of $2.25 billion in inflows as of Thursday, the highest weekly inflow since mid-September and more than offsetting the $902.5 million outflows seen in the previous week. On the corporate front, Japanese investment firm Metaplanet purchased an additional 5,268 BTC, bringing the firm’s total holdings to 30,823 BTC on Wednesday. Strategy also announced that it had added 196 BTC to its reserve, bringing the total to 640,031 BTC. Several altcoin ETFs to launch in October The approval of many spot altcoin ETFs, expected in the next few weeks, could further fuel the "Uptober" narrative. The US Securities and Exchange Commission (SEC) has recently approved generic listing standards to streamline ETF approvals, setting the stage for prompt approvals. In this regard, K33 Research said this week that ETFs are a potential catalyst for altering crypto sentiment. The analyst writing the report said that many altcoins are expected to see ETF launches throughout October, which may reinvigorate bullish demand. Following the launch of BTC ETFs, Vanguard is reportedly exploring offering crypto ETFs to its brokerage clients, a meaningful development after nearly two years of repeated skepticism. However, the analyst concluded that the market still faces elevated uncertainties due to the partial shutdown of the US government, which might impact liquidity, delay economic data releases and even altcoin ETF approvals. Alongside the shutdown, major Asian markets are entering banking holidays, which may further soften liquidity in the near term. Exchange reserve hits its lowest since 2018 CryptoQuant's Bitcoin Exchange Reserve - All Exchanges chart below shows that the reserve has dropped to 2.4 million this week, extending its decline since early September. The BTC reserve at the exchange has reached its lowest level since 2018, indicating lower selling pressure from investors and a reduced supply available for trading. A drop in reserve also signals an increasing scarcity of coins, an occurrence typically associated with bullish market movements. Some signs of concern BTC futures CME (Chicago Mercantile Exchange) 4-hour chart shows a gap between $110,990 and $111,355 caused by the weekend Bitcoin move. Historically, the market tends to fill these gaps before resuming its ongoing trend. Traders should closely monitor these levels, as BTC could first retrace toward this gap before resuming its rally. Will BTC reach a new all-time high? BTC recovered nearly 7% so far this week. At the time of writing on Friday, trading around the psychological level at $120,000 (which is the highest weekly close). If BTC closes above $120,000 on a weekly basis, it could extend the rally toward the all-time high of $124,474. If a successful close above this level occurs, BTC would enter price discovery mode, with a target at $145,159, which aligns with the 141.40% Fibonacci extension level drawn from the April low of $74,508 to the ATH at $124,474. The Relative Strength Index (RSI) on the weekly chart reads 60, which is above its neutral level of 50, indicating that bullish momentum is gaining traction. On the daily chart, Bitcoin started the week on a positive note, adding 1.92% on Monday and closing above the 50-day Exponential Moving Average (EMA) at $114,076. However, on Tuesday, BTC declined slightly but found support around the 50-day EMA, continuing its rally for the next two days and closing above $120,000. The RSI on the daily chart reads 63, above the neutral level of 50, indicating bullish momentum. Additionally, the Moving Average Convergence Divergence (MACD) showed a bullish crossover on Wednesday, providing a buy signal and suggesting the start of an upward trend ahead. If BTC faces a correction, it could extend the decline toward the daily support at $116,000. Price will Stay under $130K.
SUBROOFFICIAL
جهش باورنکردنی قیمت BNB به ۱,۱۱۱ دلار: آیا این تازه شروع است؟

BNB SURPRISED $1,111 INCREDIBLE PRICE DONE ($999-$1,111) Previous Incredible Price 2025 $777 $888 $999 $1,111 Future Incredible Price 2028 $2,222 $3,333 $4,444 #Write2Earn #BinanceSquareFamily #Binance #BNB #SUBROOFFICIAL Disclaimer: This article is for informational purposes only and does not constitute financial advice. Always conduct your own research before making any investment decisions. Digital asset prices are subject to high market risk and price volatility. The value of your investment may go down or up, and you may not get back the amount invested. You are solely responsible for your investment decisions and Binance is not available for any losses you may incur. Past performance is not a reliable predictor of future performance. You should only invest in products you are familiar with and where you understand the risks. You should carefully consider your investment experience, financial situation, investment objectives and risk tolerance and consult an independent financial adviser prior to making any investment.
SUBROOFFICIAL
آلرت! جهش انفجاری قیمت ارز APT: راز رسیدن به ۱۱ دلار در ۲۰۲۵ فاش شد!

APT Surprised $5.11 Today & Breakout Confirmed, price will Drive $11 on this 4th Quarter of 2025 Here’s Why Aptos (APT) Price Is Up Today Aptos price is having a strong day, up more than 10% and now trading around $5.06, with trading volume climbing by 16%. The move comes after a series of bullish developments that have given traders plenty to get excited about. One of the main reasons behind the surge is Aptos’ new partnership with World Liberty Financial (WLFI). Together, they’re bringing the USD1 stablecoin onto the Aptos blockchain, with the launch expected by October 6. USD1 is already the fifth-largest stablecoin with a market cap of about $2.7 billion, and its arrival on Aptos is seen as a major liquidity boost. Stablecoins usually drive more DeFi activity, and APT’s price jump from $3.92 to $4.86 right after the news shows just how much optimism this created. What the APT Chart Is Showing Looking at the 4-hour chart, Aptos price has broken out of a downtrend that kept it under pressure for weeks. The price pushed up from the $4.20 support zone and is now testing resistance just above $5. The rally marks the strongest momentum since early July. The RSI is approaching 70, showing strong buying strength but not yet at extreme overbought levels. The MACD is firmly green, and the widening histogram signals fresh momentum on the upside. Open interest is holding near 8.97 million, while net shorts are dropping, a sign that sellers are closing out positions. Net longs remain steady, suggesting this move is being powered more by new inflows than leveraged bets. If Aptos price can maintain its position above the $5 level, the next significant test will be around $5.40 to $5.60, which corresponds to the last local high. On the other hand, if the rally cools, $4.60 is the first support zone to watch. APT Price Short-Term Outlook Aptos looks strong going into October. The combination of fresh liquidity from the stablecoin launch and a new institutional product gives it both hype and substance. If the bullish momentum continues, a push toward $5.60 seems realistic in the short term, with room for a run toward $6.20 later this month. Of course, holding above $5 is key. As long as Aptos price defends that level, the trend favors the bulls. Right now, the market seems to agree that Aptos has found fresh energy at just the right time. #Write2Earn #BinanceSquareFamily #Binance #BTC☀ #SUBROOFFICIAL Disclaimer: This article is for informational purposes only and does not constitute financial advice. Always conduct your own research before making any investment decisions. Digital asset prices are subject to high market risk and price volatility. The value of your investment may go down or up, and you may not get back the amount invested. You are solely responsible for your investment decisions and Binance is not available for any losses you may incur. Past performance is not a reliable predictor of future performance. You should only invest in products you are familiar with and where you understand the risks. You should carefully consider your investment experience, financial situation, investment objectives and risk tolerance and consult an independent financial adviser prior to making any investment.
Disclaimer
Any content and materials included in Sahmeto's website and official communication channels are a compilation of personal opinions and analyses and are not binding. They do not constitute any recommendation for buying, selling, entering or exiting the stock market and cryptocurrency market. Also, all news and analyses included in the website and channels are merely republished information from official and unofficial domestic and foreign sources, and it is obvious that users of the said content are responsible for following up and ensuring the authenticity and accuracy of the materials. Therefore, while disclaiming responsibility, it is declared that the responsibility for any decision-making, action, and potential profit and loss in the capital market and cryptocurrency market lies with the trader.