
SRFXGlobal
@t_SRFXGlobal

What symbols does the trader recommend buying?
Purchase History
پیام های تریدر
Filter
SRFXGlobal
LINK SWING BUY SETUP!
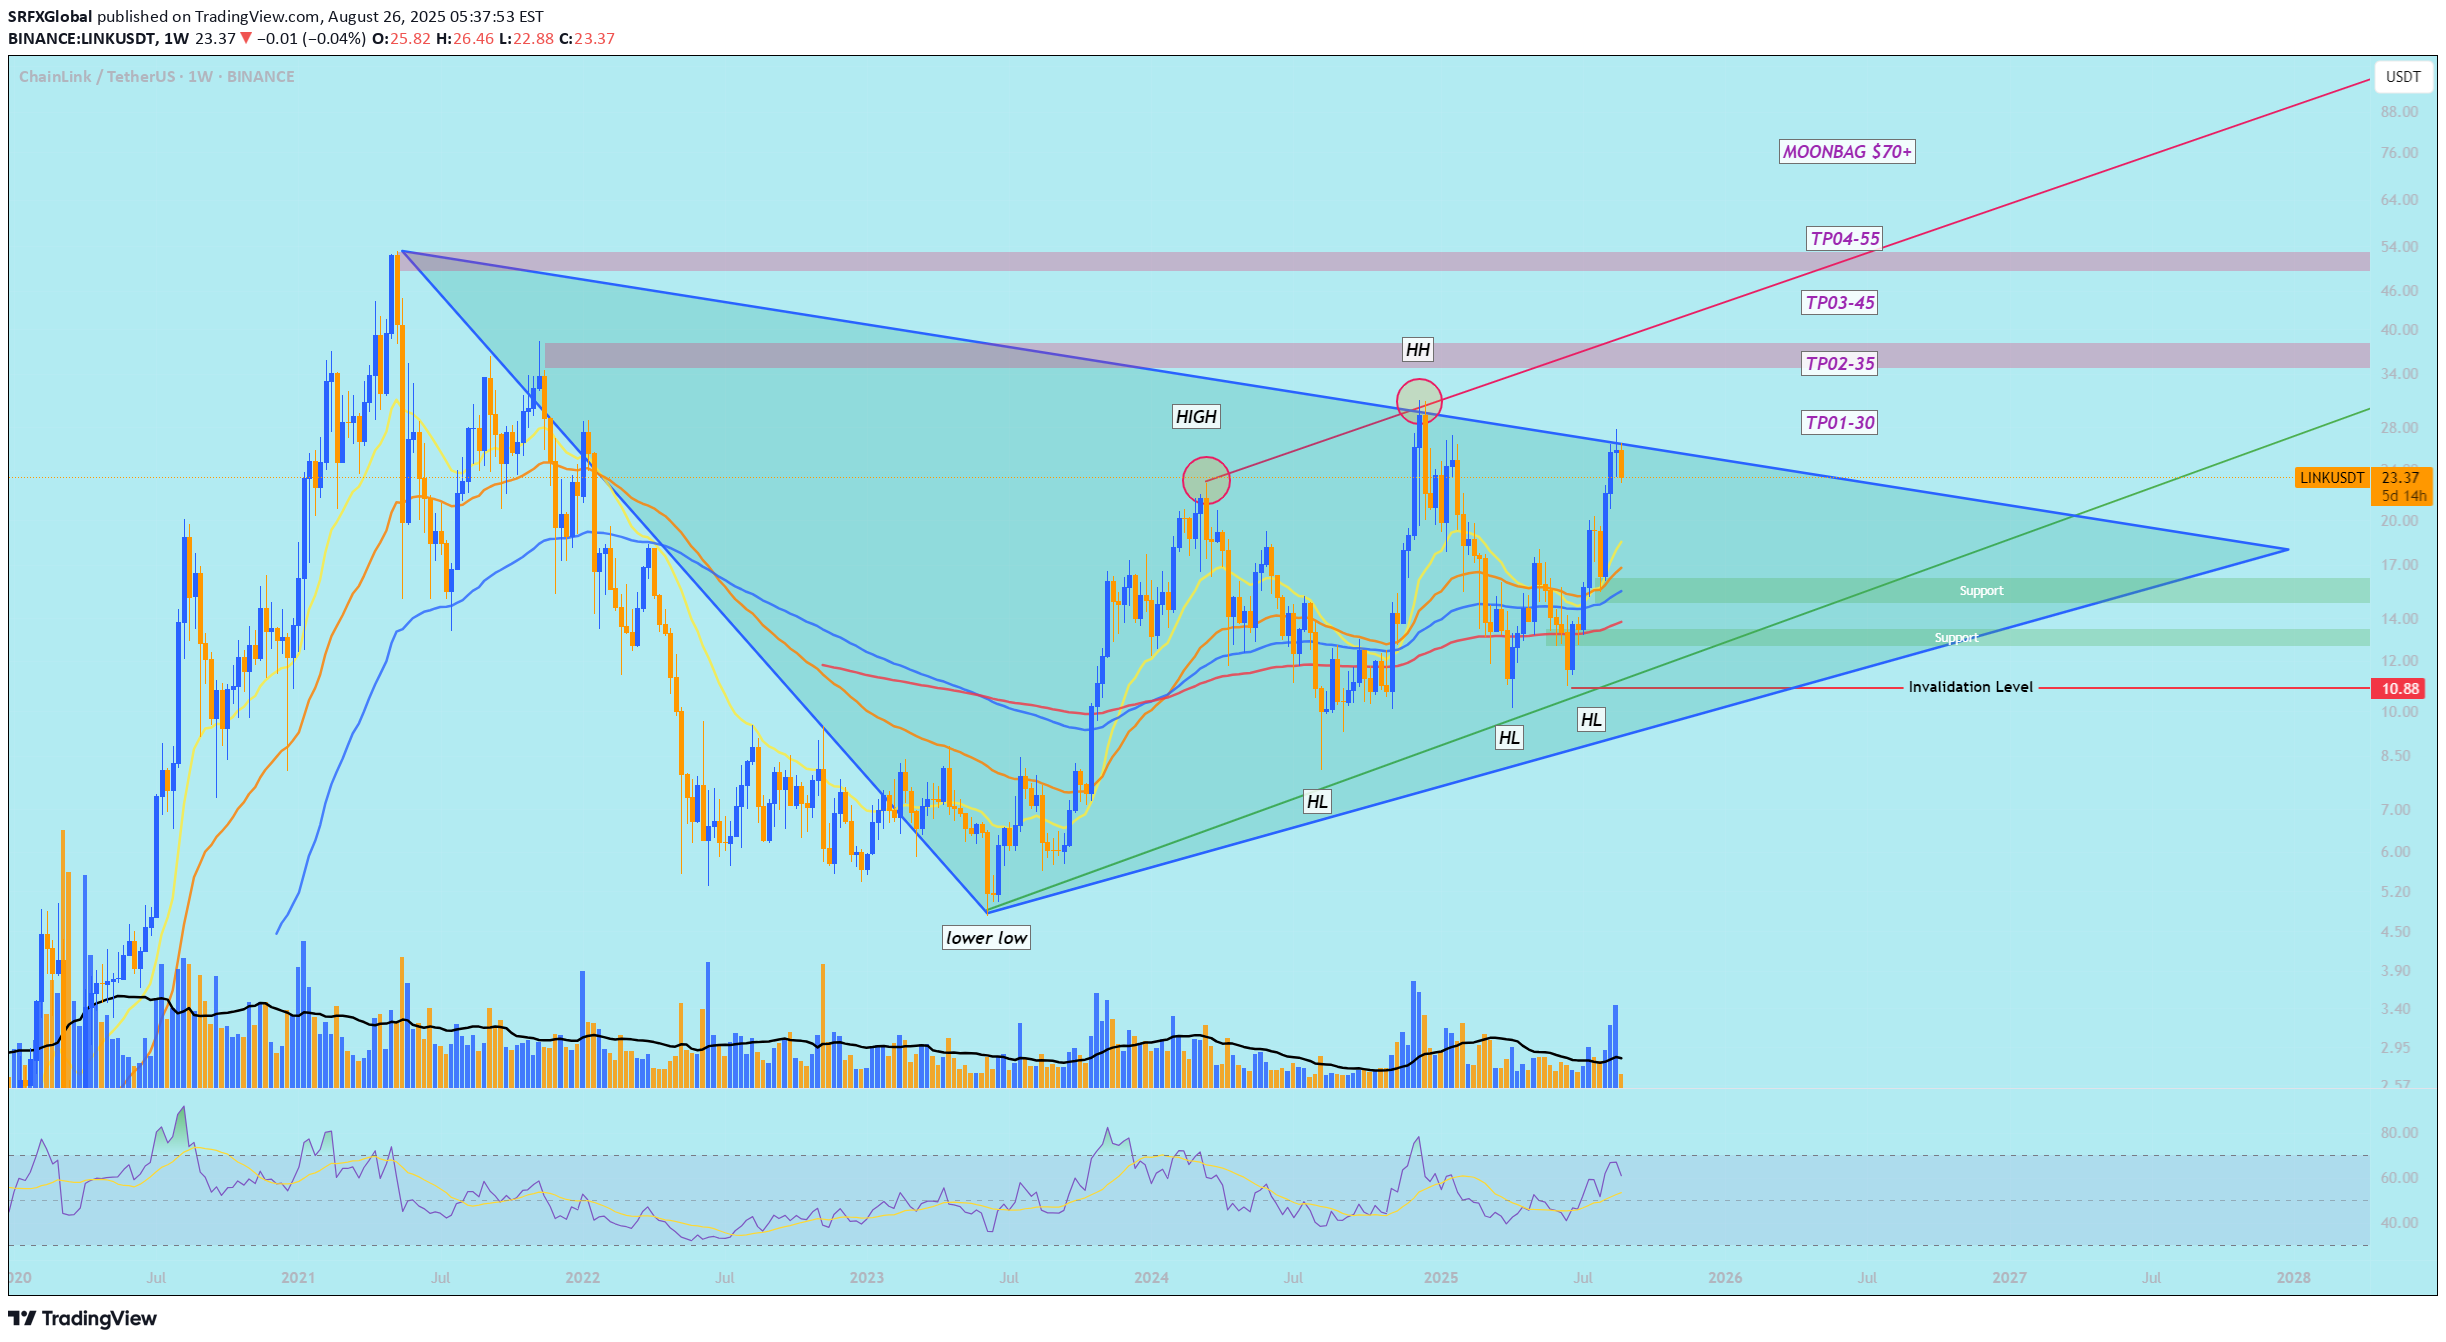
LINKUSDT Last update note - Telegram channel update date: 7th April 2025 - Price at that time: around $10 - It’s already done 2X on the current run ($22.9 now) Market context - Trend: The last three weeks show sustained up-move with rising volume, suggesting accumulation and growing demand. Price action scenarios 1) Bullish breakout scenario: - Price breaches immediate resistance with a clean daily close above it. - Volume spikes on breakout; subsequent days maintain higher highs/higher lows. - Path toward TP1 (30) then TP2 (35), TP3 (45), TP4 (55), with potential to push toward Moonbag (70+), contingent on continued demand and broad market strength. 2) Pullback/retest scenario: - Price retreats toward the $18–$22 zone and reclaims with bullish continuation, offering a safer entry with a lower risk. - A successful retest with volume support can provide favourable odds for a breakout. Remember, not all coins will reach their all-time highs in this bull run. However, Chainlink (LINK) has strong potential to reach $70. Don’t miss out on LINK. Manage your risk, and good luck, traders! Please do not forget the ✅' like'✅ button 🙏😊 & Share it with your friends; thanks, and Trade safe.
SRFXGlobal
OP SWING LONG SETUP!
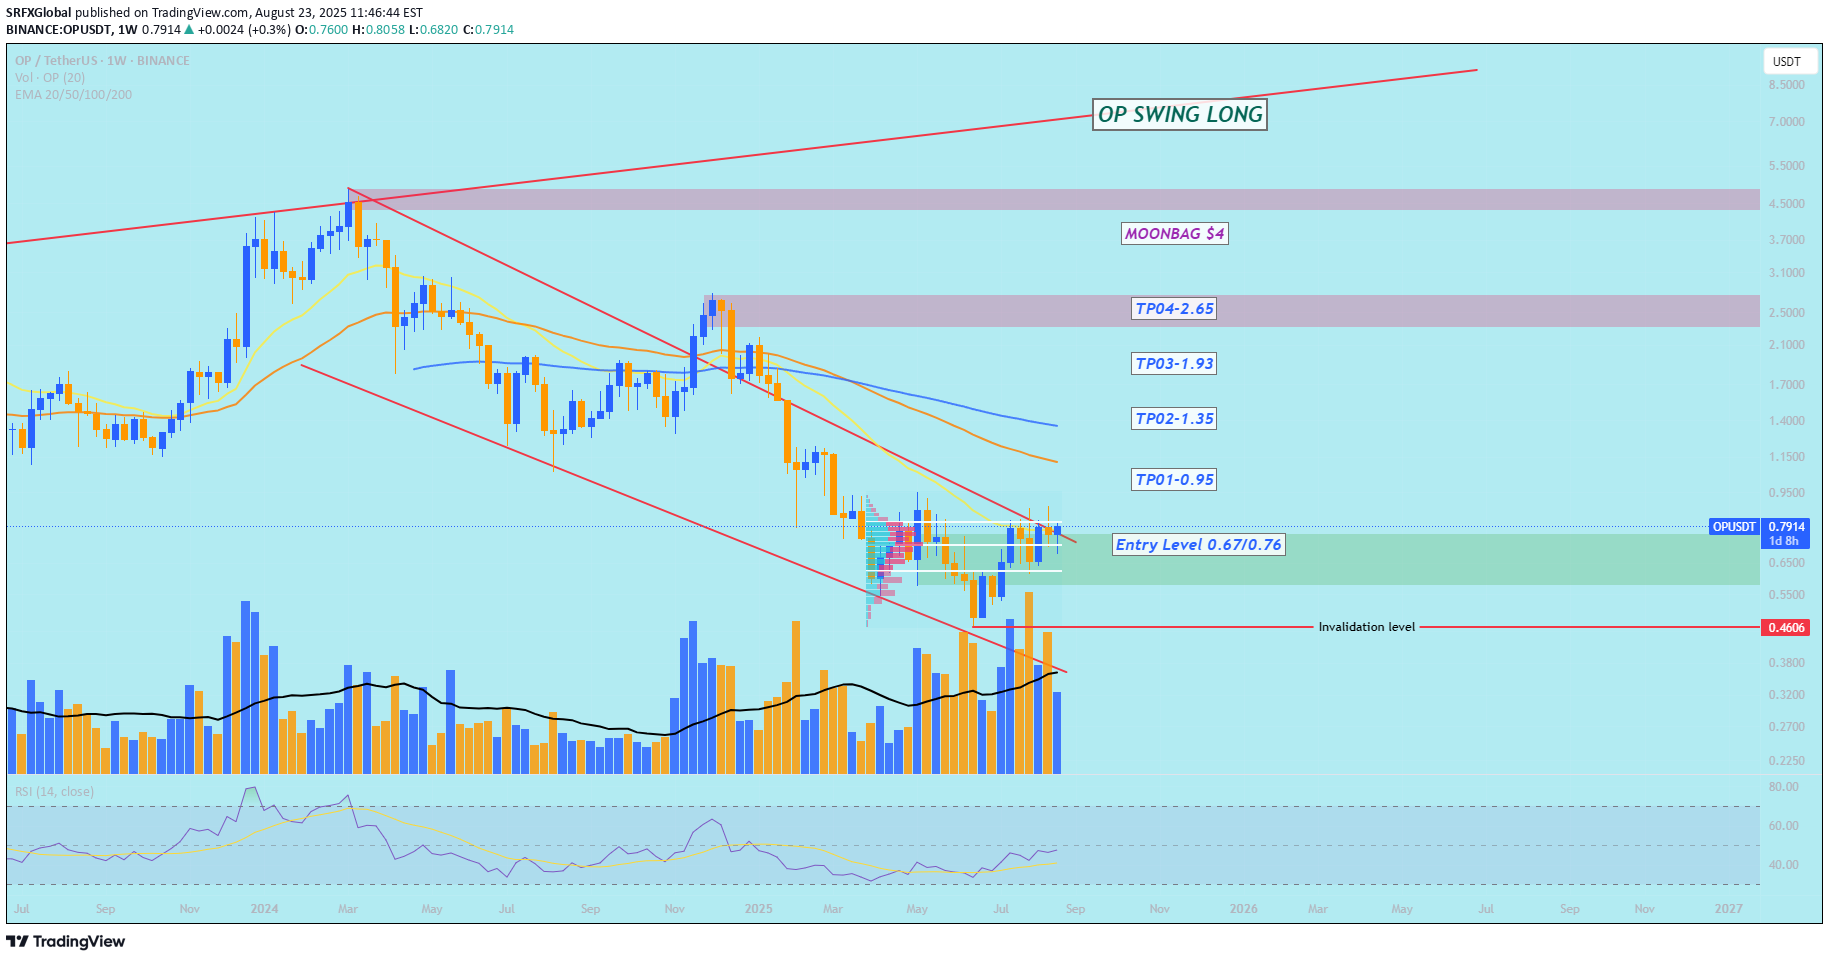
Summary / bias - Bias: cautiously bullish (swing long) while price respects the 0.67–0.76 buy zone and shows confirmation on the weekly timeframe. ⏰✅ - Context: after 21 weeks in a range, price is attempting a breakout from the OP range — a logical place for swing entries if the breakout holds. Entry / setup - Buy area: 0.67–0.76 — considered a tactical buying zone on a retest or within-range entry. 💶/💵 - Preferred trigger: weekly candle close within or above the buy zone with supporting momentum (better) — otherwise consider scaling in or waiting for confirmation. Invalidation / stop - Invalidation level: weekly close below 0.4606. Use this to define your hard stop and position size so risk per trade matches your rules. ❌⚠️ - Note: invalidation is “weak” (large distance) — size positions accordingly and consider smaller allocation or staggered entries. Targets / profit-taking - Primary TPs (take partial profits at each): - TP1: 0.95 🎯 - TP2: 1.35 🎯 - TP3: 1.93 🎯 - TP4: 2.65 🎯 - Moongbag zone (longer-term hold): 4.00–4.25 — strong supply zone for very long-term exposure or leftover position. 🌙💰 Trade plan (simple) - Entry: buy within 0.67–0.76 (or wait for weekly confirmation above this area). - Stop: below weekly close 0.4606 (set based on your risk tolerance). - Exits: scale out at TPs listed above; consider trailing stops after TP2 to protect profits. - Position sizing: because invalidation is far, size so the dollar risk is acceptable (e.g., 1–2% of account per trade). Confirmation checklist (before committing) - Weekly close in/above buy zone? ✅ - Momentum supporting the move (RSI rising, bullish candle structure)? ✅ - Volume (or other flow metrics) supportive on breakout/retest? ✅ Risks / things to watch - False breakout: after 21 weeks of range, expect chop and possible pullbacks — rejection at the buy zone or higher resistance can occur. - Macro/news: large events can trigger whipsaws — avoid entering right before high-impact data if you can. - Wide invalidation: keep position size conservative because stop is distant. - Use discipline: scale into positions if unsure, take partial profits at each TP, and trail stops to protect gains. Final note - This is a viable swing-long edge while price respects the 0.67–0.76 area and weekly confirmation occurs. Trade wisely, manage risk, and adapt if price structure changes. Good luck, traders! 🍀📈 Please follow your strategy and updates; this is just Our Idea, and We will gladly see your ideas in this post. Please do not forget the ✅' like'✅ button 🙏😊 & Share it with your friends; thanks, and Trade safe. OPUSDT
SRFXGlobal
### Technical Analysis of Gold 4 Hour(XAU/USD)

### Technical Analysis of Gold 4 Hour(XAU/USD) #### OverviewThe chart displays the 4-hour price action for Gold (XAU/USD) with various technical indicators, including Simple Moving Averages (SMA) and Exponential Moving Averages (EMA), along with support and resistance levels. The displayed time frame suggests that this analysis focuses on short to medium-term trading strategies.#### Current Price Action- **Current Price**: The price of Gold is currently at approximately **3,325.13**. The price has recently bounced off a significant support level and is in a critical zone, indicating potential price action volatility.#### Trend Analysis- **Long-Term Trend**: The blue diagonal line illustrates an upward trend that started in early April. Gold’s price has consistently been above this trendline, indicating bullish sentiment in the market.- **Short-Term Trend**: In the last week, the price peaked around **3432** but has since retraced towards the trendline. The price action suggests a consolidation phase currently on the chart.#### Indicators- **Moving Averages**: - **SMA(50)**: It is bullish at **3,312.79**as the price remains above this moving average. - **SMA(20)**: The shorter SMA at **3,363.54** indicates potential short-term resistance. - **EMA (20)**: The EMA is slightly below the price at **3,295.59**, offering support if the price approaches this level. The proximity of the price to the moving averages indicates an area of dynamic support and resistance, where traders may look for guidance on entry and exit points.#### Support and Resistance Levels- **Resistance Levels**: - Clear resistance is observed at **3355/3370** - The upward red trendline 3400/3416/3480 could also serve as dynamic resistance in the future.- **Support Levels**: - Strong support is found at **3,288.92**, coinciding with the recent consolidation's lower edges. The blue trendline provides additional support near **3,290**. - Key support levels below are **3,264** and more significantly around **3,220 and 3,144**.#### Price Patterns- The chart displays a potential pennant formation, which generally precedes continuing the existing trend. Traders should be alert for breakout signals, either above resistance or below support, suggesting potential price movement toward the breakout.#### Trade Considerations- **Bullish Scenario**: A bullish breakout above the resistance level of **3365** with increasing volume could cement a further move towards the highs around **3410** or **3480**. - **Bearish Scenario**: Conversely, a decisive break below the **blue trendline** or **support at 3,280** may trigger further downside with targets around **3,230/3200/3140** or lower.#### ConclusionThe current price suggests that Gold is testing critical support levels while remaining in a longer-term uptrend. Traders should look for confirmation of direction through breakout patterns, volume, and market context. Monitoring economic data affecting Gold prices and general market sentiment will also be essential for making informed trading decisions.We may not know what will happen, but we can prepare ourselves to respond effectively to whatever unfolds.Stay grounded, stay present.🏄🏼♂️Your comments and support are appreciated! 👊🏼 XAUUSD
SRFXGlobal
Gold Technical Analysis Update:(XAUUSD)

XAUUSD Not much has changed since my last update—gold remains stuck in the same range-bound, triangle pattern we've been tracking. The price action is definitely tightening, which usually means we're getting closer to a decisive breakout.Key Levels: - Support: 3300 is holding firm as a strong support level. - Resistance: 3350 continues to cap the price as a major resistance, keeping gold within a wide range.My outlook remains bearish for the short term, especially as gold is still trading below the golden Fibonacci zone (3375-3420). The weekly close also confirmed that sellers remain in control for now.Today’s monthly close is particularly important and could set the tone for the next move:- If gold finishes below 3330, this will strengthen the bearish outlook and open the door for a drop towards 3250, 3200, 3150, and even 3070.- However, a breakout above the triangle and 3350 would force a reassessment of the short-term direction.For now, I’m waiting for a clear breakout from this range to confirm the next major move. Personal trade plan: - I believe we can enter a sell trade here, with targets at 3250/3200/3150/3070.- My stop loss is set at a 4-hour candle close above 3335.As always, manage your risk and trade wisely. Good luck, traders! 🏆💰
SRFXGlobal
Gold Swing Short Trade Setup

**Gold Market Analysis: Potential Reversal Formation**Gold is finally showing strong signs of a potential top formation after an extended bullish run. After weeks of anticipation, yesterday's price action delivered a significant rejection candle at the psychologically important 3500 level, which could indicate the reversal signal we've been waiting for.It's essential to recognize that in a robust bullish rally, tops can take longer to form than initially expected, as we've observed recently. The market often exhibits both time and price extensions in such conditions. Nevertheless, the rejection at 3500 in conjunction with the current technical setup suggests that we may be seeing a reversal pattern taking shape.**Trading Perspective:**From a trading standpoint, I am currently awaiting a confirmation candle (a follow-up to yesterday's rejection) to validate that the top is in place. If we witness follow-through selling pressure today or tomorrow, it could present an excellent swing short opportunity, with the following targets established:- **Target 1 (TP1):** 3295- **Target 2 (TP2):** 3250- **Target 3 (TP3):** 3200- **Target 4 (TP4):** 3170- **Target 5 (TP5):** 3070 (psychological support level)Stay vigilant and ready for potential short opportunities as the market unfolds. Let’s see if the signals align for a successful trade. Happy trading! XAUUSD XAUUSD XAUUSD XAUUSDTarget one has been completed.
SRFXGlobal
Gold Technical Analysis - Potential Trade Setup

Time Frame: 15-Minute and 4-Hour Pattern: Head and Shoulders Formation---Overview:Currently, on the 15-minute time frame, we observe a potential Head and Shoulders pattern forming, which could indicate a bearish reversal. As we analyze further, we identify that the B wave might be completing, setting us up for the upcoming C wave to the downside.Key Levels:- Invalidation Level (Head of the Pattern): 3246- Fibonacci Level (Key Area on 4-Hour Time Frame): 0.618---Trade Setup:Given the formation and confirmations, we suggest considering a sell trade:1. Entry Point: Monitor for a confirmation of the bearish move below the neckline of the head and shoulders pattern.2. Stop Loss: Place the stop loss slightly above the invalidation level of 3246 to mitigate risk.3. Take Profit Targets: - TP1: 3215 - TP2: 3205 - TP3: 3195 - TP4: 3180 -TP5: 3140Once the price moves below these levels, consider holding the sell trade down to a potential extreme target of 3140.If we break 3140, the next support zone between 3040 and 3050 could come into play, where I expect strong buying interest for intra-day trading---Risk Management:Always manage your risk appropriately. Ensure that your position size is in line with your risk tolerance and that your stop loss is strictly adhered to. Monitor the market closely, as patterns can evolve, and be prepared to adjust your strategy as needed.Conclusion:With the Head and Shoulders pattern and the identified Fibonacci level providing confluence for a potential downside move, we have a compelling setup for taking a sell position. Keep an eye on the market dynamics and make informed decisions.---Stay safe and trade wisely!TP 1 Hits With 200 Pips
SRFXGlobal
### Gold Important Analysis XAU/USD 04/07-04/11

XAUUSD Currently, there is a prevailing sentiment among traders leaning towards a bearish outlook. Many who missed their selling opportunity on Friday may experience regret, and upon witnessing any initial selling pressure on Monday, they are likely to jump in. This sets up a potential trap that I intend to exploit. I anticipate the market will either move sideways or experience a slight bullish uptick before we see any significant movement.It’s important to note that larger market players have already sold off positions from the all-time high of 3137. Meanwhile, retail traders have begun selling following the breach of key psychological levels. Those holding short positions overnight often place their stop losses near these critical levels, providing an opportunity for the market to manipulate their positions—this is precisely the strategy I plan to implement.While the broader market structure remains bearish and we could see a potential breakdown below the 3000 level in the coming days, I believe we might witness a brief bounce in the meantime.#### Current Market Conditions:The market is currently oscillating between key weighted levels, indicating a period of indecision. The primary levels to watch for potential breakouts and reversals are:- Resistance Level (Upper Gap): 3055- Support Level (Lower Gap): 3031#### Bullish Outlook: First Target 3055- Initial Bullish Target: If the price manages to cross and lock above 3055, this will trigger a subsequent bullish target of 3075.- Additional bullish targets with respective EMA5 locks: - 3075 → 3092 - 3092 → 3117 - 3117 → 3142#### Bearish Outlook:- Initial Bearish Target: Conversely, a cross and lock below 3031 will set up bearish momentum, targeting 3015.- Additional bearish targets with respective EMA5 locks: - 3015 → 2999 - 2999 → 2975 - 2975 → 2950Please follow your strategy and updates; this is just Our Idea, and We will gladly see your ideas in this post.Please do not forget the ✅' like'✅ button 🙏😊 & Share it with your friends; thanks, and Trade safe.
SRFXGlobal
Gold Technical Analysis- New ATH 3170+

XAUUSD Gold long NowEntry 3118/31291st target 31452nd target 31553rd target 31654th target 3185Invalid level 1hour Candle close below 31051st Target Completed & trade closed
SRFXGlobal
Gold Technical Analysis- New ATH Coming?

### XAUUSD Gold Technical AnalysisCurrent Price: 3022 Current Buyer Positioning: Holding at 3000 levels ---Overview:Gold is currently trading at 3022, with a focus on key resistance and support levels. Given the recent price action, we anticipate a potential bullish breakout if the 1-hour candle convincingly breaks above the 3039 level. A sustained move above this level could pave the way for new all-time highs.---Resistance Levels:1. Immediate Resistance: 3035 / 30402. Breakout Level: 30393. Potential Targets: - 3050 - 3060 - 3090If the price breaks above 3039 and holds, it will indicate bullish momentum, which could push the price toward our target levels of 3050, 3060, and possibly 3090.---Support Levels:1. Immediate Support: 3005 / 30102. Strong Support Levels: 2980 / 29873. Swing Buy Trade Area: 2939 / 2949In case of a pullback, we expect the 3005 / 3010 levels to provide immediate support. Strong support at 2980 / 2987 will act as a safety net. A further decline into the swing buy area (2939 / 2949) may present buying opportunities for traders looking to enter long positions.---Market Sentiment:Sentiment appears to be bullish based on current positioning. Buyers are firmly holding at the 3000 levels, which aligns with the expectation that gold will push higher.---Technical Indicators:- Moving Averages: Monitor the positions of the short-term averages versus long-term averages to gauge momentum.- RSI: Observe if the RSI remains below 70 to avoid the overbought territory, which could suggest maintaining a bullish posture while considering potential reversals at the upper resistance levels.---Chart Analysis:- You can observe the ascending trendline on the chart, indicating a bullish structure in recent price action.- Watch for any consolidation around the defined resistance levels as a breakout pattern may emerge.---Conclusion:The market is primed for potential upward movement, particularly if gold can break and hold above 3039. Traders should keep a close eye on both the resistance and support levels, as they will guide trading strategies going forward. The upcoming days are crucial for establishing direction, so risk management and alertness to price action are paramount.---Recommendations:1. Watch for Breakouts: If the price closes above 3039, consider entering a long position.2. Sell on Retracement: If a pullback occurs, buy in the swing zones to capitalize on potential upward movement.3. Set Stop-Losses: Always set stop-loss orders just below immediate support to manage risk.--- Traders If You Like this educational post, give it a boost and follow!3050/3060 Targets done.
SRFXGlobal
Technical Analysis for Uniswap (UNI/USDT)
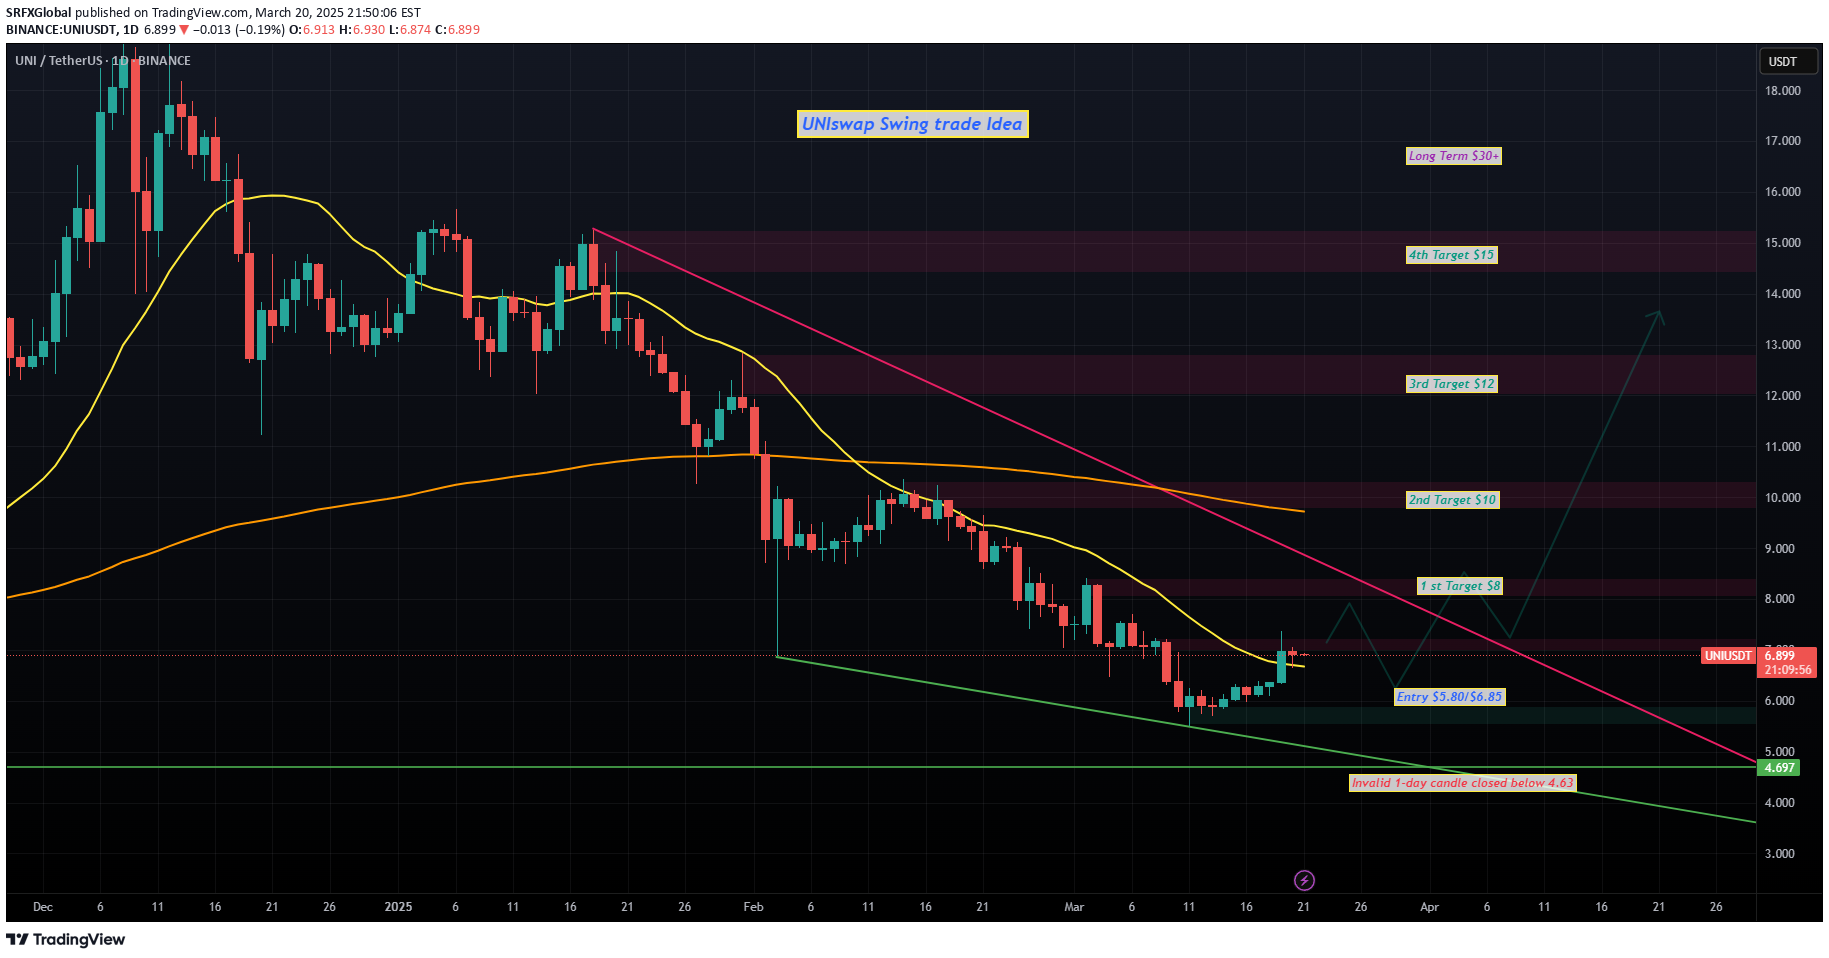
### Technical Analysis for Uniswap (UNI/USDT) UNIUSDT Current Price Level: $6.88 Time Frame: 1-day chart#### Trend AnalysisUniswap has been in a bearish trend since reaching a peak in the recent months, following a series of lower highs and lower lows. However, the price shows signs of potential reversal as it approaches crucial support levels, indicating a possible transition into a consolidation phase.#### Key Levels1. Support Levels: - Primary Support: $5.00 (green line) – This level has been tested multiple times and serves as a solid floor. - Invalidation Level: Below $4.63 – A daily close below this level would indicate a potential continuation of the bearish trend.2. Resistance Levels: - Short-Term Resistance: $8.00 - Targets for Swing Trade: - 1st Target: $8.00 - 2nd Target: $10.00 - 3rd Target: $12.00 - 4th Target: $15.00 - Long-Term Target: $30.00+#### Moving Averages- The price is currently above the 50-day (yellow line) and 200-day moving averages, which suggests a bullish momentum. A crossover where the 50-day MA crosses above the 200-day MA may indicate a solid buying opportunity.#### Chart Patterns- The recent price action appears to be forming an ascending triangle or bullish flag pattern, which typically precedes upward breakouts. The market trajectory suggests that Uniswap may be preparing for a price increase.#### Volume Analysis- Recent trading volume has increased during upward price action, suggesting accumulation by buyers. Continued volume spikes on upward moves will confirm the bullish sentiment.#### Technical Indicators- RSI: (Relative Strength Index) is approaching the 50 mark, signaling that the market momentum is shifting. A breakout above the 50 level could indicate bullish momentum. - MACD: The Moving Average Convergence Divergence indicator is showing signs of a bullish crossover. If this trend continues, it would suggest that upward momentum is gaining strength.### Conclusion and Trade StrategyConsidering the current technical setup for Uniswap:- Entry Point: $5.80 - $6.45 provides a high-risk reward ratio for traders looking to buy.- Targets: Use multi-tiered profit-taking strategies with the specified targets: $8.00, $10.00, $12.00, and $15.00 based on the progression of the price.- Stop Loss: Set a stop-loss order at $4.63 to minimize loss in case of a downward reversal.Final Note: Always consider external market factors and news that may impact crypto prices. Ensure risk management measures are in place when entering trades.
Disclaimer
Any content and materials included in Sahmeto's website and official communication channels are a compilation of personal opinions and analyses and are not binding. They do not constitute any recommendation for buying, selling, entering or exiting the stock market and cryptocurrency market. Also, all news and analyses included in the website and channels are merely republished information from official and unofficial domestic and foreign sources, and it is obvious that users of the said content are responsible for following up and ensuring the authenticity and accuracy of the materials. Therefore, while disclaiming responsibility, it is declared that the responsibility for any decision-making, action, and potential profit and loss in the capital market and cryptocurrency market lies with the trader.