
SOAM_PRO_TRADER
@t_SOAM_PRO_TRADER

What symbols does the trader recommend buying?
Purchase History
پیام های تریدر
Filter
SOAM_PRO_TRADER
تحلیل بیت کوین: پایان کانال صعودی و آغاز ریزش ناگهانی!
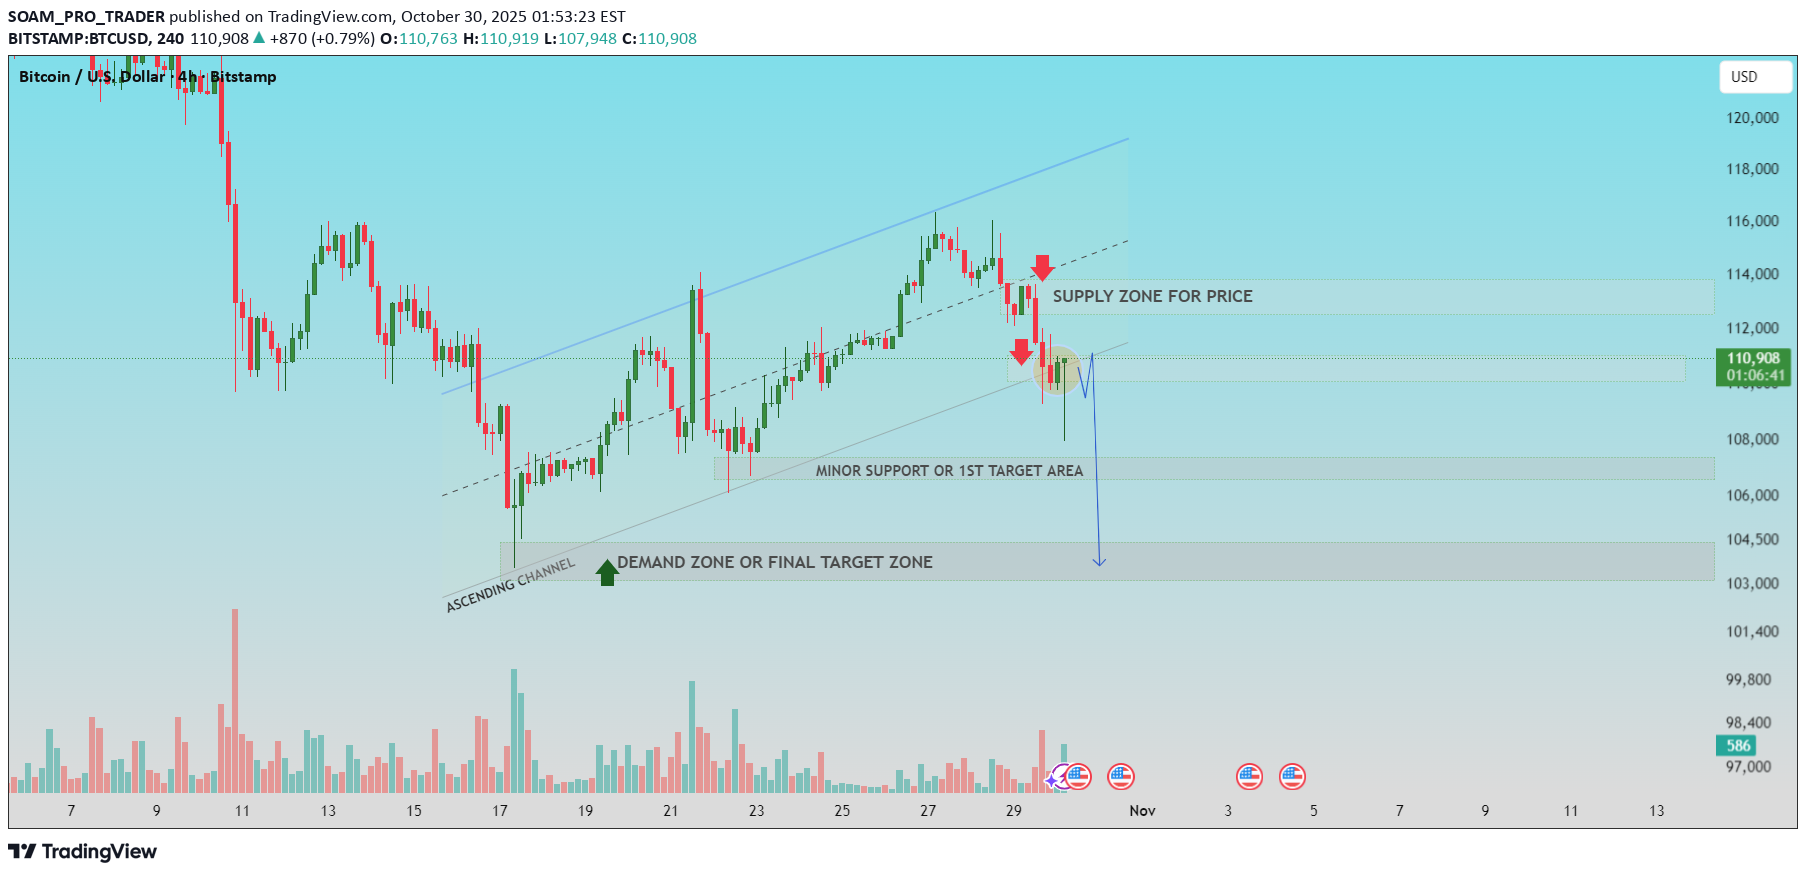
🔹Bitcoin (BTC/USD) Technical Analysis ▪Market Structure: Bitcoin recently traded within an ascending channel, showing higher highs and higher lows. However, the recent break below the channel support line indicates that bullish momentum is weakening. This breakdown suggests the market may shift into a short-term corrective phase before deciding its next trend direction. ▪Supply Zone (Resistance Area) Range: $112,000 – $114,000 This region is marked as a supply zone, where sellers previously entered aggressively, pushing prices lower. Every attempt to rise toward this zone has faced strong rejection, implying heavy selling pressure. If price revisits this zone, traders may look for bearish confirmation signals for potential short setups. ▪Support and Demand Zones ▫Minor Support / 1st Target Area: Around $108,000 – $106,000 This area has acted as interim support, where buyers could attempt to slow down the decline. A bounce from here may lead to a short-term pullback before the next move. ▪ Demand Zone / Final Target Area: Around $104,000 – $102,500 This is a strong demand zone, historically associated with increased buying activity. If the price reaches this level, it may attract buyers and trigger a potential reversal or accumulation phase. ▪Price Outlook: The overall setup suggests a bearish bias in the short term. Price may retest the broken channel support (now resistance) before continuing lower toward the demand zone. If BTC holds above the $114,000 resistance, the bearish view would be invalidated, opening the door for a recovery toward previous highs. ▪Summary: Bias: Bearish below $114,000 Possible Pullback: Toward $112,000 (supply zone) Downside Targets: $108,000, $104,000, $102,500 Invalidation: Break and close above $114,000 Support Me For More Insightful Analysis.
SOAM_PRO_TRADER
آمادهسازی ریپل (XRP) برای جهش بزرگ: شکست مقاومت کلیدی و رسیدن به هدف ۳ دلاری!
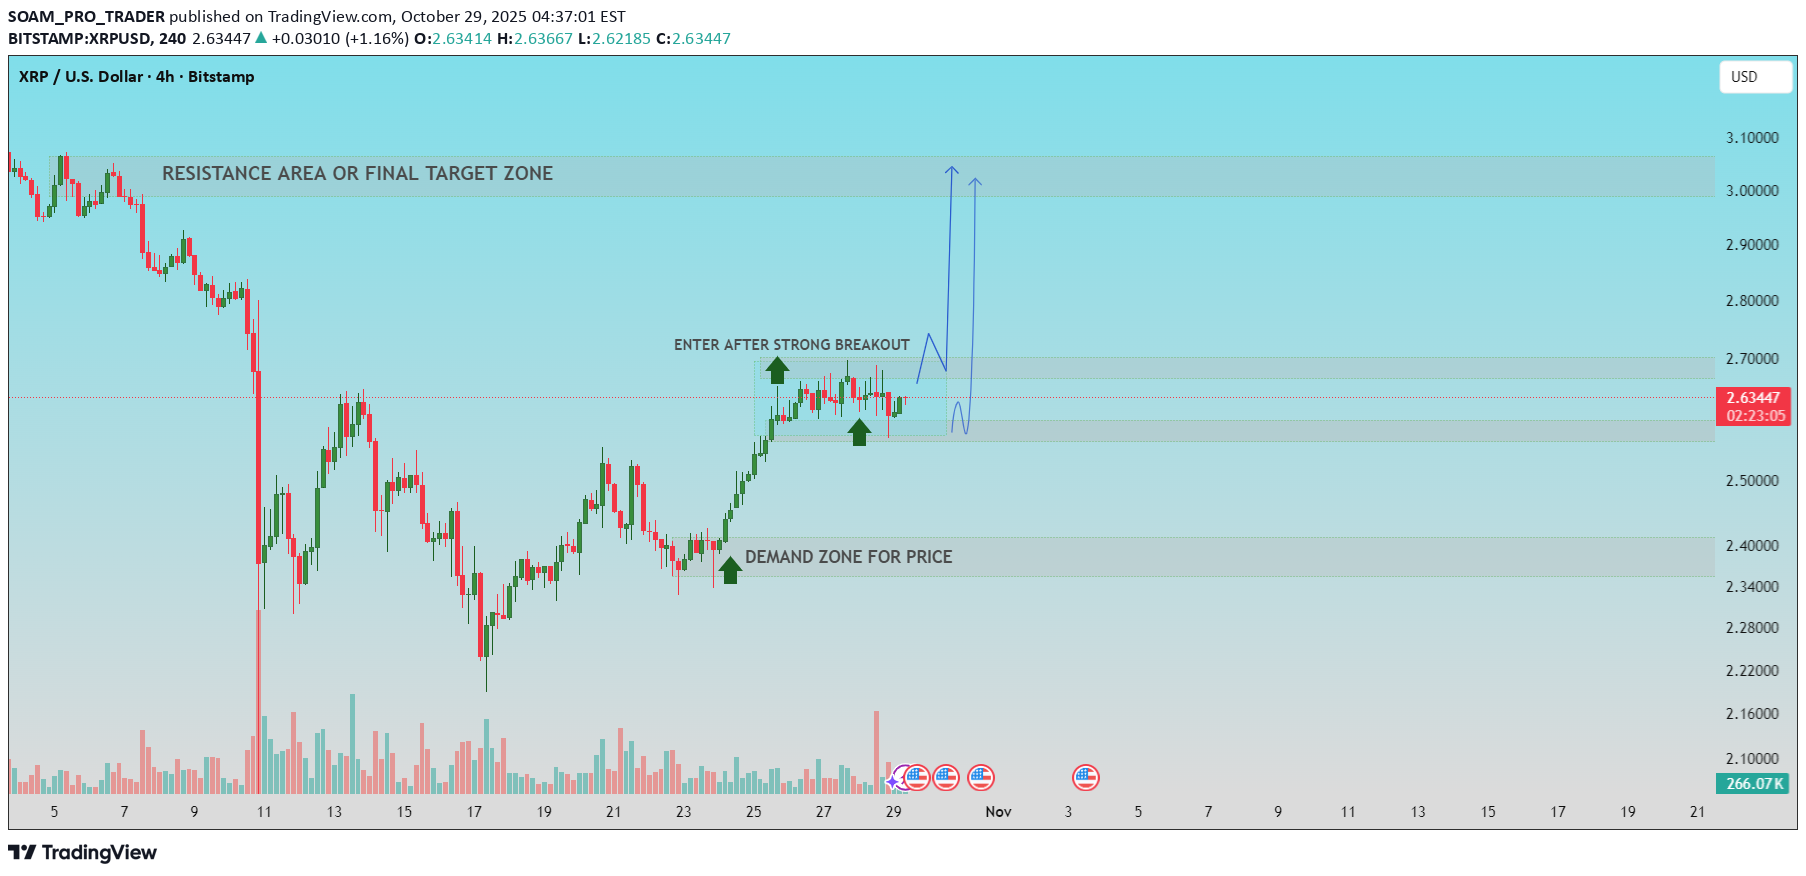
🔹XRP/USD – Breakout Setup and Target Projection ▪Current Market Structure: XRP is consolidating near the $2.62 zone, showing strength after a series of higher lows. The market is currently building momentum within a narrow range, suggesting accumulation before the next directional move. ▪Demand Zone: A strong demand zone is identified between $2.35 – $2.45, where buyers have consistently entered the market. This zone provides a solid support base for potential bullish continuation. ▪Breakout Confirmation: A strong breakout above $2.65 – $2.70 is the key entry trigger. Once price closes firmly above this resistance, it confirms bullish control and opens room for an upward continuation. ▪Target Zone / Resistance Area The final target zone lies between $3.00 – $3.20, aligning with previous major resistance levels. This area should be monitored for potential profit-taking or reversal signs. ▪Outlook: Bias remains bullish, provided XRP maintains support above the demand zone and achieves a confirmed breakout. Traders can look for long entries after breakout confirmation with a stop below the demand zone. If this helpful for you, press the like button.from demand zone now
SOAM_PRO_TRADER
تحلیل تکنیکال بیت کوین: حمایت قوی تثبیت شد! اهداف صعودی جدید تا سقف ۱۱۶ هزار دلار
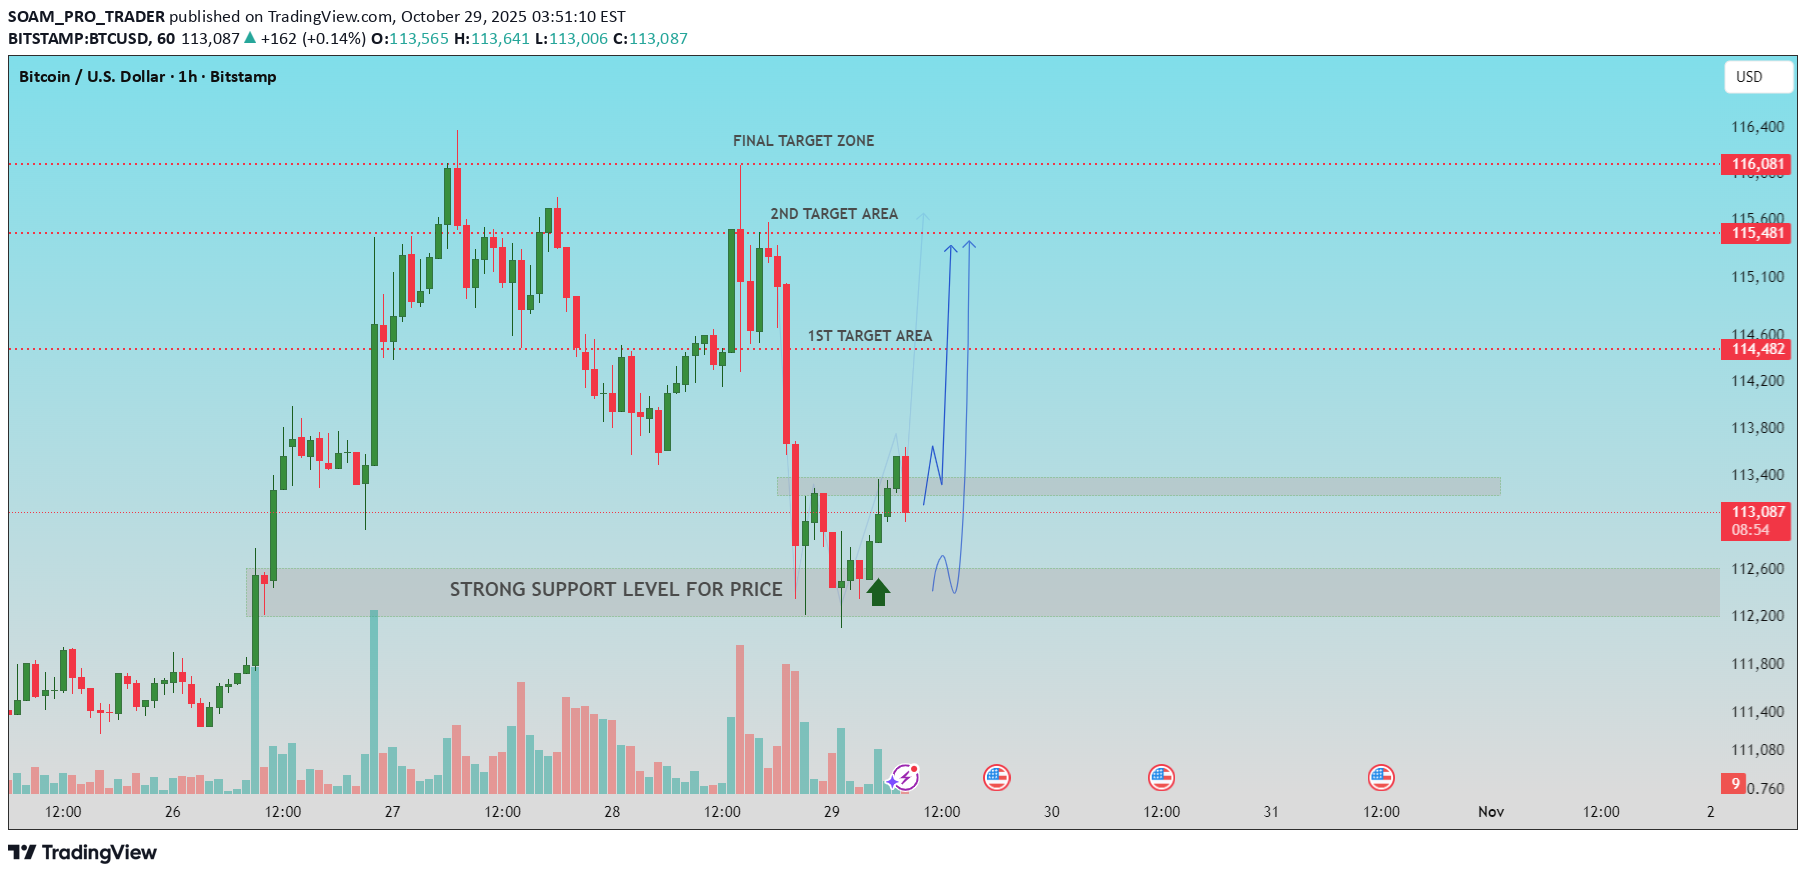
🔹BTC/USD – Bullish Reversal from Key Support Bitcoin is showing a strong reversal setup on the 1H chart after retesting the $112,800 support zone, which has acted as a solid demand area. Buyers stepped in with strength, forming a bullish reaction candle supported by increased volume showing a potential short-term recovery move. 📊 Key Levels to Watch: Strong Support: $112,800 – $112,600 1st Target: $114,482 2nd Target: $115,481 Final Target Zone: $116,153 – $116,400 💡 Technical Outlook: Price is currently trading near $113,437, building momentum above support. A sustained break and close above $114,000 could confirm bullish continuation toward the 1st and 2nd target areas. As long as the price remains above $112,800, the bias stays bullish in the short term. A close below this level would invalidate the bullish setup and open the door to lower prices. 🎯 Trade Idea (Example) Entry: $113,400 – $113,600 Stop-Loss: Below $112,700 Take-Profits: TP1: $114,482 TP2: $115,481 TP3: $116,153 Risk/Reward: 1:2.5 – 1:3 ▪Summary: BTC is attempting a bullish reversal after testing strong support. If momentum continues, we could see a push toward the $115K–$116K levels. Watch for confirmation above $114K before entering aggressively. If this helpful for you, press the like button.
SOAM_PRO_TRADER
طلا آماده جهش به ۴۴۰۰ دلار شد؟ تحلیل کلیدی شکست قیمت!
🔹 Technical Analysis Of XAUUSD ▪Support Level Holding Firm Price action on gold has recently bounced off a strong support level (4,100), confirming demand in this zone. Multiple rejections (green arrows) and a sharp recovery suggest bullish momentum is building. 🚀 Breakout Confirmation: A strong breakout above the support level has triggered a potential long-entry setup. The current price (4,140.67) is consolidating slightly above the breakout zone, indicating buyer strength. 🎯 Target Zones 1st Target Area: 4,190 - Initial resistance zone, potential for short-term profit-taking. 2nd Target / Supply Zone: 4,257-4,270 Watch for selling pressure or reversal signals here. Final Target Zone / ATH Area: 4,344-4,415 Previous all-time high region, acting as a long-term target for bullish continuation. 📊 Volume Analysis Volume surged during the recent drop and reversal, suggesting strong accumulation near support. Sustained volume on upward moves will confirm bullish strength. ✅ Trade Plan Summary Entry: Above 4,110–4,120 after breakout Targets: 4,190 → 4,270 → 4,400+ Invalidation: Drop below support zone (4,100) with high volume Support Me For More Insightful Analysis.after a breakout of 4117 level, price just came for retest the level and we activated first layer from 4110, the breakout and retest completed of this level.500 pips+ achieved from 4110-4160,price is struggling to breakout 4153,
SOAM_PRO_TRADER
سقوط طلا تایید شد؟ کلید حمایت حیاتی که باید زیر نظر بگیرید!
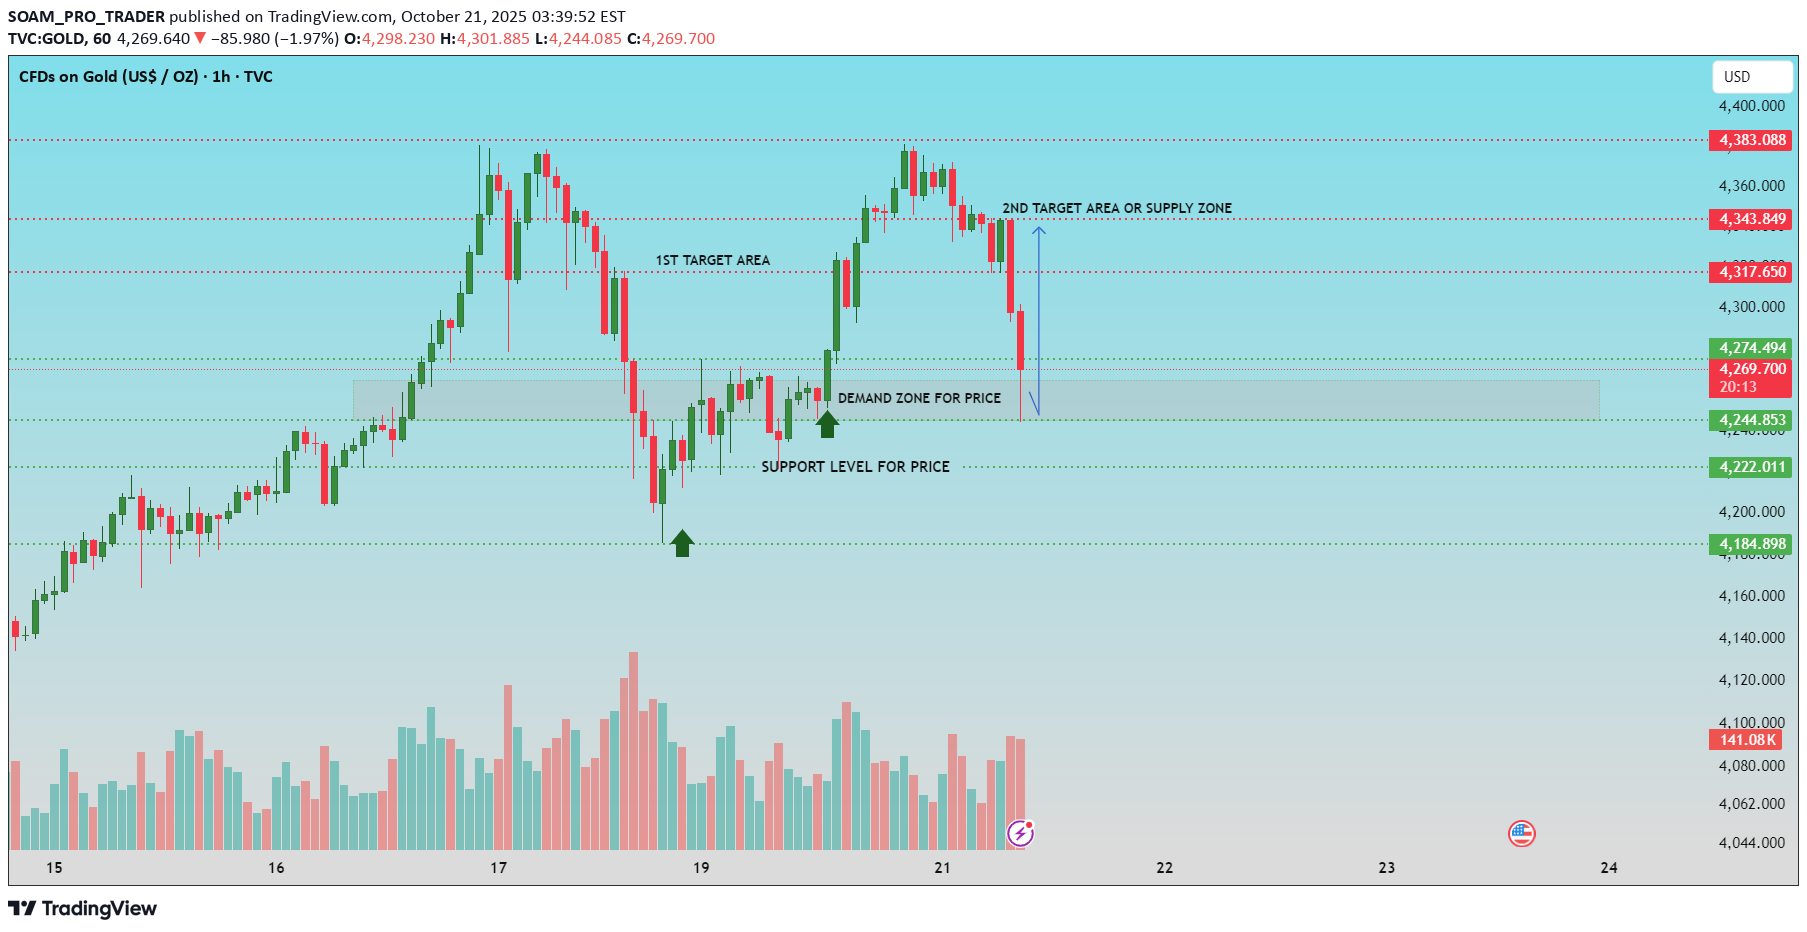
📊 Technical Analysis – Gold (XAU/USD) 🔻 Price Rejection from Supply Zone Gold recently tested the second target area / supply zone around $4,343–$4,383, which acted as strong resistance. Price was rejected from this zone, indicating selling pressure and a potential short-term top. 📉 Breakdown Toward Demand Zone Following the rejection, price has dropped sharply and is approaching the demand zone around $4,244–$4,274. This zone also aligns closely with a previously respected support level. 🔁 Key Support Holding So Far The support level at $4,244 has historically acted as a strong base for bullish reversals, as seen on October 19 and 21. If this level holds again, it may offer a potential long opportunity with the first target at $4,274 and a second target at $4,317–$4,343. 📌 Trading Outlook ▫Bullish Scenario: Watch for bullish reversal signals in the demand zone for a potential bounce. ▫Bearish Scenario: A clear break below $4,244 could lead to further downside toward $4,222 and $4,184 levels. 🔍 Summary Gold is currently in a retracement phase, reacting from supply. Demand zone test is crucial-price action here will likely dictate the next significant move. If this helpful for you, press the like button.1st layer activated from 4250200 pips+ achieved, 4270last layer activated 4192
SOAM_PRO_TRADER
سطح کلیدی سولانا (SOL) کجاست؟ منتظر این واکنش قیمتی باشید!

🔹SOL/USDT (4H) – Technical Analysis ▪ Key Price Zones ▫ Demand Zone: 182.5 – 176.5 SOL is currently trading inside a well-defined demand zone. Price has reacted positively to this level twice before (green arrows), suggesting buyer interest and possible accumulation. ▫1st Target Area: 198.60 This level has acted as a strong supply/resistance zone in the past and represents the first upside target if the price successfully bounces from the demand zone. ▫ 2nd Target Zone / Resistance Area: 211.19 A move beyond the first target could bring SOL into this resistance zone, which previously capped bullish momentum. ▫Final Target Zone: 229.93 This is the upper resistance area and final bullish target based on historical highs and market structure. ▪ Market Structure & Setup Price recently dropped sharply into the demand zone but has begun to consolidate. Volume spikes during the decline followed by stabilization indicate a potential short-term bottoming pattern. The projected move (in blue) suggests a rebound from this demand zone with potential resistance at each target level. ▪Outlook: ▫ Bullish Scenario: If demand holds and price confirms a reversal (e.g., bullish engulfing, breakout candle), expect a move toward 198.60, followed by 211.19 and possibly 229.93. ▫ Bearish Scenario: A sustained break below 176.5 may invalidate the bullish thesis and open downside toward the next support (not shown, likely around 172.55 or lower). ▪Conclusion: SOL/USDT is at a critical support level. A bullish reaction here could set the stage for a multi-leg recovery. However, confirmation is key before entering long positions. Support Me For More Insightful Analysis.from last support area160 pips+ securedprice can give once again respect to the same demand zone
SOAM_PRO_TRADER
بیت کوین در آستانه جهش بزرگ: حمایت حیاتی حفظ شد، هدفها کدامند؟

🔹Bitcoin (BTC/USD) 4H Technical Analysis ▪ Key Support Zone Holding Strong Price has rebounded from the strong support zone near $108,000 - $107,000, which has previously acted as a launch point for bullish moves. A bullish rejection (marked by the green arrow) suggests potential for upward continuation. ▪ Re-Entry Strategy After Breakout Traders are advised to re-enter long positions upon a strong breakout and retest of the marked grey resistance-turned-support zone around $109,000 - $110,500. ▪Target Zones to Monitor 1. 1st Target Area: Around $113,497 Minor resistance; expect consolidation or slight rejection. 2. 2nd Target Area: Around $116,114 Stronger resistance zone; key for bullish continuation. 3. 3rd Target / Supply Zone: $121,887 - $122,156 Major resistance zone; likely profit-taking area for swing trades. ▪ Risk Management Stop-loss likely placed just below $106,975 to limit downside exposure. Risk-to-reward ratio appears favourable given the depth of potential upward targets. Summary: BTC/USD is showing early signs of bullish recovery from a key support level. Confirmation of breakout above the immediate zone may trigger a multi-leg rally toward $122K, if volume supports the move. Support Me For More Insightful Analysis.
SOAM_PRO_TRADER
حمایت قوی بیت کوین: آیا BTC آماده جهش صعودی بزرگ به سمت ۱۲۵ هزار دلار است؟

🔹 Bitcoin (BTC/USD) - 4H Technical Analysis ▪ Market Overview Bitcoin is currently trading near a strong support zone between 109,000 – 111,000 USD, after a sharp correction from recent highs. This zone has previously acted as a demand area, where buyers stepped in to push prices higher, suggesting the potential for another bullish move if the level holds. ▪ Key Levels to Watch ▫ Strong Support Level (109,000 - 111,000 USD): This area has provided a solid base for previous upward moves. A bullish reaction from here may indicate renewed buying pressure. ▫ Resistance Area / 1st Target (115,900 USD): The first major resistance to monitor. A breakout above this zone could confirm short-term bullish momentum. ▫ Supply Zone / 2nd Target (121,700 USD): A key area where sellers are likely to appear. Price consolidation or rejection may occur here before any further rally. ▫Final Target Area (125,600 USD): If bullish strength continues, this could act as the final profit-taking zone, completing a full recovery from the previous drop. ▪Technical Outlook: The price action shows signs of a potential double-bottom structure forming near the support area, hinting at a bullish reversal. As long as the price remains above 109,000 USD, the short-term bias stays bullish, targeting higher resistance zones. However, a break below 108,900 USD would invalidate this bullish setup and could trigger another leg downward. ▪Summary: Bitcoin is showing early signs of strength from a well-defined support area. If buying momentum sustains, the pair may advance toward 115,900, 121,700, and ultimately 125,600 USD. Traders should monitor the reaction at the support zone closely for confirmation of trend reversal. If this helpful for you, press the like button.From support level 110,500
SOAM_PRO_TRADER
تحلیل طلا (XAU/USD): مسیر صعودی قوی تا ۴۱۵۰ دلار – سطوح کلیدی حمایت و مقاومت

🔹GOLD (XAU/USD) - Technical Analysis ▪Trend Structure The price is moving within a well-defined ascending channel, indicating a strong bullish trend. Price action consistently forms higher highs and higher lows, confirming upward momentum. ▪Key Support Levels Multiple demand zones (highlighted by grey rectangles and green arrows) have acted as strong support during pullbacks. The RBS (Resistance Becomes Support) level has held successfully near the $4,040 area, suggesting buyers are defending this zone. ▪Target Zones ▫Psychological Resistance: $4,100 – A key level where price may face initial hesitation. ▫2nd Target Area: Around $4,130 Intermediate resistance zone. ▫Final Target Zone: $4,150 Marked as the ultimate bullish target based on current momentum. ▪Projection The chart suggests a bullish continuation with a projected move towards $4,150, contingent on maintaining support near $4,040. Potential short-term consolidation before breakout as drawn by the projected price path. ▪Conclusion Gold remains in a strong uptrend. As long as price sustains above the key support zones, the bullish scenario targeting $4,150 remains valid. Support Me For More Insightful Analysis.1st layer activated near 4070, minor support area1st target reached, 4100$2nd target achieved, 4130, 600 pips+4150, achieved 800 pips+
SOAM_PRO_TRADER
آیا بیت کوین به کف رسیده؟ هدف جدید ۱۲۳ هزار دلاری کجاست؟

🔹 BTC/USD Technical Analysis ▪ Current Price Overview ▫Current Price: $111,865 ▫Bitcoin is currently consolidating just above a minor support area after a steep drop from the All-Time High (ATH) of $126K. The recent bounce suggests buyers are stepping in near demand zones, but confirmation of bullish continuation is still needed. 🔹 Key Technical Zones ✅ Demand Zone for Bull Run ($109K–$110.5K) This zone previously acted as a strong launchpad, fueling the move towards $126K. The current price is once again testing this area, indicating potential for another bullish reversal. The large bullish candle from this zone in late September reinforces its importance as a high-liquidity region where institutions or smart money may be active. 🔽 Minor Support Area (Current Region) Price is hovering near this support zone, which coincides with the lower wick of recent candles. A successful retest and hold here could form a higher low, suggesting early signs of a reversal pattern. 🔼 Minor Resistance Area ($113K) Identified as a near-term hurdle for bulls. Traders may look for a break and close above this level, ideally with increased volume, to confirm bullish strength. A breakout here would open the path toward higher targets. 🎯 Key Target Levels 📍 1st Target – $117,137 Previous resistance zone where price reacted during its last upward move. A logical level for partial profit-taking or for traders to reduce risk. 🎯 Final Target / Supply Zone $120K–$123K Strong historical supply zone where sellers previously overwhelmed buyers, leading to the most recent correction. If price reaches this level again, expect high volatility and potential resistance or rejection. Serves as a major take-profit zone for swing traders. 📈 Trendline Analysis Downward Trendline (Mid-September to Late September): Was broken decisively, which initiated the strong bullish leg. Upward Trendline (Late September to October 10): Recently broken to the downside, suggesting temporary bearish pressure. However, price is stabilizing around demand zones, hinting at a possible recovery. 📌 Summary & Outlook The current consolidation near the minor support area and demand zone offers a potential buying opportunity, especially if bullish momentum resumes. ▪Traders should monitor: ▫A clean breakout above $113K with strong volume. ▫ Confirmation of a higher low. If confirmed, BTC could rally towards $117K and possibly extend to the $120K–$123K supply zone. ▫ Conversely, a breakdown below $109K would invalidate this setup and shift the bias to bearish. If this helpful for you, press the like button.400 pips+ achieved,1st target reached, 116k$minor support is last hope for buyers,one more layer activated from minor support area, so hold your trades now
Disclaimer
Any content and materials included in Sahmeto's website and official communication channels are a compilation of personal opinions and analyses and are not binding. They do not constitute any recommendation for buying, selling, entering or exiting the stock market and cryptocurrency market. Also, all news and analyses included in the website and channels are merely republished information from official and unofficial domestic and foreign sources, and it is obvious that users of the said content are responsible for following up and ensuring the authenticity and accuracy of the materials. Therefore, while disclaiming responsibility, it is declared that the responsibility for any decision-making, action, and potential profit and loss in the capital market and cryptocurrency market lies with the trader.