
SFM_Danny
@t_SFM_Danny

What symbols does the trader recommend buying?
Purchase History
پیام های تریدر
Filter
SFM_Danny
آیا سولانا (SOL) در آستانه دو برابر شدن قیمت است؟ تحلیل کف دوقلو و مسیر صعودی به ۱۸۰ دلار!

I am seeing a potential double bottom setup for SOL. We would have to close at around 180USD, beyond which an upside turn is possible. DYOR and let me know your thoughts
SFM_Danny
SOL RSI Reset & Supports
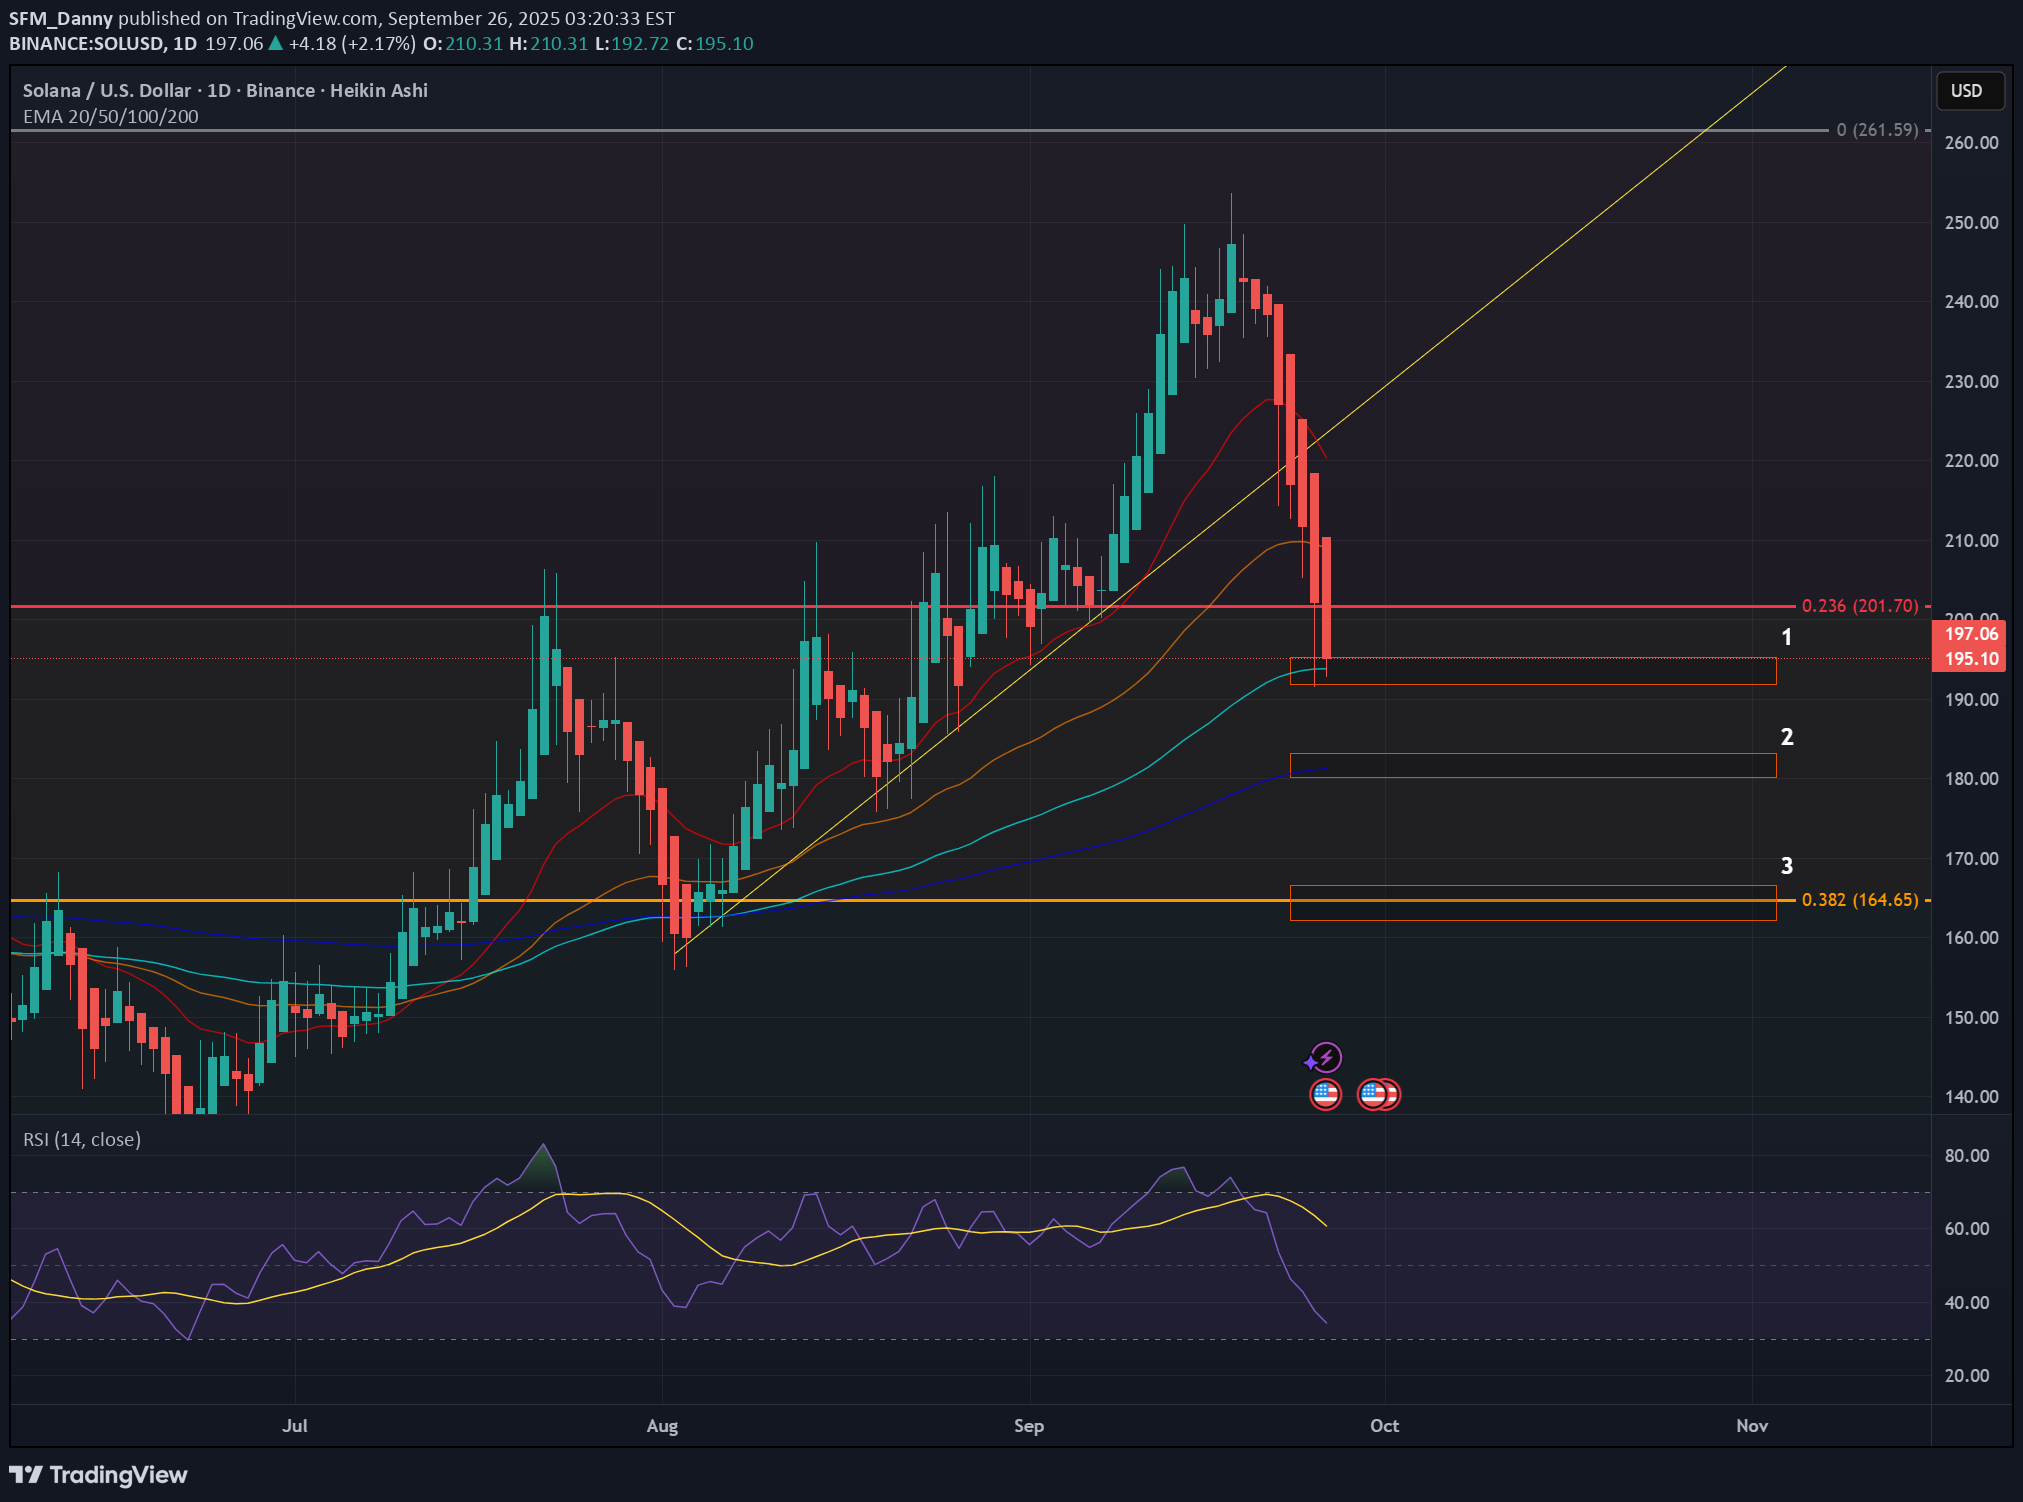
We are experiencing a painful but necessary pullback to reset our RSI and start with a fresh sleeve. I would like to outline the critical supports we have on the daily chart. 1. 100 day MA - 194 USD 2. 200 day MA - 180 USD 3. 0.382 fib level - 164 USD From looking at the RSI I would deem the 194 level as most likely, however breaking that support would lead to a further downtrend. DYOR and let me know your thoughts
SFM_Danny
RUNE break through the downtrend
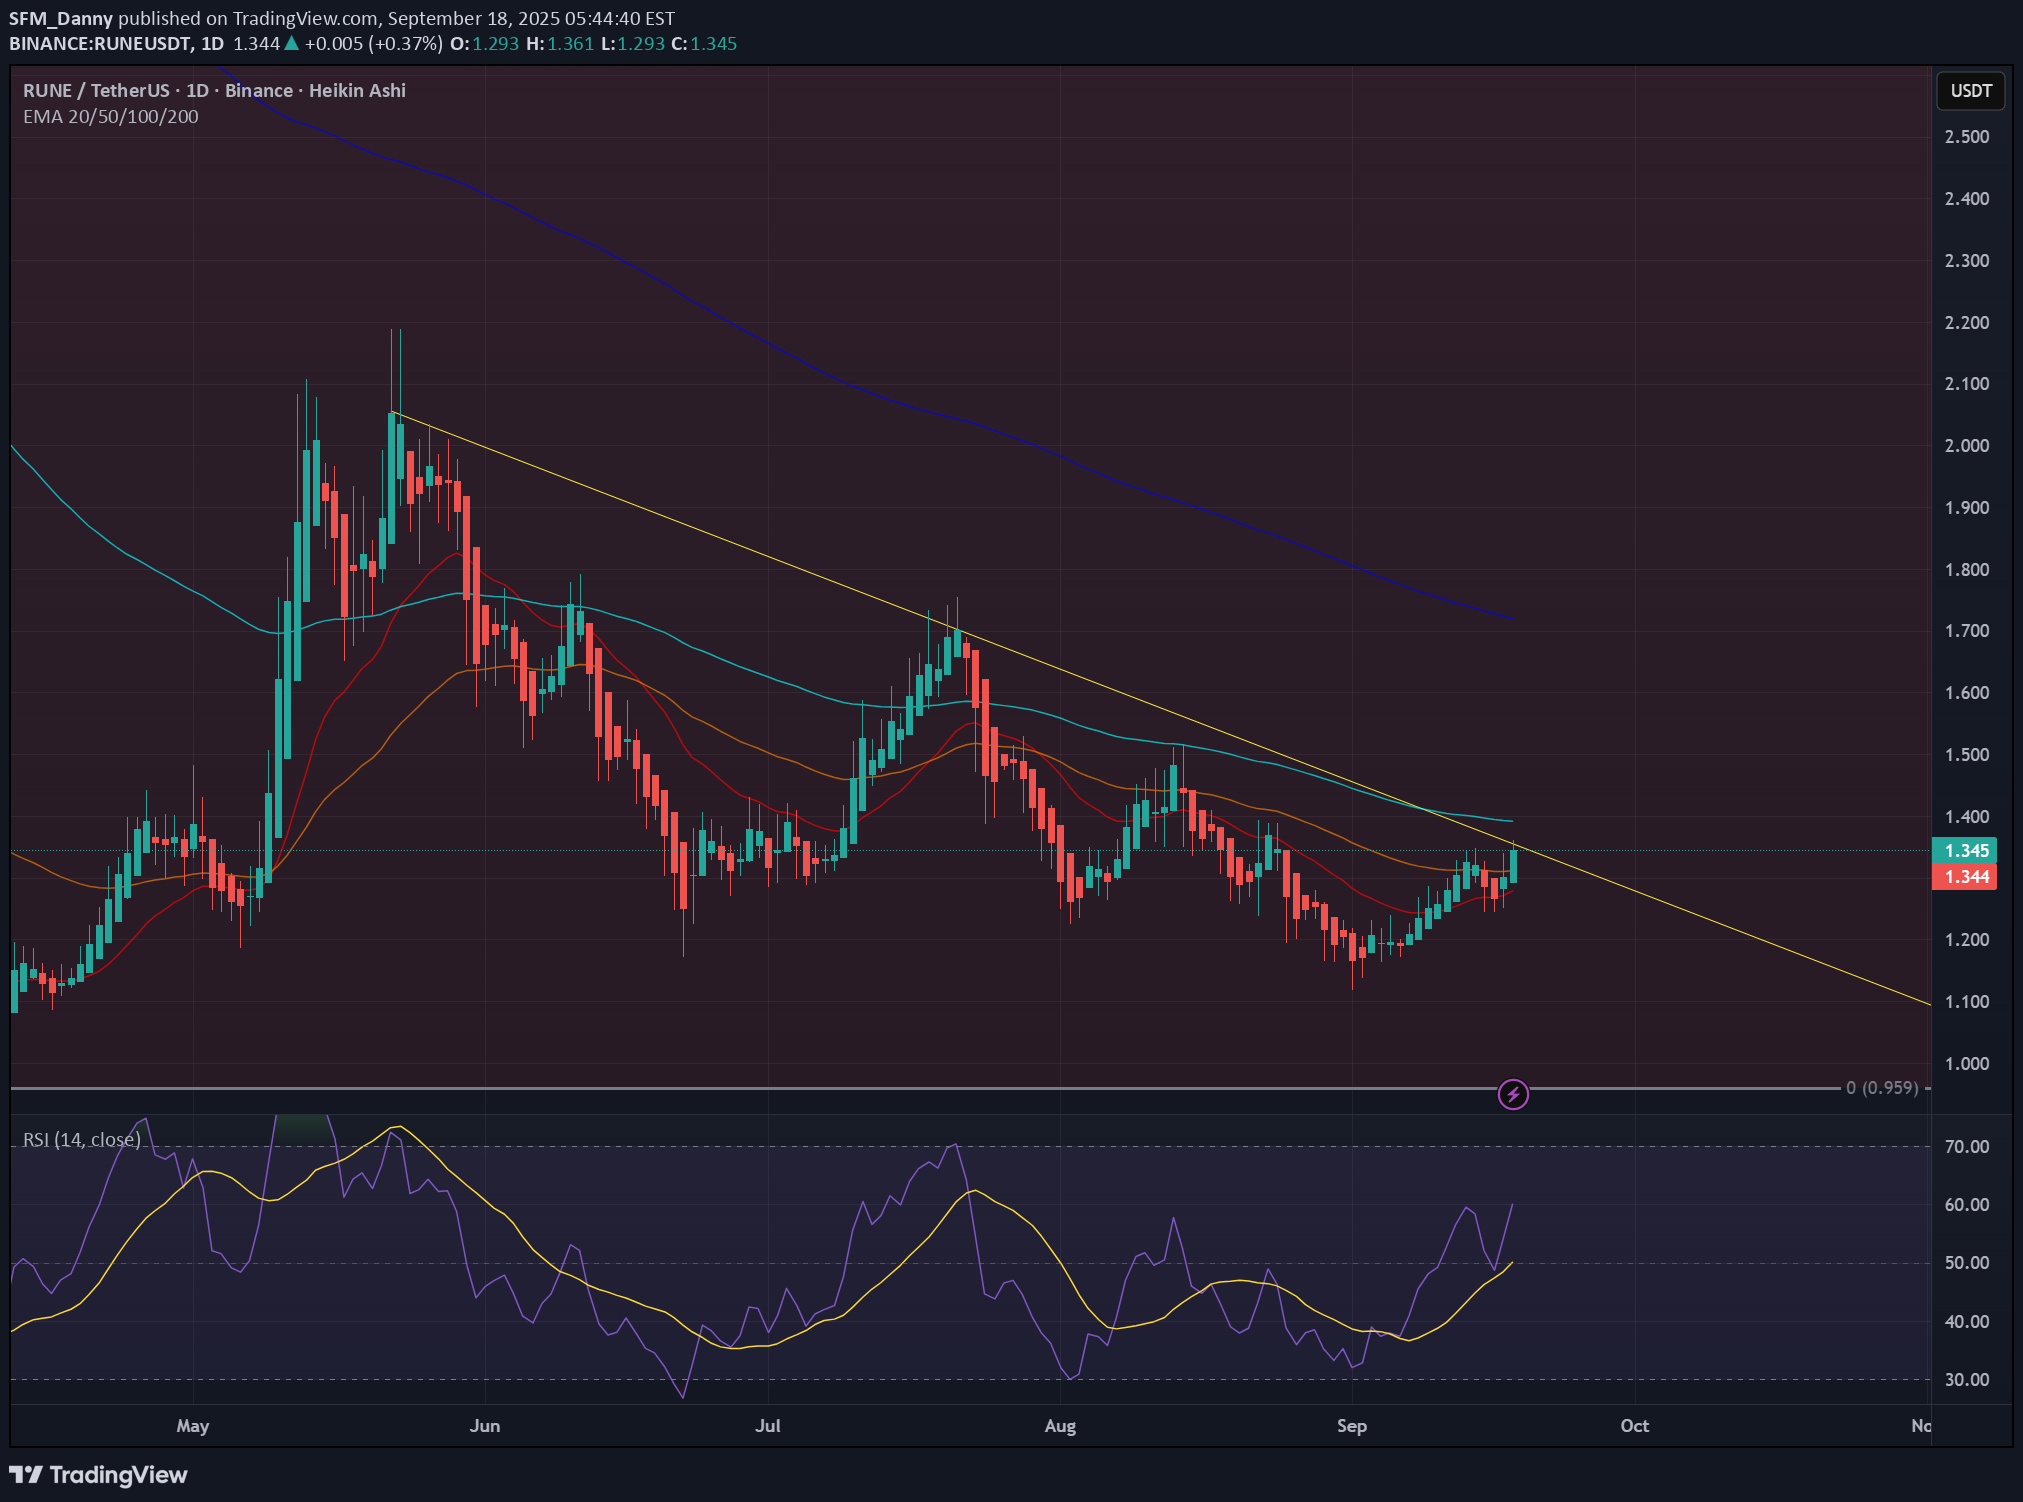
Ideally we would want to close in the 1.375-1.400 area to confirm a breakout from the downtrend. If we fail to do this, we should expect a further downtrend. Next few days are critical, but with the rather bullish sentiment on other assets I remain optimistic.
SFM_Danny
ADA - Daily cup and handle
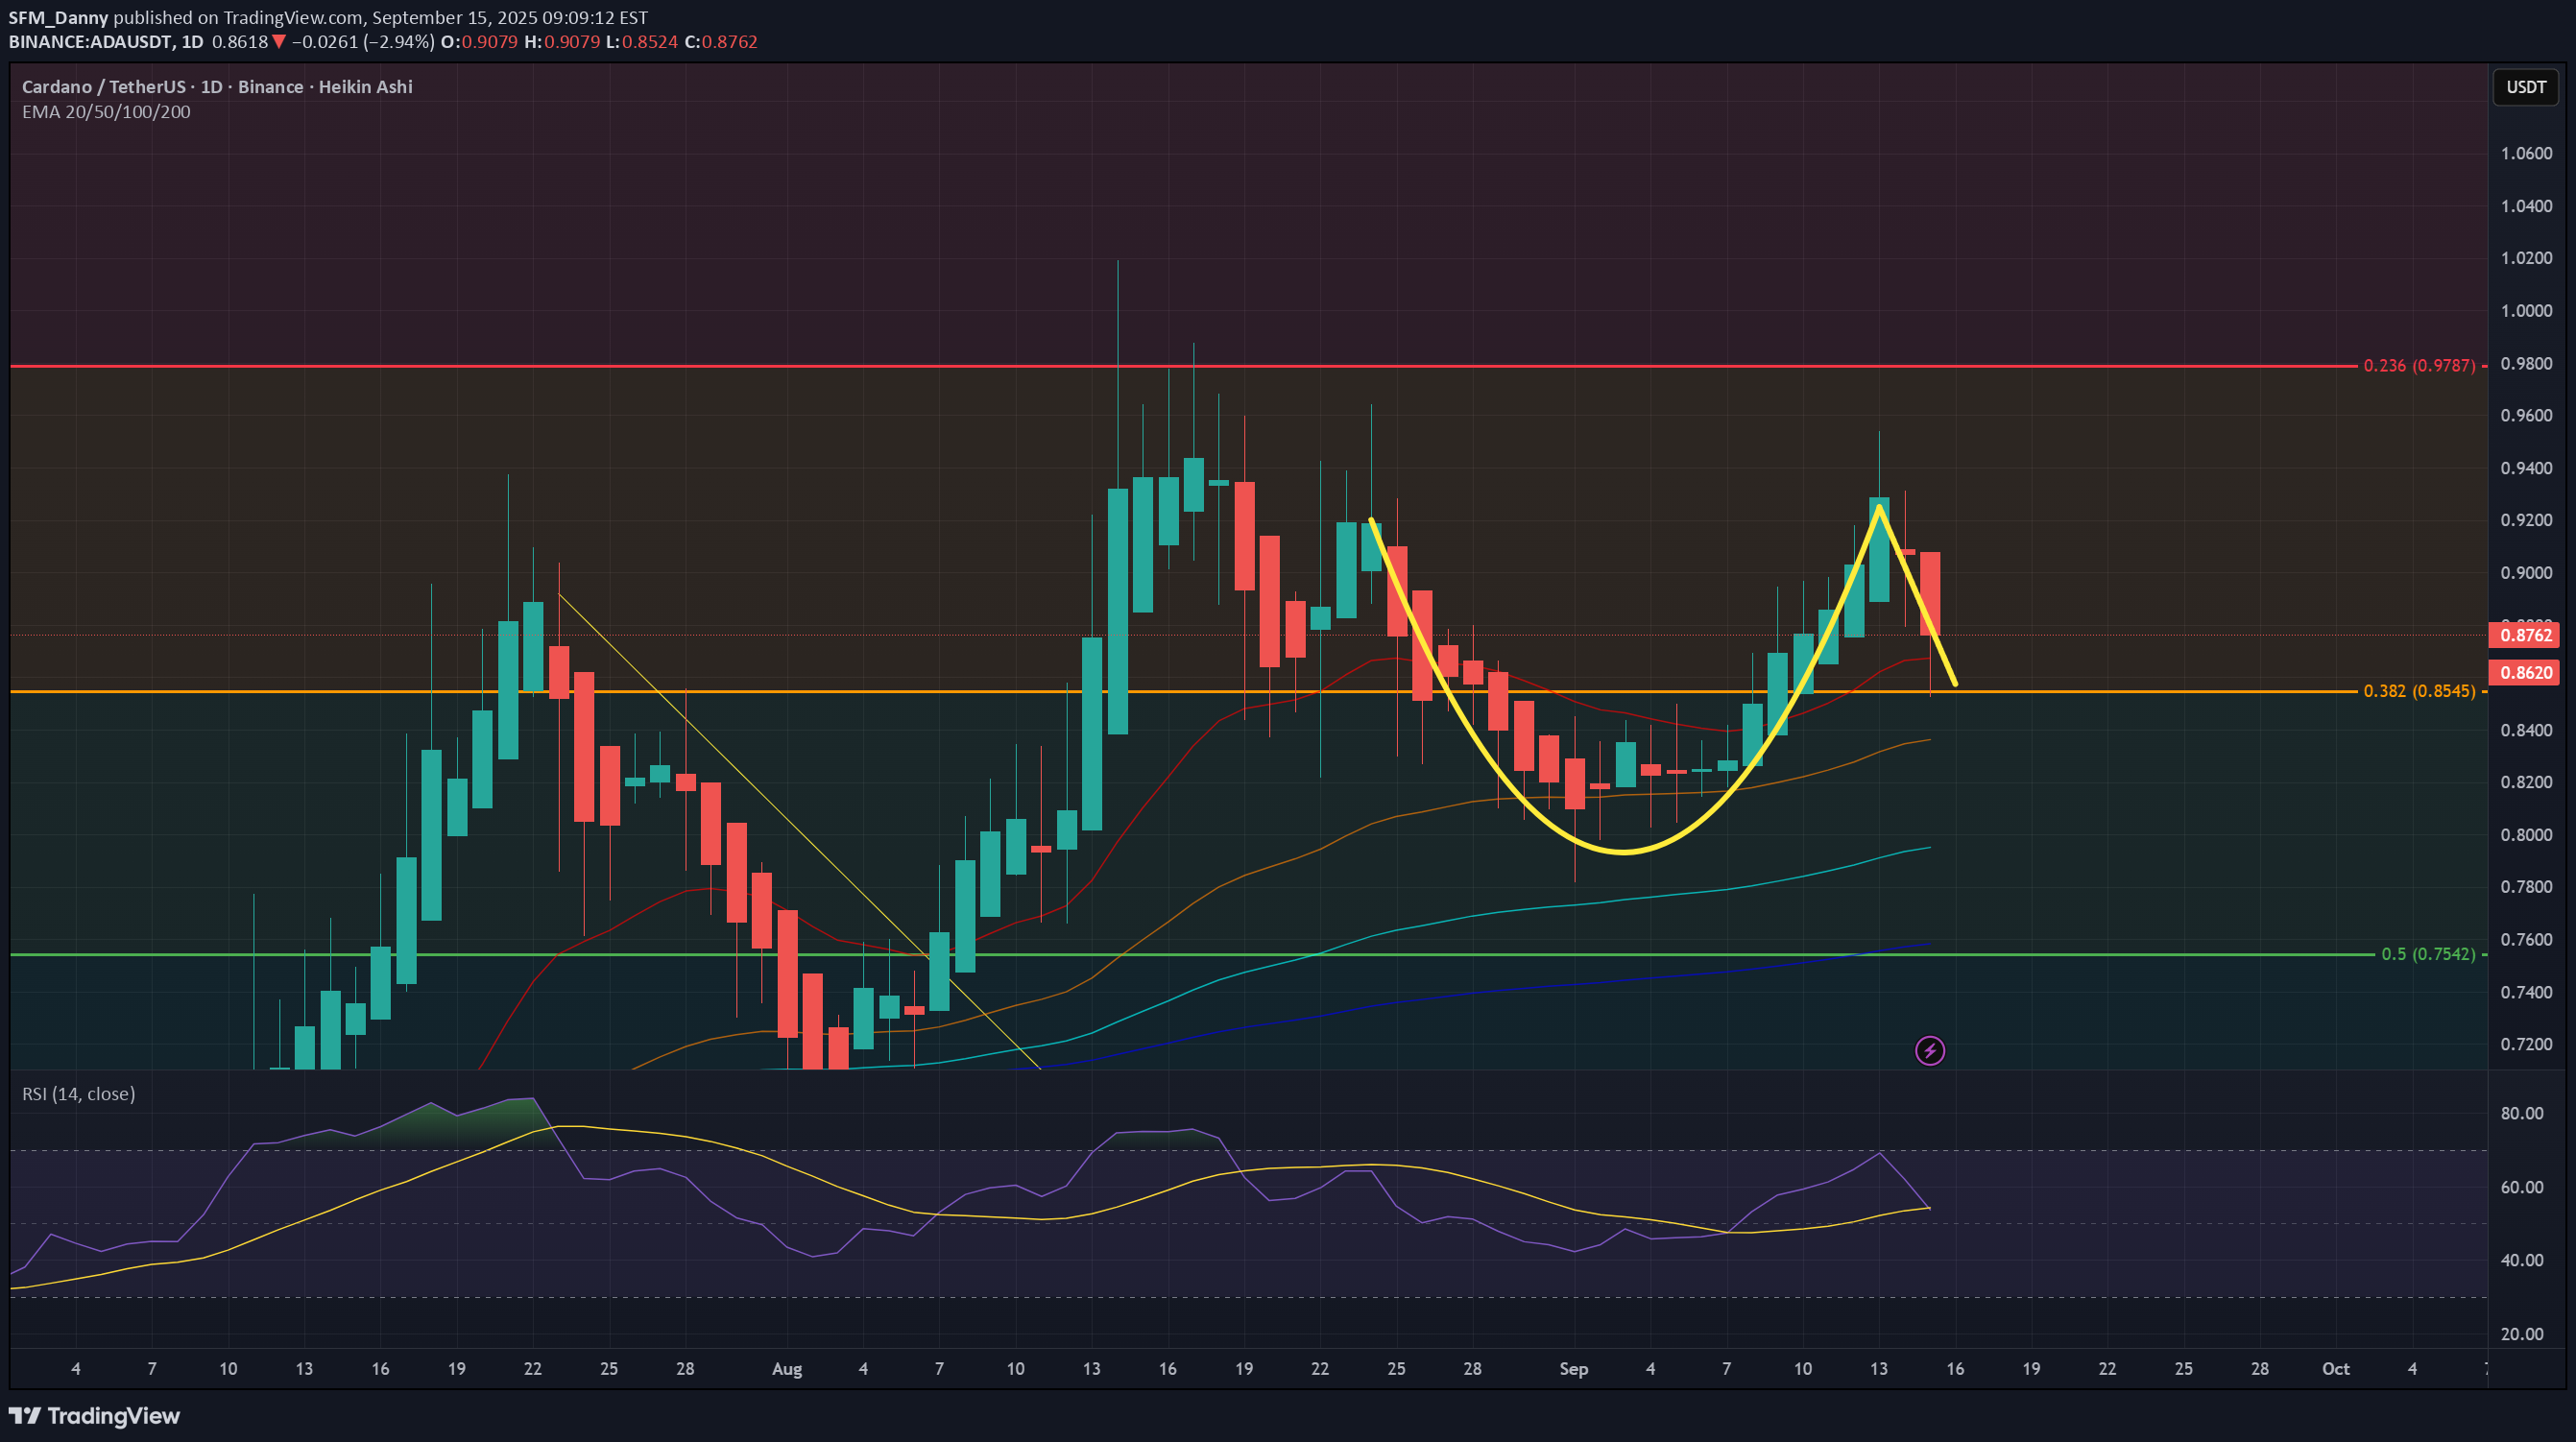
To me it looks like we have formed a cup and handle pattern on the daily chart. I would look for the .85 level as a support before a further leg up. DYOR, let me know what you think.
SFM_Danny
SOL key resistance 201
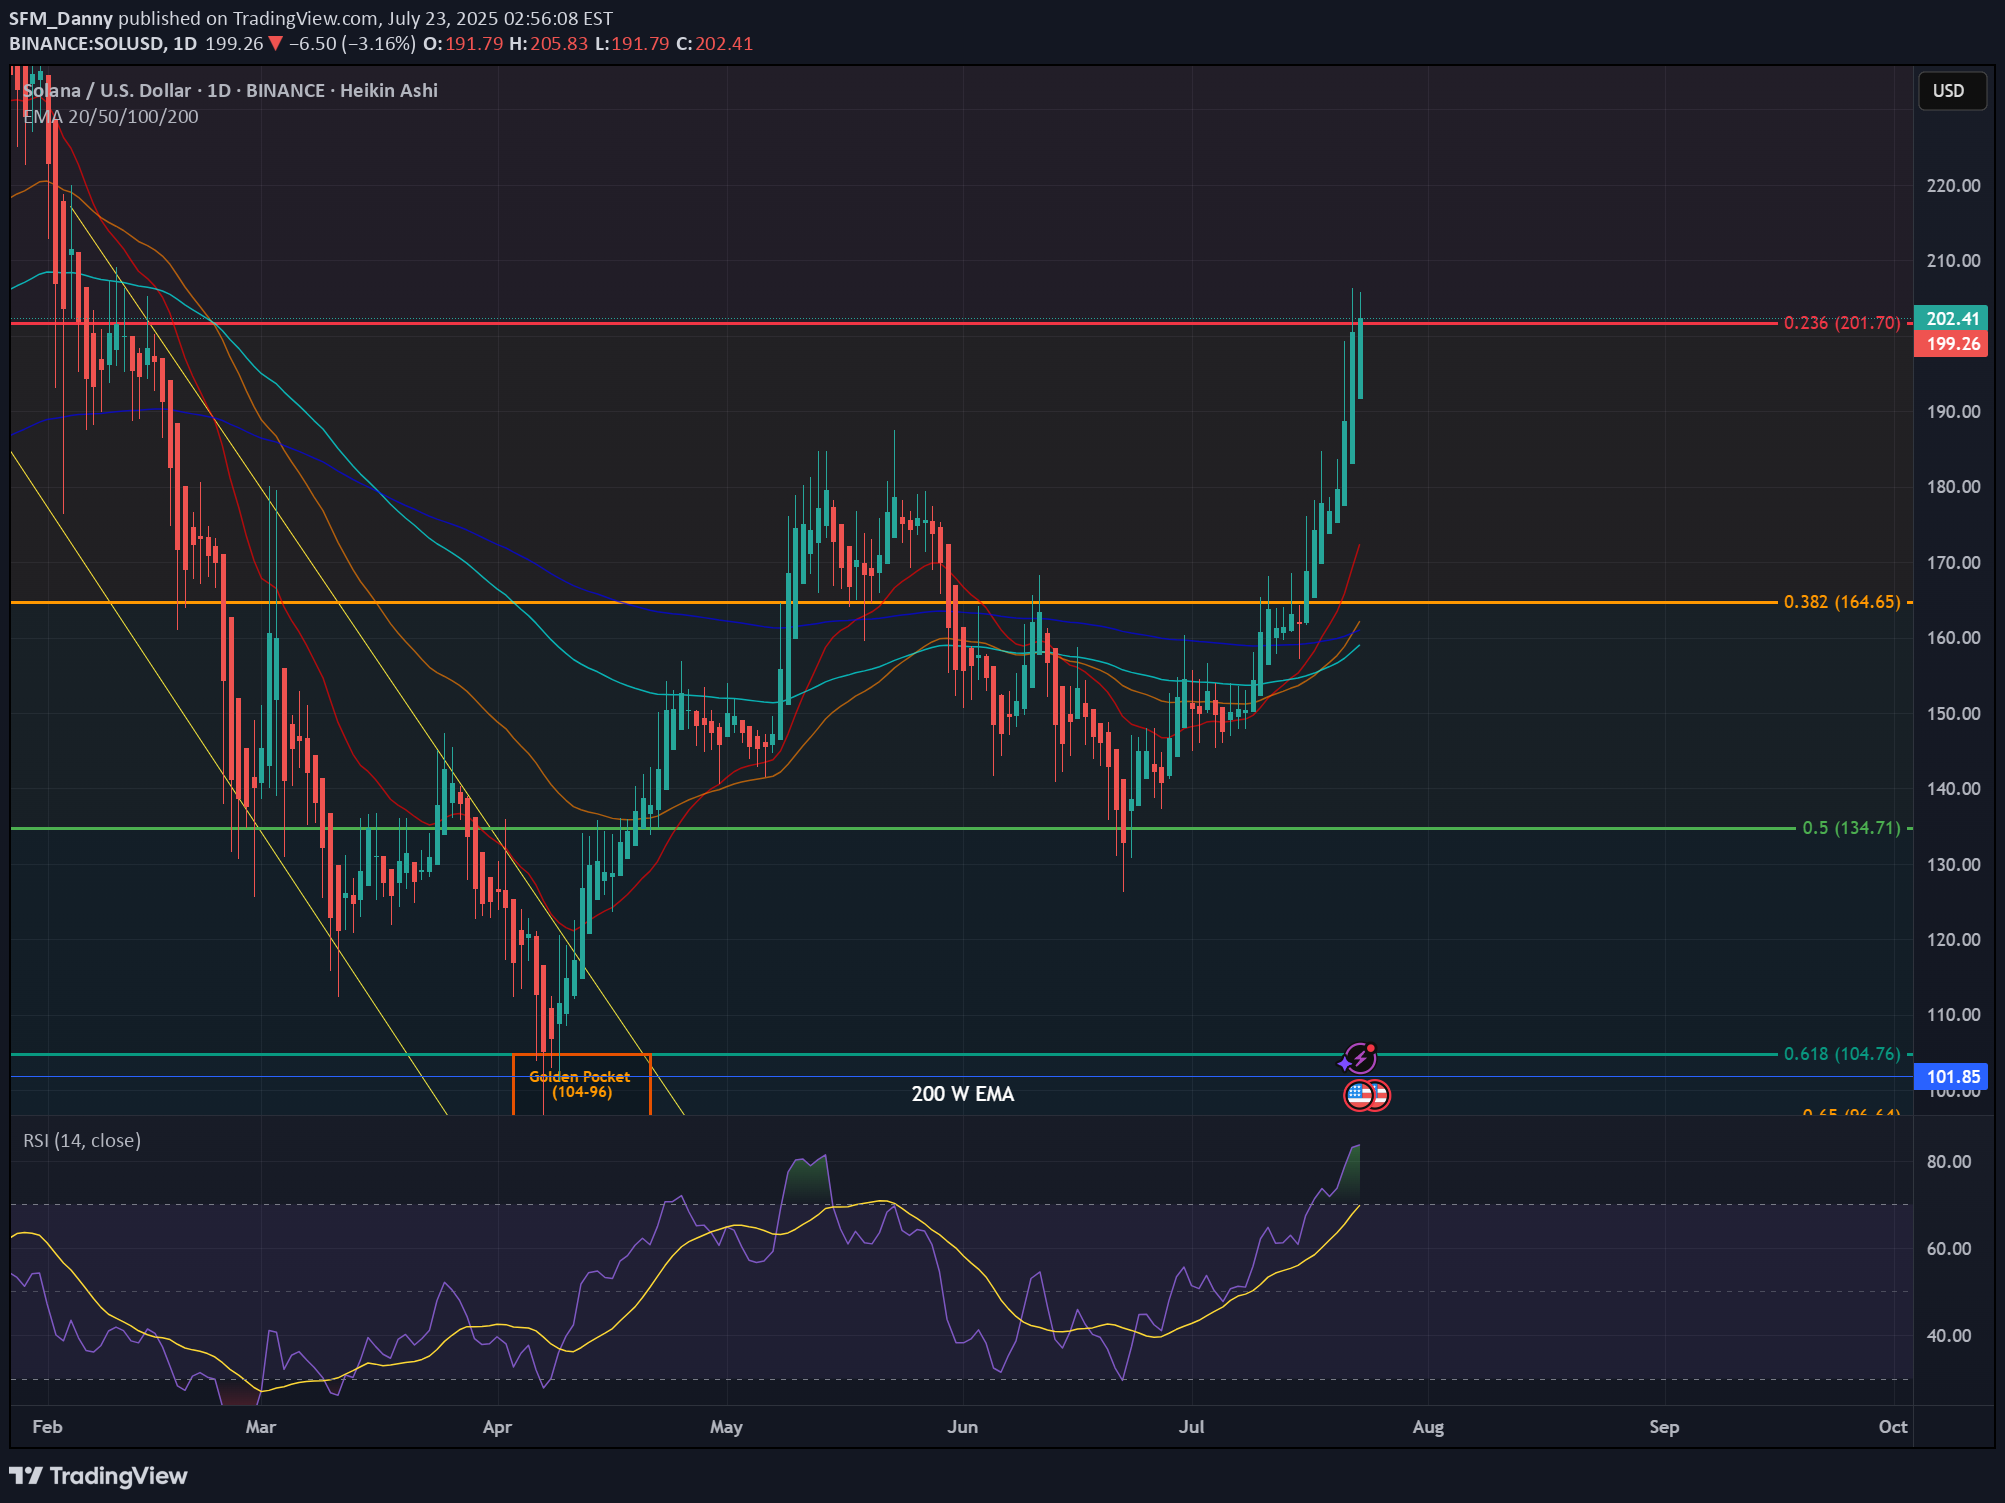
We are reaching a key level in the fib retracement which sits at 201 USD. With the daily RSI being in the overbought area, I would expect a pullback to 180 or 165. DYOR, would love to hear your thoughtCurrently at 180 as projected
SFM_Danny
SOL dead cat bounce?
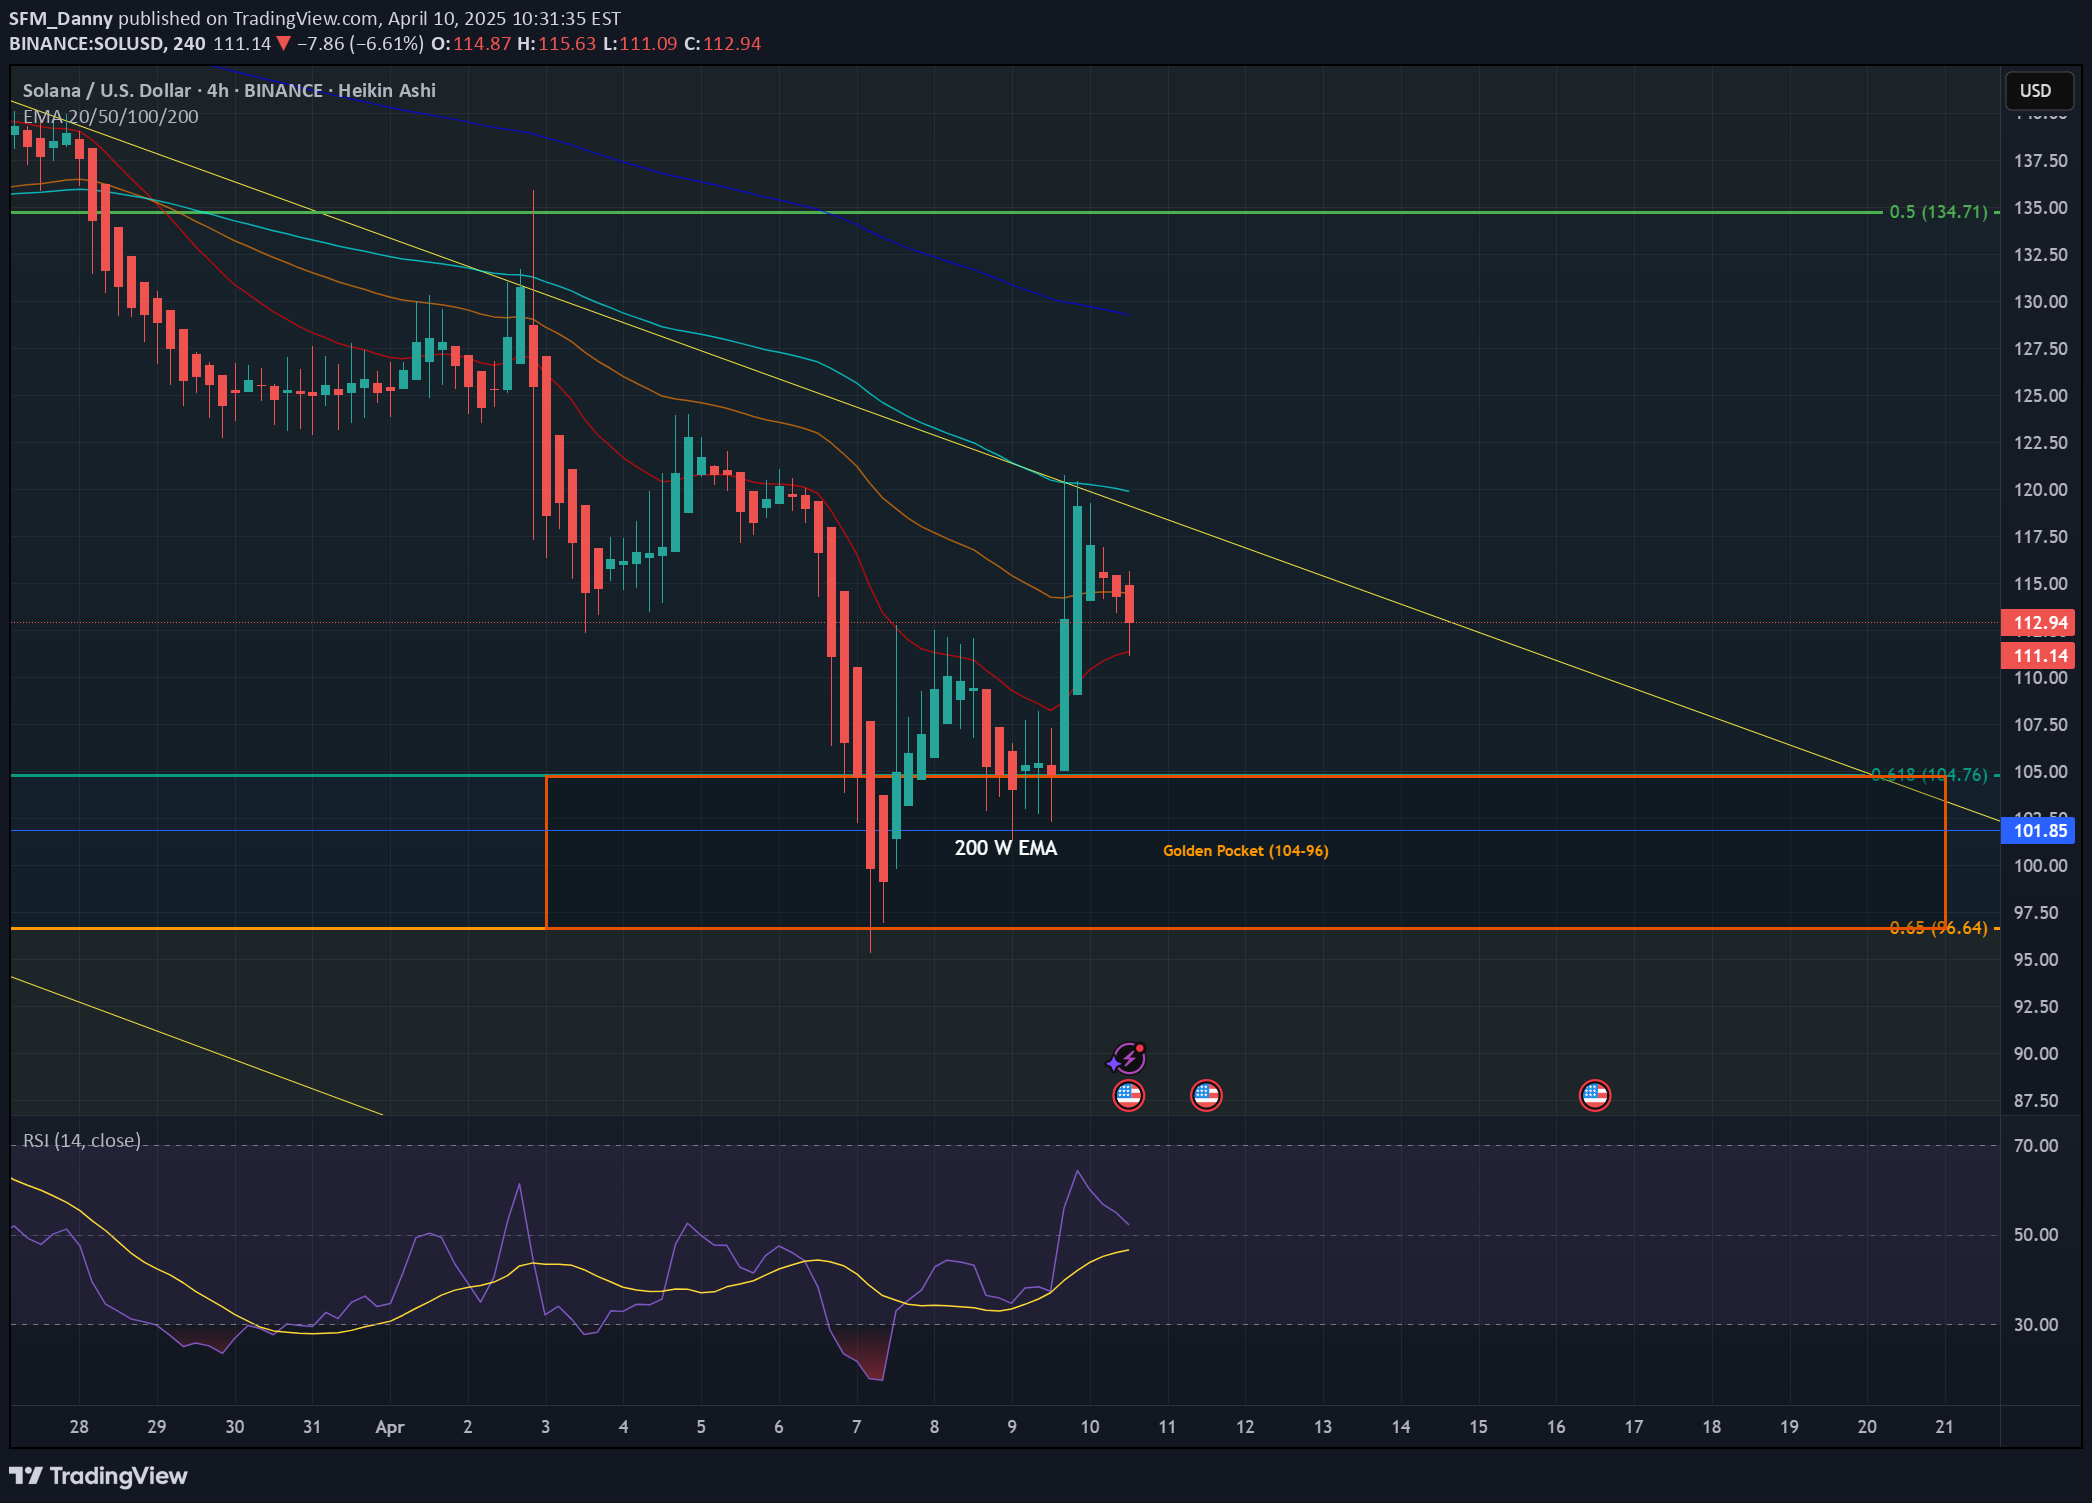
We saw a very successful bounce from the bottom of the golden pocket thanks to the 90-day tariff pause announcement, however we have stayed inside the downtrend pattern which I have highlighted. We could see a slow and steady decline back towards the golden pocket area. The theory here is that if we bounce again, we would be looking at a double bottom which is a bullish signal. Let's see how it goes. Feel free to let me know your thoughts.
SFM_Danny
SOL in the golden pocket area
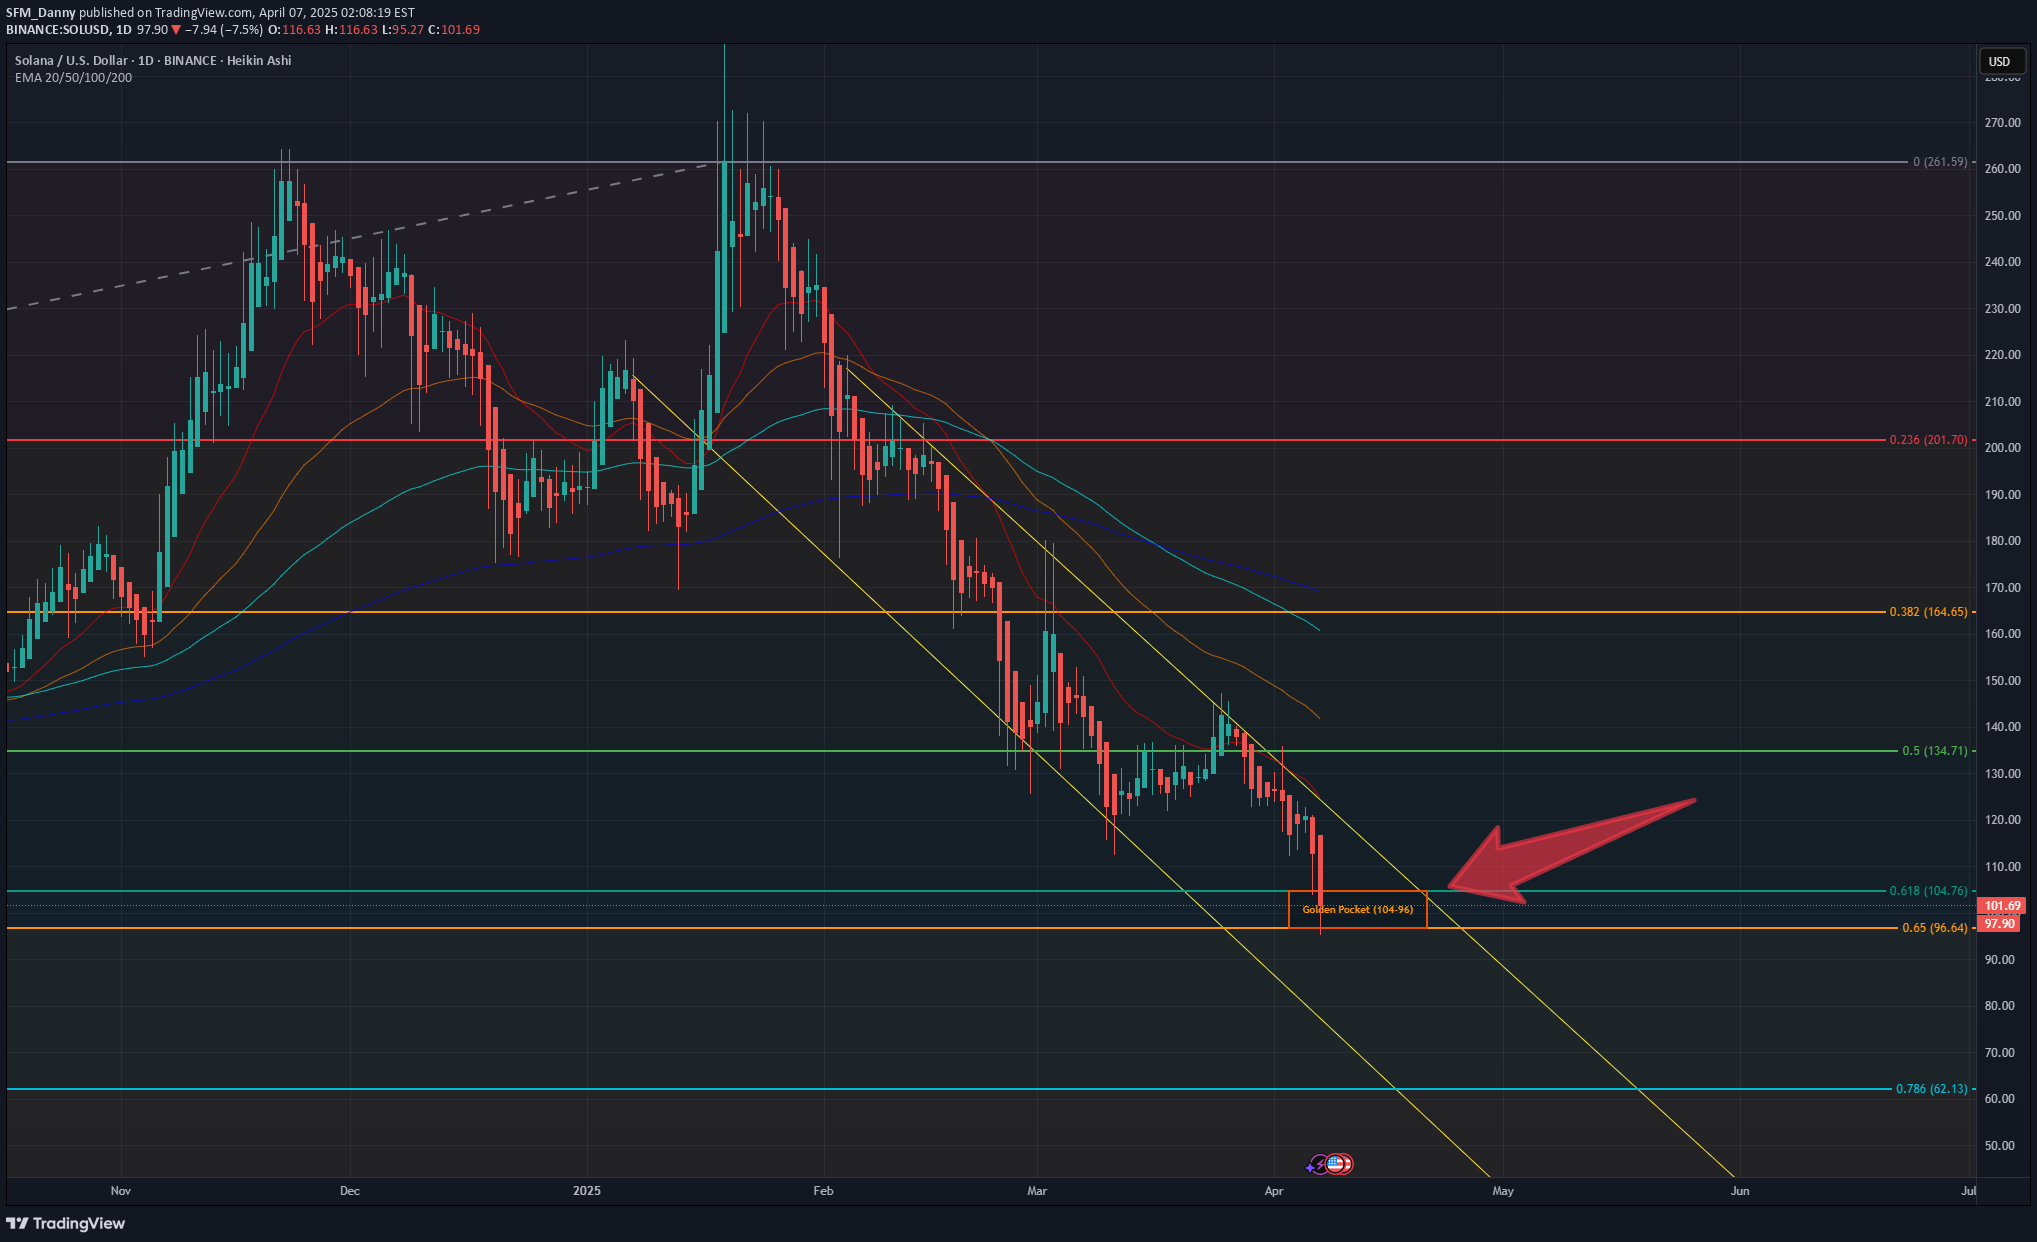
I believe that we have arrived in the golden pocket area (between 0.618 and 0.65 on the fib). This could be the most probable reversal area, however with the market turmoil, not even the lord knows. If we can hold above 96, then a reversal could be in place. DYOR and let me know what you think.
SFM_Danny
Further downward momentum for SOL
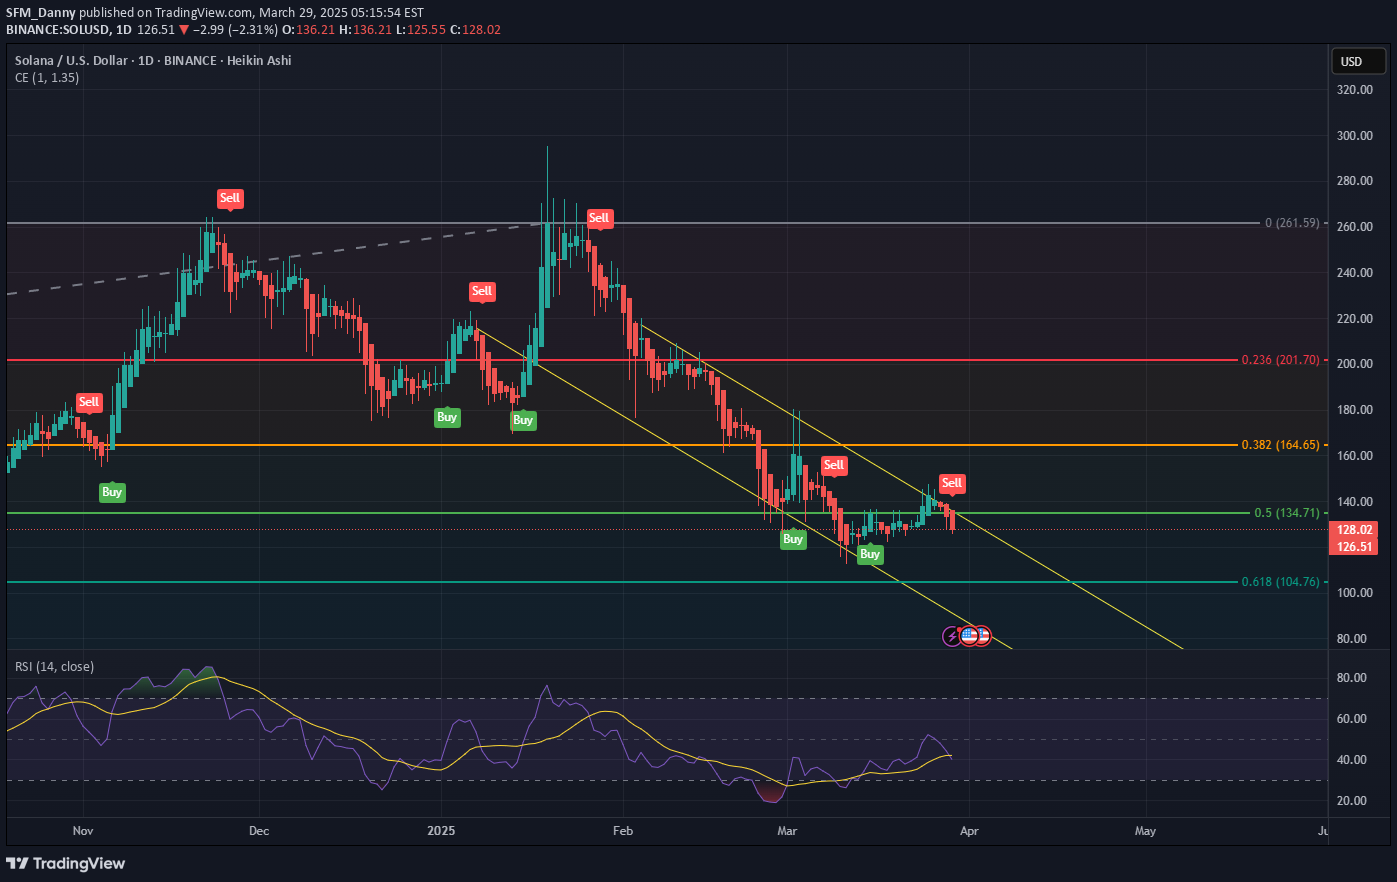
With the failed attempt to breach the bearish resistance, it takes us back to the downward trend tunnel, and with the Sell signal triggering on the daily, I believe we could see a further retracement to around the 107-113 area. The RSI also just crossed itself, which further supports my belief. Let me know what you think! DYOR
SFM_Danny

SFM_Danny
XRP descending triangle pattern

I'm seeing a descending triangle pattern on the 1h chart for XRP. Expecting a drop to around 1.90 area. Lmk your thoughtsBroke to the upside
Disclaimer
Any content and materials included in Sahmeto's website and official communication channels are a compilation of personal opinions and analyses and are not binding. They do not constitute any recommendation for buying, selling, entering or exiting the stock market and cryptocurrency market. Also, all news and analyses included in the website and channels are merely republished information from official and unofficial domestic and foreign sources, and it is obvious that users of the said content are responsible for following up and ensuring the authenticity and accuracy of the materials. Therefore, while disclaiming responsibility, it is declared that the responsibility for any decision-making, action, and potential profit and loss in the capital market and cryptocurrency market lies with the trader.