
SAM_2781
@t_SAM_2781

What symbols does the trader recommend buying?
Purchase History
پیام های تریدر
Filter
فروپاشی بیت کوین از روند صعودی: سه سناریوی محتمل برای آینده (سقوط، تثبیت یا یک صعود فریبنده؟)
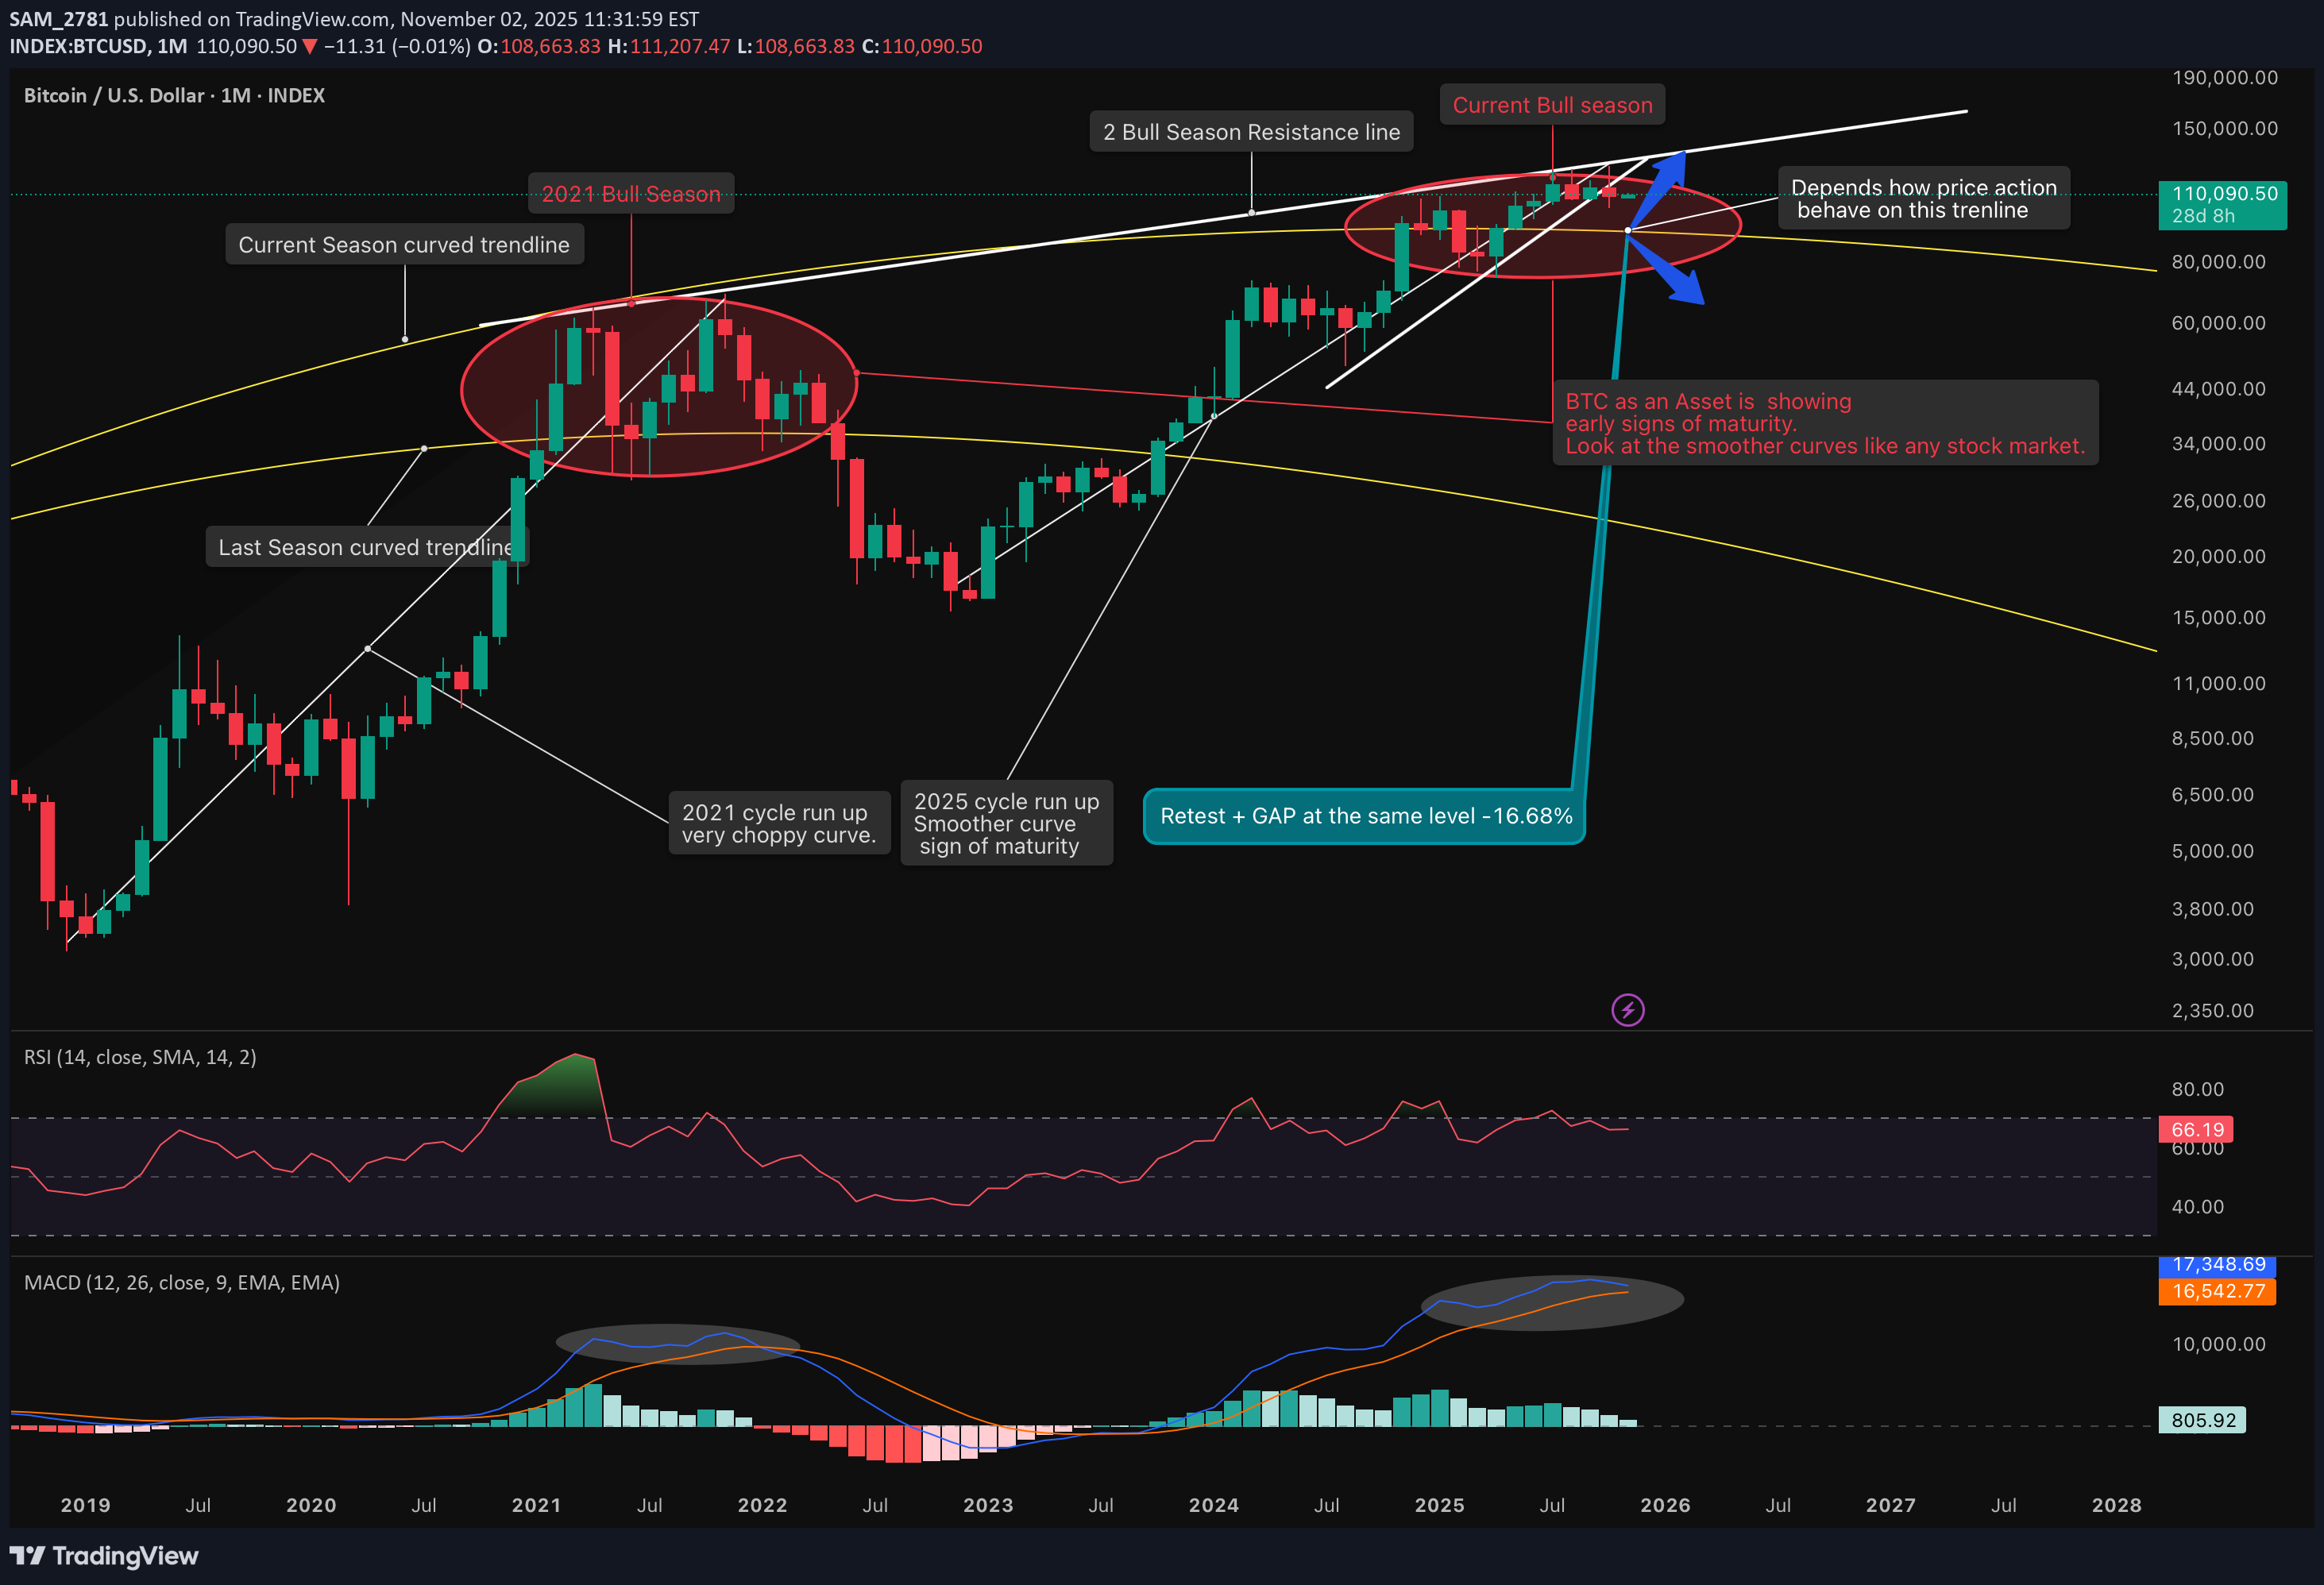
The End of a Cycle? My analysis suggests this bull run is showing clear signs of exhaustion. One thing is certain: Bitcoin as an asset class is displaying early signs of maturity, Compared to previous bull runs. . I have been repeating this for so many times. Check the below analysis for a detailed view on the same - This cycle has been longer in duration, yet its structure is mapping out an almost identical pattern in terms of how it's peaking. A Striking Parallel to the Last Peak Then (2021 Peak): Bitcoin broke above the foundational curved support (the yellow line), but failed to break the overhead resistance (the white line). After retesting it twice and forming a double top, it crashed back through the curved support. Now (Current Cycle): The pattern has repeated with remarkable accuracy. BTC broke through the same yellow curved line but has repeatedly failed to breach the resistance from the previous bull season's peak. It has similarly formed a double top and has now officially broken down from its more recent rising trendline. What the Indicators Are Saying The breakdown is further confirmed by a developing MACD death cross on this high timeframe. Historically, before a significant drop following such a crossover, the price action often makes one final spike upward to trap bullish liquidity. This puts a long-standing CME gap around the $9,2200 level back into focus. While BTC has filled nearly all its daily gaps, this is a major one that remains. 4. Three Scenarios for the Path Forward The market is debating whether we consolidate for an alt-season or if BTC has one last leg up. Based on the charts, here are the primary paths I see: The Corrective Wave: The most direct path. Bitcoin fails to reclaim the broken trendline on a retest, confirming it as resistance. This would likely trigger the start of the fall toward the lower CME gap target. The Consolidation Range : Bitcoin consolidates in the area around the recently broken trendline. This period of lower volatility and sideways action could provide the stability needed to trigger a true, sustained alt-season. The Liquidity Hunt: Before a major move down, BTC could make a final, sharp spike upward to hunt liquidity above the recent highs. It would then likely settle back below the white resistance trendline and begin the consolidation phase described in scenario 2, kicking off the alt-season from there. My subsequent analysis will detail the potential duration and targets for the upcoming alt-season based on which of these scenarios unfolds. Like and follow for more in-depth market analysis and forecasts — Thanks for reading. Sam.
آینده NEAR پروتکل: آیا زمان صعود است یا سقوط؟ تحلیل حیاتی سطوح قیمت
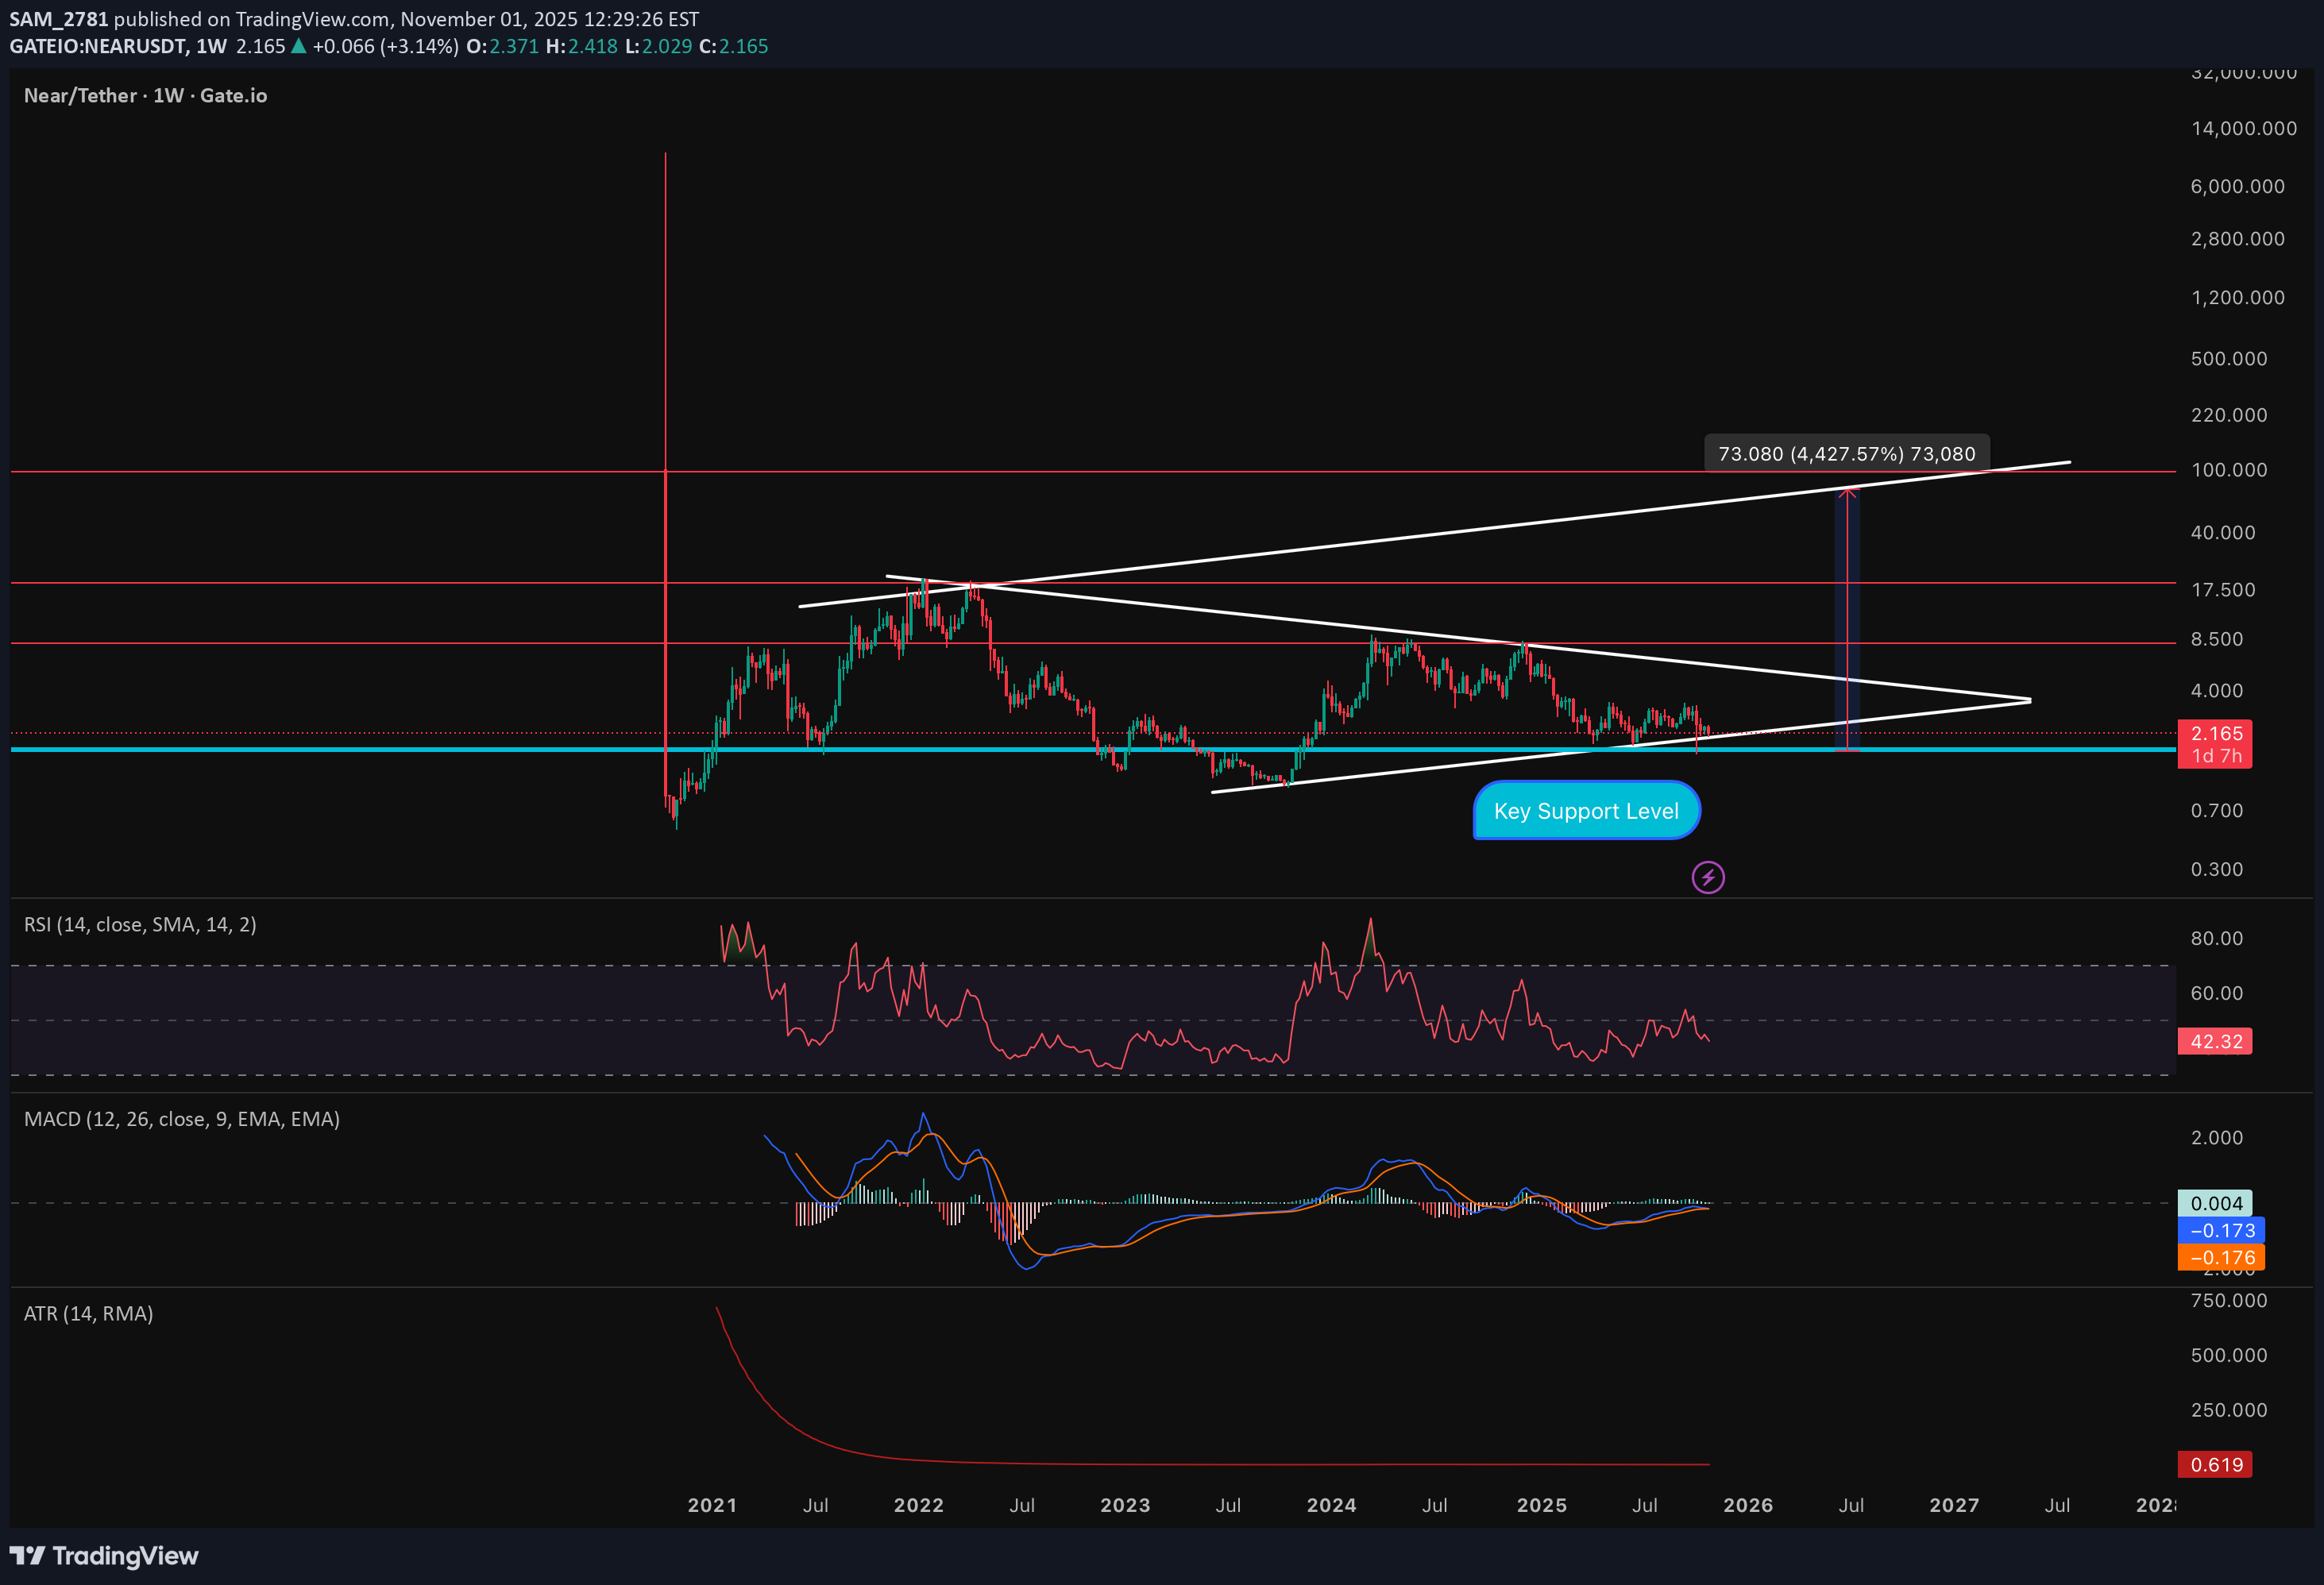
Is NEAR Protocol at a turning point—or facing a critical test? As one of the fastest-rising Layer-1 blockchains, NEAR now stands at a pivotal technical intersection: price action drifts near historic support, while whale activity and ecosystem strength hint at renewed momentum. For traders, investors, and technologists alike, understanding the next move—and risk factors—is more urgent than ever. In this exclusive report, get expert analysis, practical levels to watch, and a clear view on whether NEAR is set to reclaim bullish ground or risk deeper corrective action. A hold above current support could trigger a meaningful rally, but failure risks further downside. The project’s fundamentals and tech partnerships are strong, but recent price weakness and competitive pressures require cautious optimism. Monitor the $2.10–$2.20 zone closely for the next directional move. Fundamentally, the protocol offers Super fast and cheap transactions; easy to use like regular apps; works with other blockchains; big companies support it; has lots of money saved up. Could power AI assistants you own; make crypto invisible in apps; handle real money transactions; grow in Asia and Middle East. However, there are some challenges ahead as it is not as popular as Bitcoin/Ethereum; depends on giving away free money to attract users; fewer places to trade it; hard to explain why it's special as many projects are doing the same but Companies like Google Cloud help NEAR, like having the popular kids at school be your friends. Moreover, NEAR Foundation has lots of money saved up to keep building cool stuff. They won't run out of money to make improvements. CoinLore predicts much higher prices ($12.53–$19.77), but this is far above other reputable forecasts and current market behavior. Therefore, Fundamentals remain promising, but short-term price action is fragile and dependent on both technicals and broader market sentiment. Set stop-losses below the current support, as a breakdown could lead to further declines in the short term.
هشدار جدی بیت کوین: خط مقاومتی که دو بازار خرسی بزرگ را پیشبینی کرد، دوباره قرمز شد!
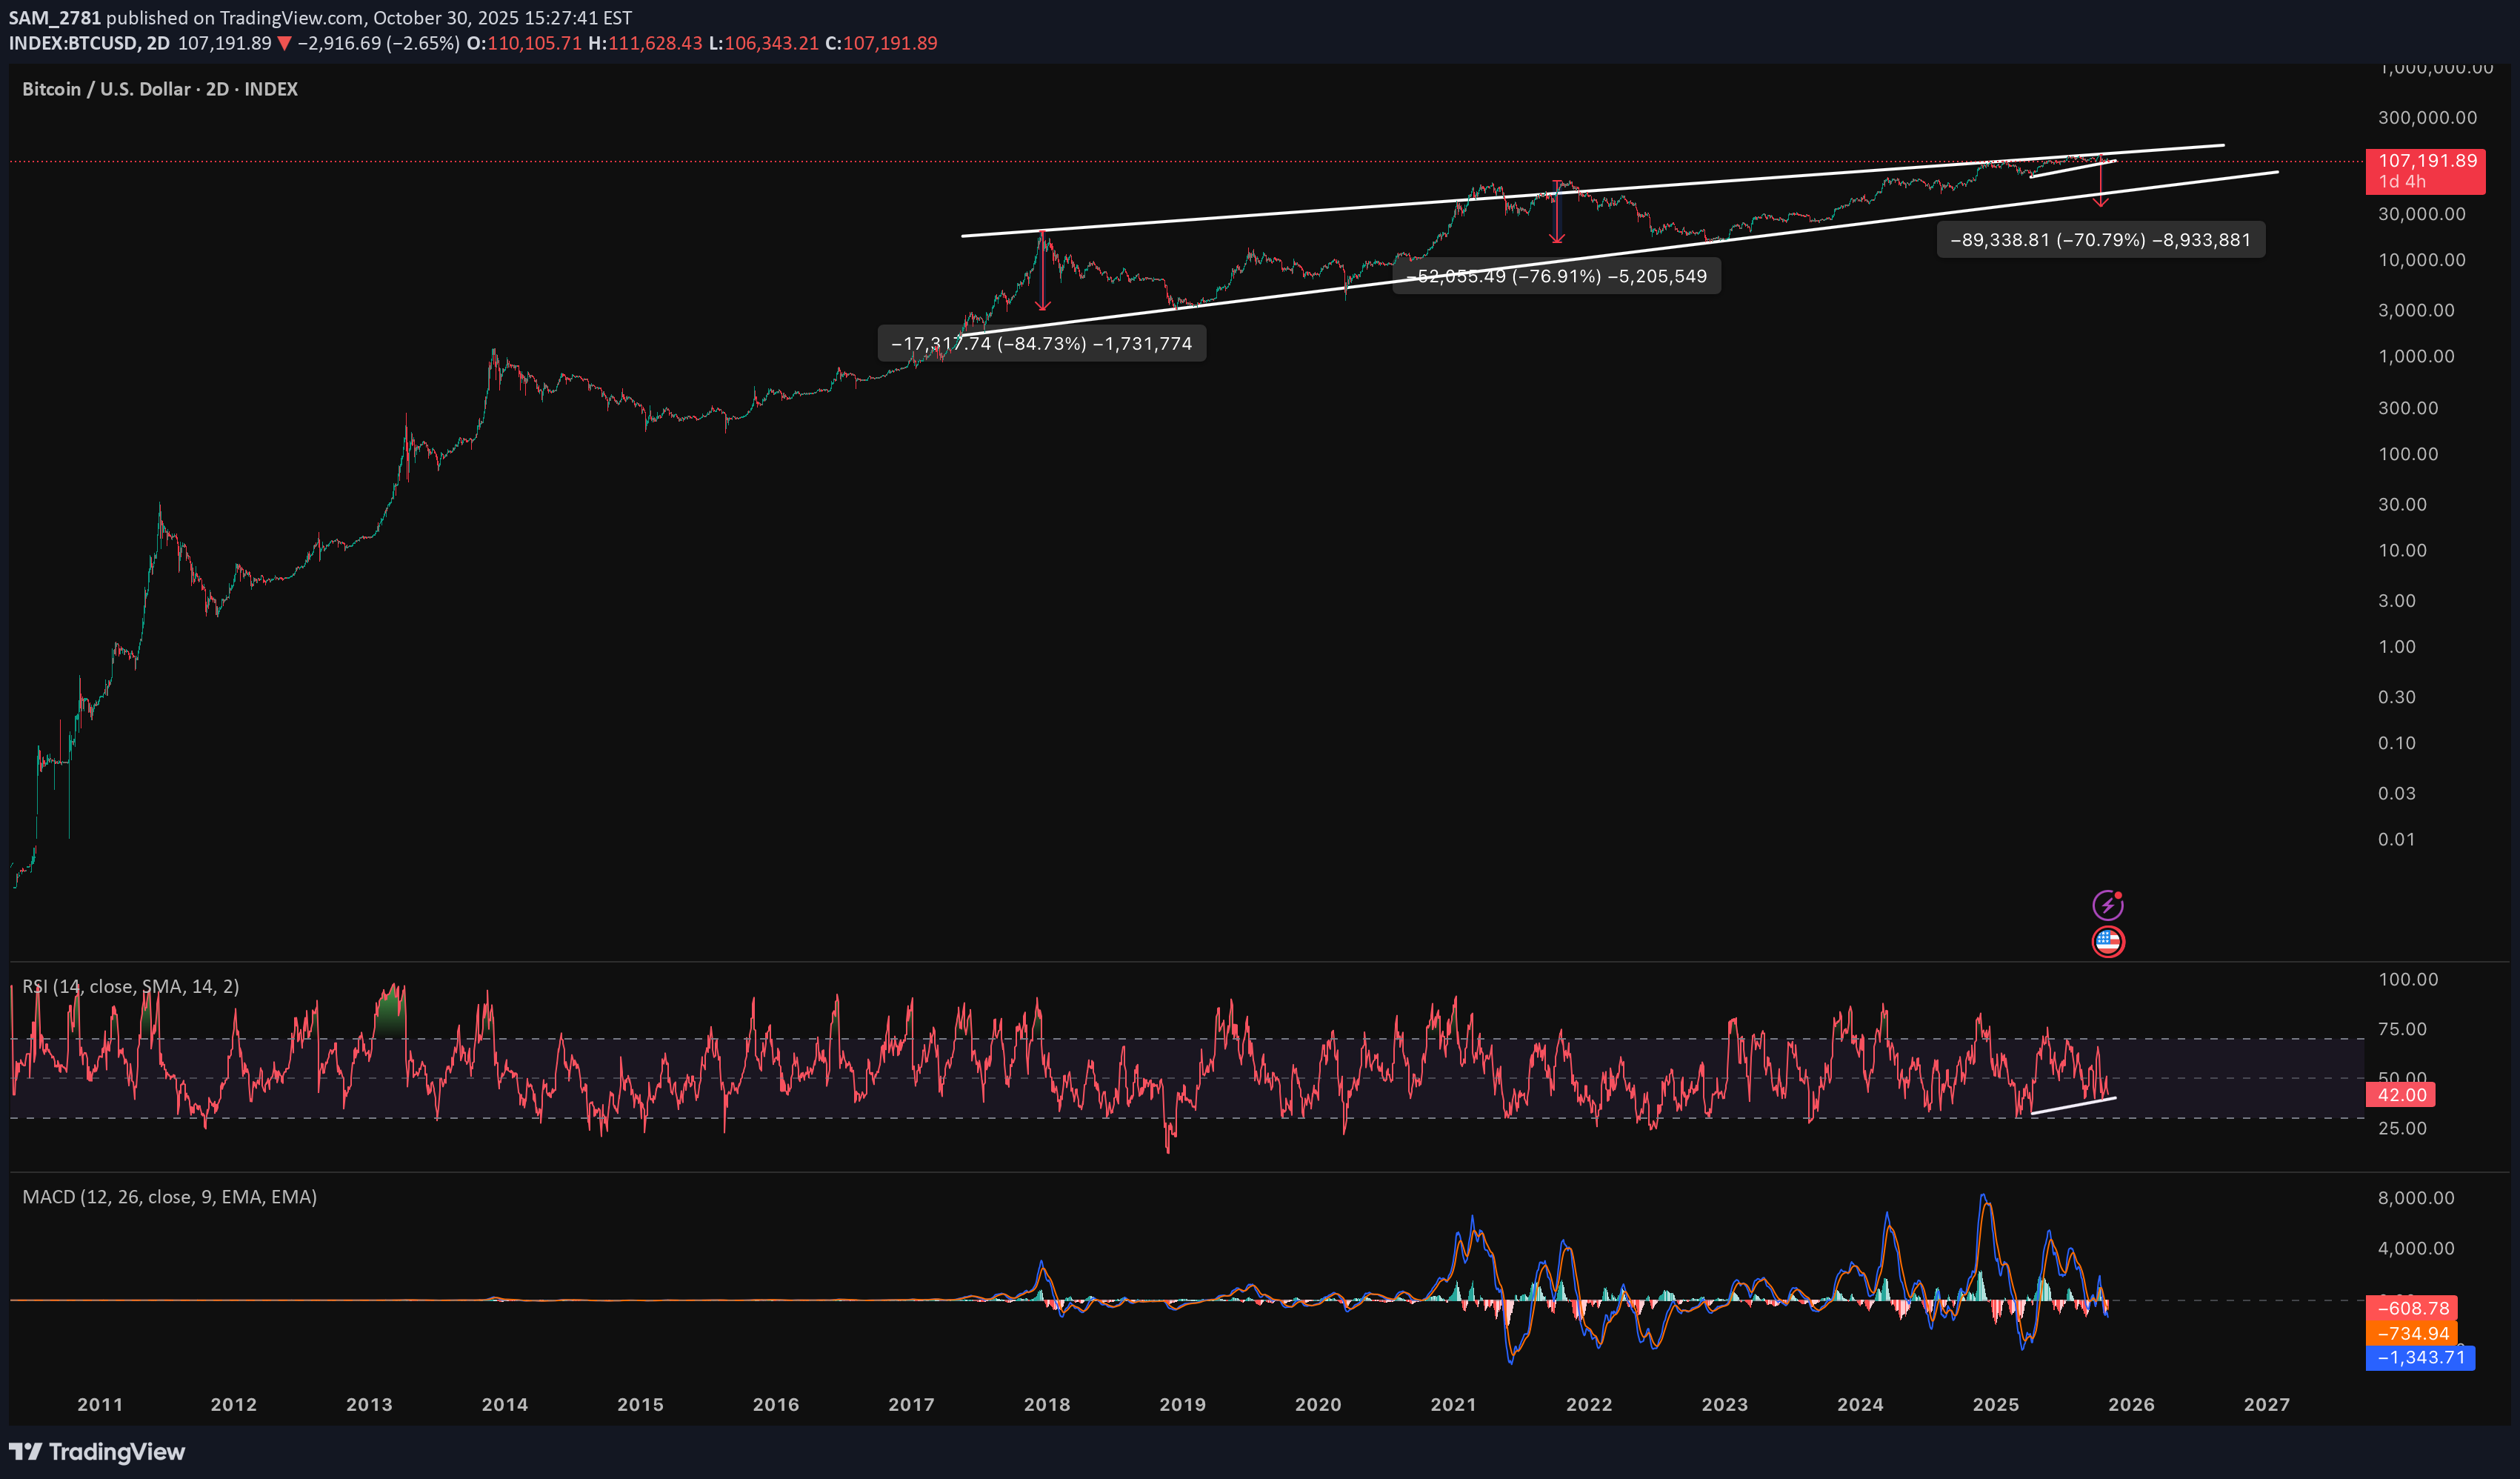
Bitcoin’s long-term resistance trendline has triggered two of its most severe bear markets. In December 2017, hitting this line led to an 84% correction throughout 2018. The 2021 touch saw a 76% decline—both marking clear cyclical tops. Currently, Bitcoin is repeatedly testing this resistance again, suggesting the pattern might repeat. While I’m not claiming an immediate reversal, my analysis suggests there may be one final leg up, potentially deepening bearish divergence before a significant retracement. The historical pattern warrants caution: when a structural level has twice led to major corrections, it demands attention. Traders should view this as a critical risk zone, not a certainty. Manage position sizes, implement stop-losses, and plan for downside if resistance holds. Conversely, a decisive breakout would change the outlook. Disciplined risk management is essential with such recurring technical signals.
تحلیل تکنیکال طلا: راز صعود قدرتمند در دل اصلاح کجاست؟ (سطح بحرانی ۴,۰۰۶)
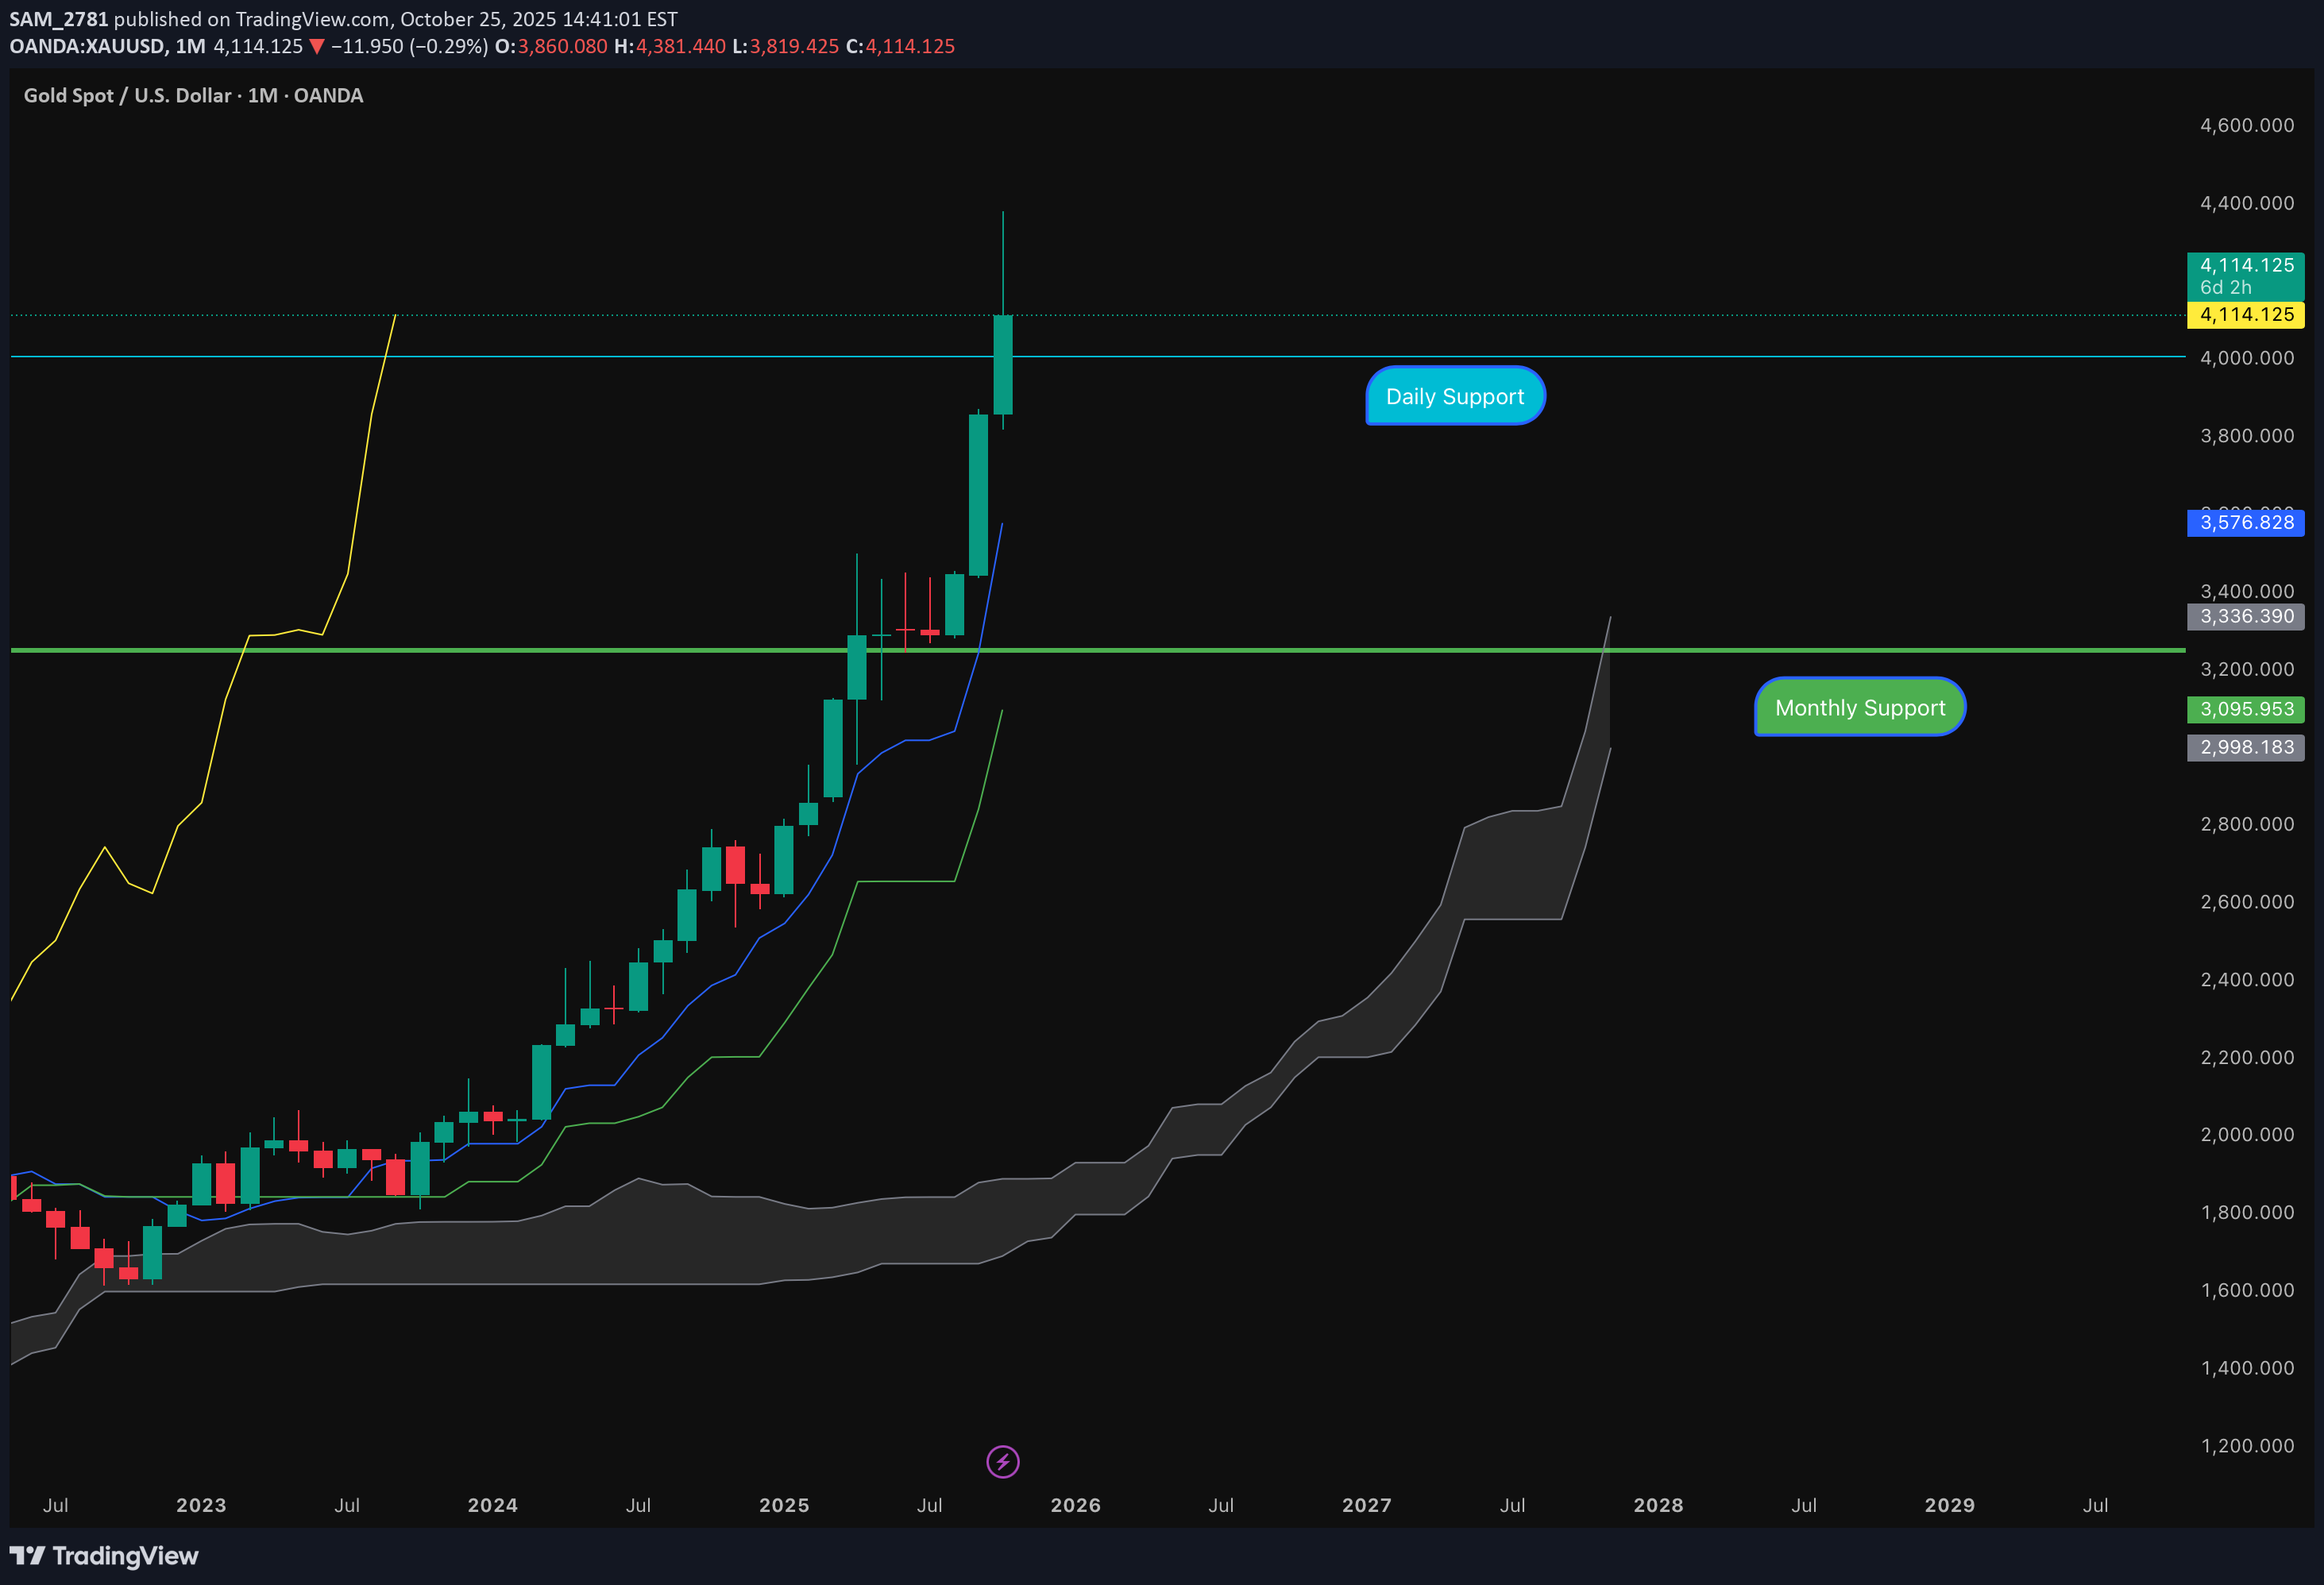
Gold presents a multi-timeframe consolidation scenario with strong monthly bullish structure intact, while shorter timeframes indicate a critical juncture requiring careful monitoring of key support levels. The analysis reveals a classic pullback within a larger uptrend, offering strategic entry opportunities. Multi-Timeframe Ichimoku Analysis 1. Monthly Chart - STRONGLY BULLISH Kumo Cloud: Thick and supportive, indicating robust trend strength Kijun-Sen: Ascending, confirming primary uptrend momentum Chikou Span: Above price candles and rising - bullish momentum maintained Senkou Span A & B: Both ascending, reinforcing structural bullishness Assessment: Long-term trend remains powerfully bullish with strong foundation 2. Weekly Chart - CONSOLIDATION PHASE Kumo Cloud: Flattened - trend pause after significant advancement Senkou Span A: Flat - momentum cooling Kijun-Sen: Flat - equilibrium phase Chikou Span: Above candles but declining - weakening short-term momentum Assessment: Healthy consolidation after substantial leg up; preparing for next directional move 3. Daily Chart - BULLISH BIAS WITH CAUTION Overall Trend: Upward but consolidating Kijun-Sen: Flat - sideways momentum Kumo & Senkou Span A: Both flat - trend neutrality Chikou Span: Maintaining position above candles Critical Level: 4,006 - Key support threshold Assessment: Bullish structure intact unless decisive break below 4,006 with close below Kijun-Sen 4. 4-Hour Chart - RANGE-BOUND WITH BEARISH SIGNALS Market Structure: Range-bound conditions Kijun-Sen: Within Kumo cloud - trend uncertainty Chikou Span: Below candles - near-term bearish pressure Assessment: Short-term weakness but insufficient to negate higher timeframe bullish setup Trading Strategy Framework 1. Bullish Scenario (Higher Probability) Entry Trigger: Hold above 4,006 on daily close Target: Next leg up toward previous highs Stop Loss: Below 4,000 daily close 2. Bearish Scenario (Lower Probability) Confirmation: Daily close below 4,006 AND Kijun-Sen Target: Test of 3,248 support zone Strategy: View as accumulation opportunity rather than trend reversal 3. Strategic Accumulation Zone: 3,248 level Rationale: Monthly bullish structure + weekly consolidation = high-probability reversal area Risk/Reward: Favorable given strong higher timeframe bullishness Risk Assessment & Outlook Risk Factors 4-hour Chikou Span below candles indicates short-term weakness Daily close below 4,006 could trigger deeper correction Range-bound 4-hour structure suggests indecision Bullish Catalysts Monthly Ichimoku remains powerfully bullish across all components Weekly consolidation typical after strong advances Daily trend structure intact above key support. Primary Outlook: CONSTRUCTIVELY BULLISH The gold market exhibits classic multi-timeframe dynamics where a strong primary trend (monthly) is experiencing healthy consolidation (weekly/daily) with short-term noise (4-hour). The 4,006 level serves as the critical fulcrum - holding above maintains bullish trajectory toward new highs, while a break opens opportunity for strategic accumulation around 3,248. Recommended Approach: Monitor 4,006 daily closes closely. Use any weakness toward 3,248 as high-probability long entry given the robust monthly bullish foundation. This analysis is based on Ichimoku Kinko Hyo methodology and current market structure as of October 25, 2025. Markets involve risk - manage position sizing accordingly. Your likes, follows, and comments would support my technical analysis work immensely and help me continue sharing detailed multi-timeframe insights with the TradingView community. Thank you for reading, and may your trades be profitable! 🚀📈 Trade safely and always manage your risk - Thank you SAM.
Disclaimer
Any content and materials included in Sahmeto's website and official communication channels are a compilation of personal opinions and analyses and are not binding. They do not constitute any recommendation for buying, selling, entering or exiting the stock market and cryptocurrency market. Also, all news and analyses included in the website and channels are merely republished information from official and unofficial domestic and foreign sources, and it is obvious that users of the said content are responsible for following up and ensuring the authenticity and accuracy of the materials. Therefore, while disclaiming responsibility, it is declared that the responsibility for any decision-making, action, and potential profit and loss in the capital market and cryptocurrency market lies with the trader.