Technical analysis by SAM_2781 about Symbol PAXG: Buy recommendation (10/25/2025)

تحلیل تکنیکال طلا: راز صعود قدرتمند در دل اصلاح کجاست؟ (سطح بحرانی ۴,۰۰۶)
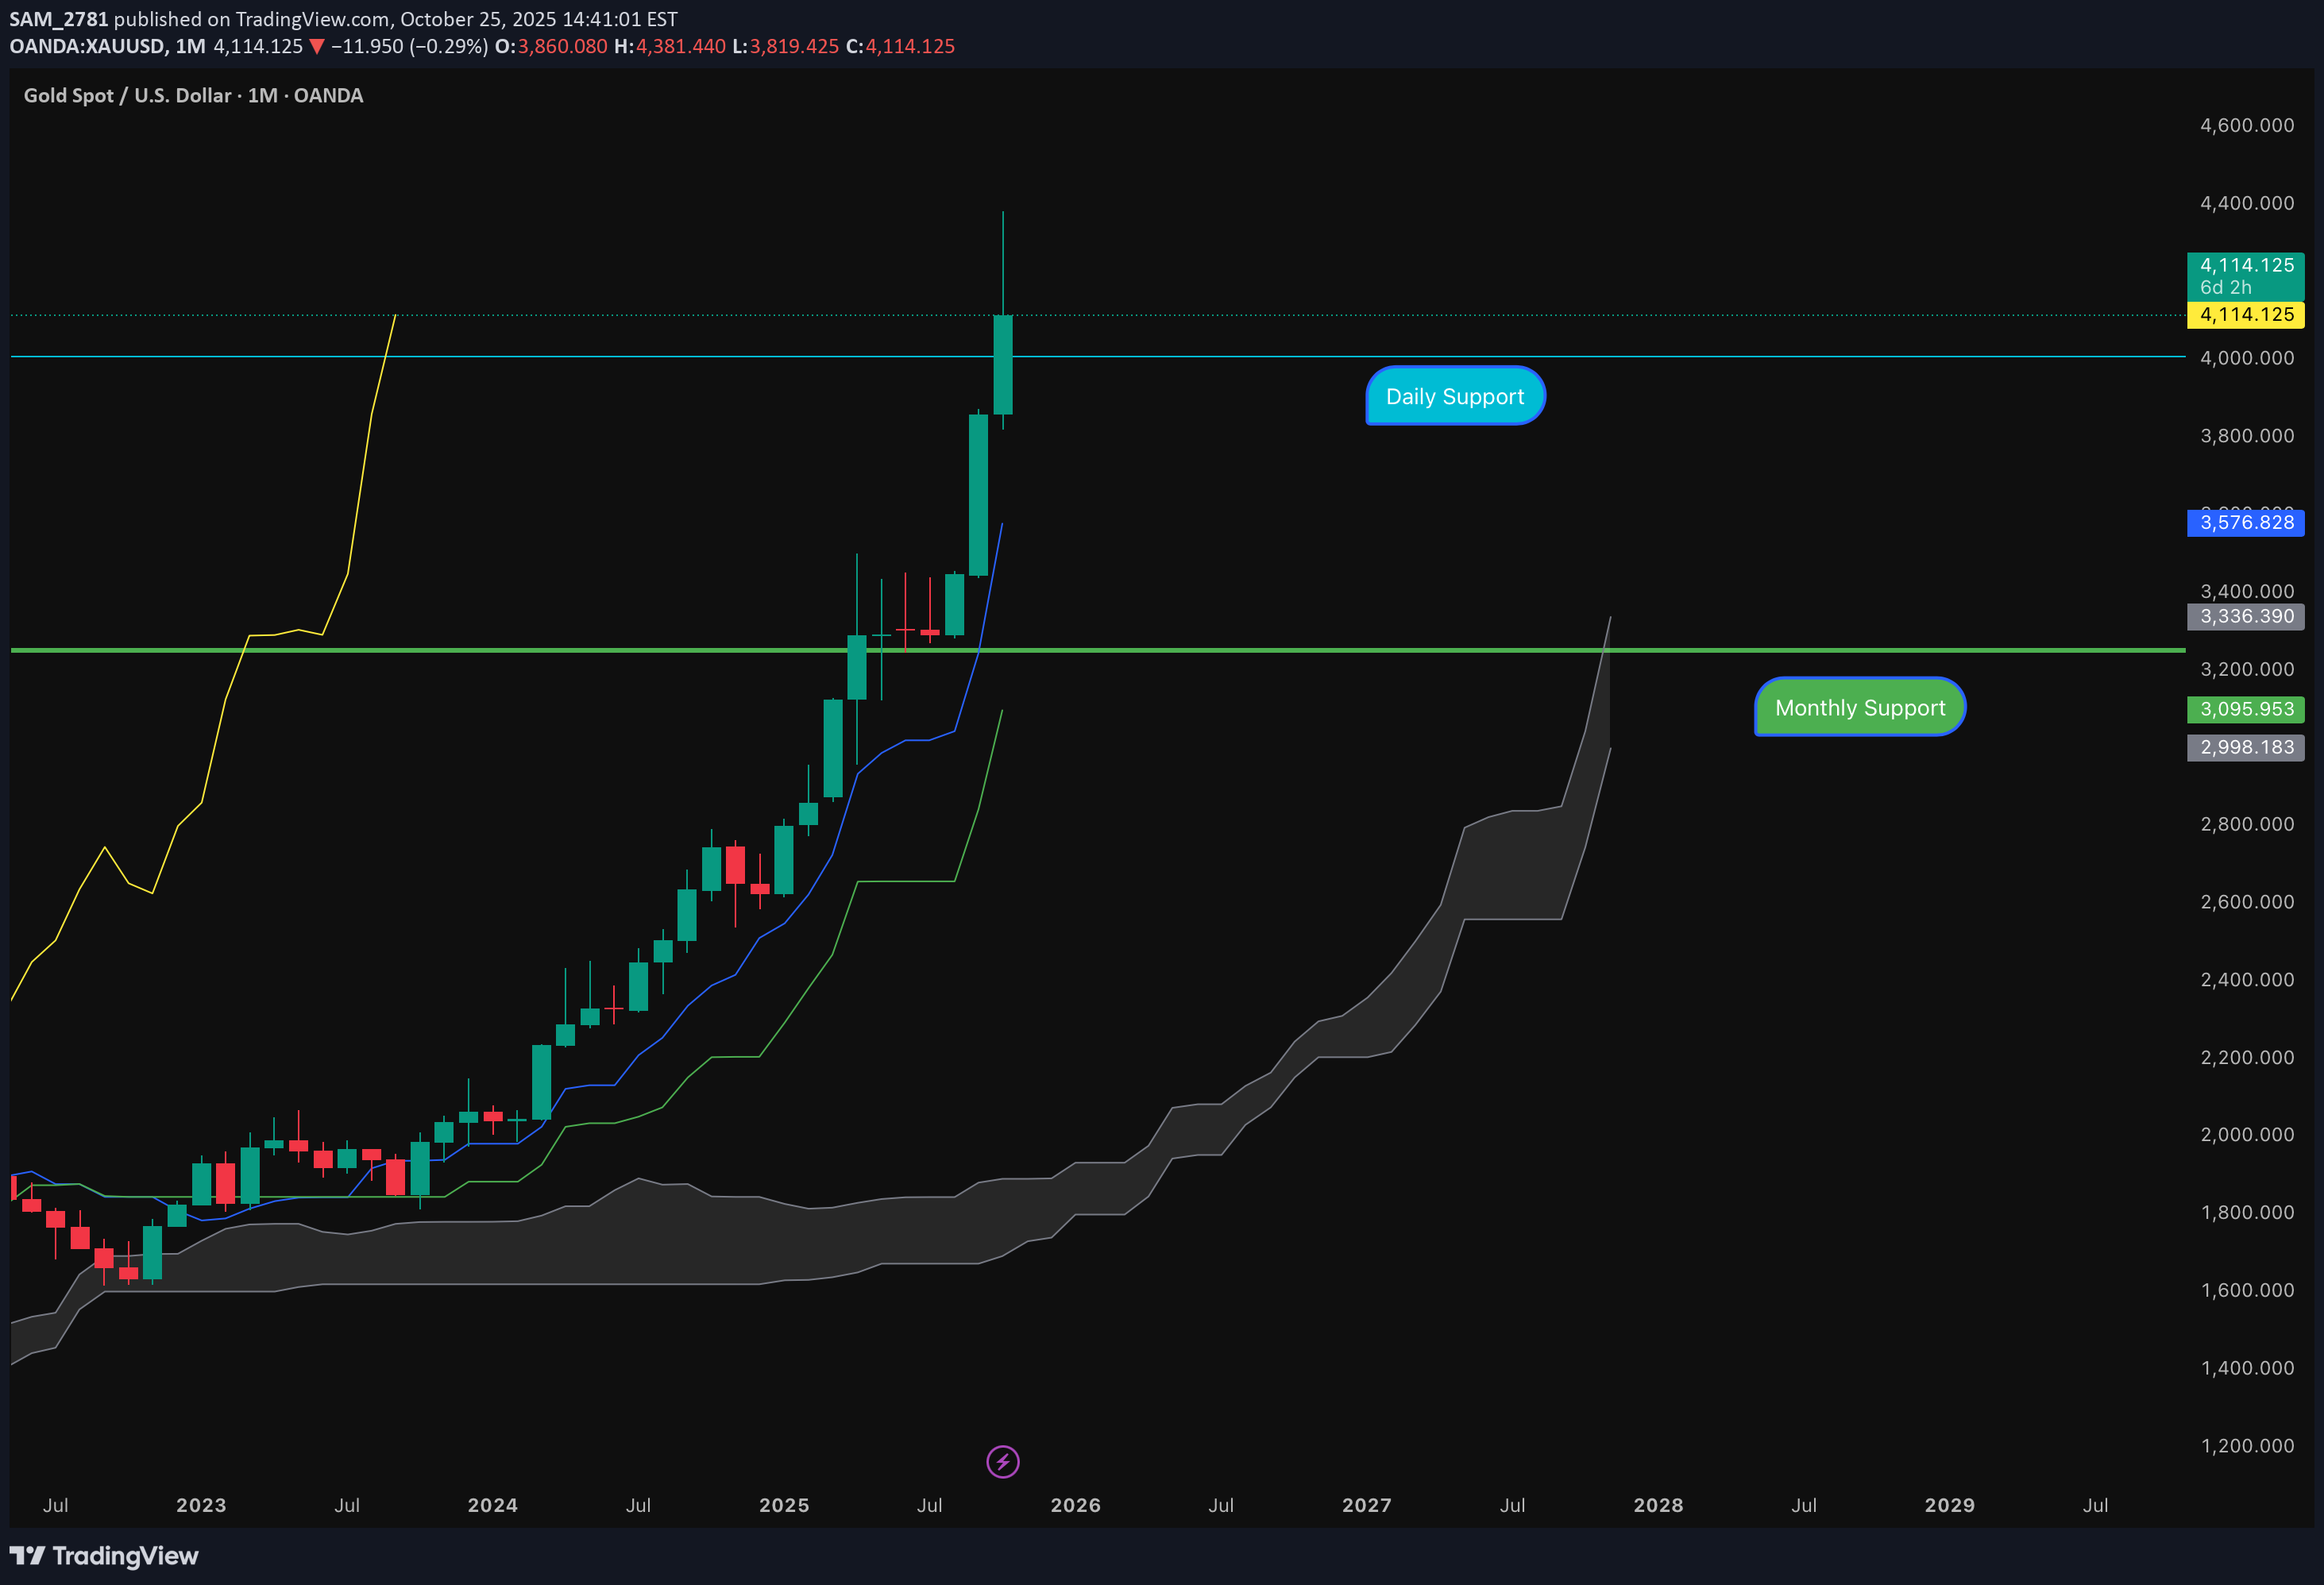
Gold presents a multi-timeframe consolidation scenario with strong monthly bullish structure intact, while shorter timeframes indicate a critical juncture requiring careful monitoring of key support levels. The analysis reveals a classic pullback within a larger uptrend, offering strategic entry opportunities. Multi-Timeframe Ichimoku Analysis 1. Monthly Chart - STRONGLY BULLISH Kumo Cloud: Thick and supportive, indicating robust trend strength Kijun-Sen: Ascending, confirming primary uptrend momentum Chikou Span: Above price candles and rising - bullish momentum maintained Senkou Span A & B: Both ascending, reinforcing structural bullishness Assessment: Long-term trend remains powerfully bullish with strong foundation 2. Weekly Chart - CONSOLIDATION PHASE Kumo Cloud: Flattened - trend pause after significant advancement Senkou Span A: Flat - momentum cooling Kijun-Sen: Flat - equilibrium phase Chikou Span: Above candles but declining - weakening short-term momentum Assessment: Healthy consolidation after substantial leg up; preparing for next directional move 3. Daily Chart - BULLISH BIAS WITH CAUTION Overall Trend: Upward but consolidating Kijun-Sen: Flat - sideways momentum Kumo & Senkou Span A: Both flat - trend neutrality Chikou Span: Maintaining position above candles Critical Level: 4,006 - Key support threshold Assessment: Bullish structure intact unless decisive break below 4,006 with close below Kijun-Sen 4. 4-Hour Chart - RANGE-BOUND WITH BEARISH SIGNALS Market Structure: Range-bound conditions Kijun-Sen: Within Kumo cloud - trend uncertainty Chikou Span: Below candles - near-term bearish pressure Assessment: Short-term weakness but insufficient to negate higher timeframe bullish setup Trading Strategy Framework 1. Bullish Scenario (Higher Probability) Entry Trigger: Hold above 4,006 on daily close Target: Next leg up toward previous highs Stop Loss: Below 4,000 daily close 2. Bearish Scenario (Lower Probability) Confirmation: Daily close below 4,006 AND Kijun-Sen Target: Test of 3,248 support zone Strategy: View as accumulation opportunity rather than trend reversal 3. Strategic Accumulation Zone: 3,248 level Rationale: Monthly bullish structure + weekly consolidation = high-probability reversal area Risk/Reward: Favorable given strong higher timeframe bullishness Risk Assessment & Outlook Risk Factors 4-hour Chikou Span below candles indicates short-term weakness Daily close below 4,006 could trigger deeper correction Range-bound 4-hour structure suggests indecision Bullish Catalysts Monthly Ichimoku remains powerfully bullish across all components Weekly consolidation typical after strong advances Daily trend structure intact above key support. Primary Outlook: CONSTRUCTIVELY BULLISH The gold market exhibits classic multi-timeframe dynamics where a strong primary trend (monthly) is experiencing healthy consolidation (weekly/daily) with short-term noise (4-hour). The 4,006 level serves as the critical fulcrum - holding above maintains bullish trajectory toward new highs, while a break opens opportunity for strategic accumulation around 3,248. Recommended Approach: Monitor 4,006 daily closes closely. Use any weakness toward 3,248 as high-probability long entry given the robust monthly bullish foundation. This analysis is based on Ichimoku Kinko Hyo methodology and current market structure as of October 25, 2025. Markets involve risk - manage position sizing accordingly. Your likes, follows, and comments would support my technical analysis work immensely and help me continue sharing detailed multi-timeframe insights with the TradingView community. Thank you for reading, and may your trades be profitable! 🚀📈 Trade safely and always manage your risk - Thank you SAM.