
RogueEconomics
@t_RogueEconomics

What symbols does the trader recommend buying?
Purchase History
پیام های تریدر
Filter
RogueEconomics
Monitoring a possible leading diagonal move on Hedera HBAR

As you can see in Fig. A, HBAR has often printed some nice, recognisable diagonal patterns (in this case, A was a leading diagonal for a nice 5-count rally).I believe we have another such diagonal forming now at Fig. BIt's clear that this is a slightly smaller pattern, suggesting a degree lower (I have labelled the first one as intermediate and the recent pattern as minor respectively).If this is the case, I believe there is every reason to believe that we are about to see HBAR assert itself and embark on a Wave 3 extension - this means that the diagonal rally at B would be wave 1 and we should expect a further rally with wave 3 starting soon and running 1.618 at least of Wave 1 and Wave 5 probably being parity with Wave 1 for length.Standard elliot wave estimation.However, we should bear in mind that crypto often involves significant variance on these base estimates so, I'm expecting a really good pop in the near future.Trade safe!
RogueEconomics
Falling wedge into convergence pattern on Hedera HBAR

We appear to be getting near the end of the correction on HBAR/USD.We see a big 4h falling wedge pattern and a bullish convergence to compliment this.I do think we're nearing the end of this correction.Watch carefully over the coming days.
RogueEconomics

Seems to me that the HBAR correction we're watching is forming a falling wedge down into what the volume profile shows as a very significant volume spike.Notice as well, the wedge pattern is forming off a very significant dip (2nd biggest in approx 12 months) and this very low RSI reading is unlikely to be broken. If HBAR breaks the 18 cents mark but puts in a higher RSI, as long as it respects the support vector of the wedge (and, more broadly, the lateral support vector of that big volume influx), then we should end up with a very bullish outline that shows a big falling wedge along a big RSI convergence pattern that forms atop a significant support vector comprised of the big volume influx.A very bullish outline overall.My view here is that you should DCA into the 18 cents mark and put your stop somewhere below it in case the market cucks us all.Good luck and happy trading!
RogueEconomics
Potential large triangle ABCDE pattern on XRPUSD

I don't trade XRP as a rule BUT... I have noticed this very large triangle pattern here.This should serve as an indicator for the rest of the market - hence it's interest to me.This can only be a wave 4, which means we should expect further upside. In fact on a speculative basis, as I sketch here, I suspect that this is only a subwave of something much bigger taking place My reasoning being that I think the divergence that took place between November and December is far too small to be indicative of a proper top.On broader daily timeframes, there is no divergence at all.Which means that the overall crypto market is not done yet and there's further upside on altcoins.To trade this, DCA the next dip (assuming we get one!), and have an invalidation threshold (a hard stop) about 1.90.Trade carefully and watch your stops.
RogueEconomics
Short-term falling wedge on HBAR/USD

Short-term falling wedge on HBAR USD.There is a more obvious bullish convergence pattern on smaller timeframes but trading view is rubbish and won't let me publish short-term charts to demonstrate this.However, if that finer-res convergence pattern persists, I expect it to migrate onto bigger timeframes soon.I'd look for a serious break of the trendlines to invalidate this.This should resolve within a few hours.
RogueEconomics
Potentially Complex Diamond Pattern On $AMZN
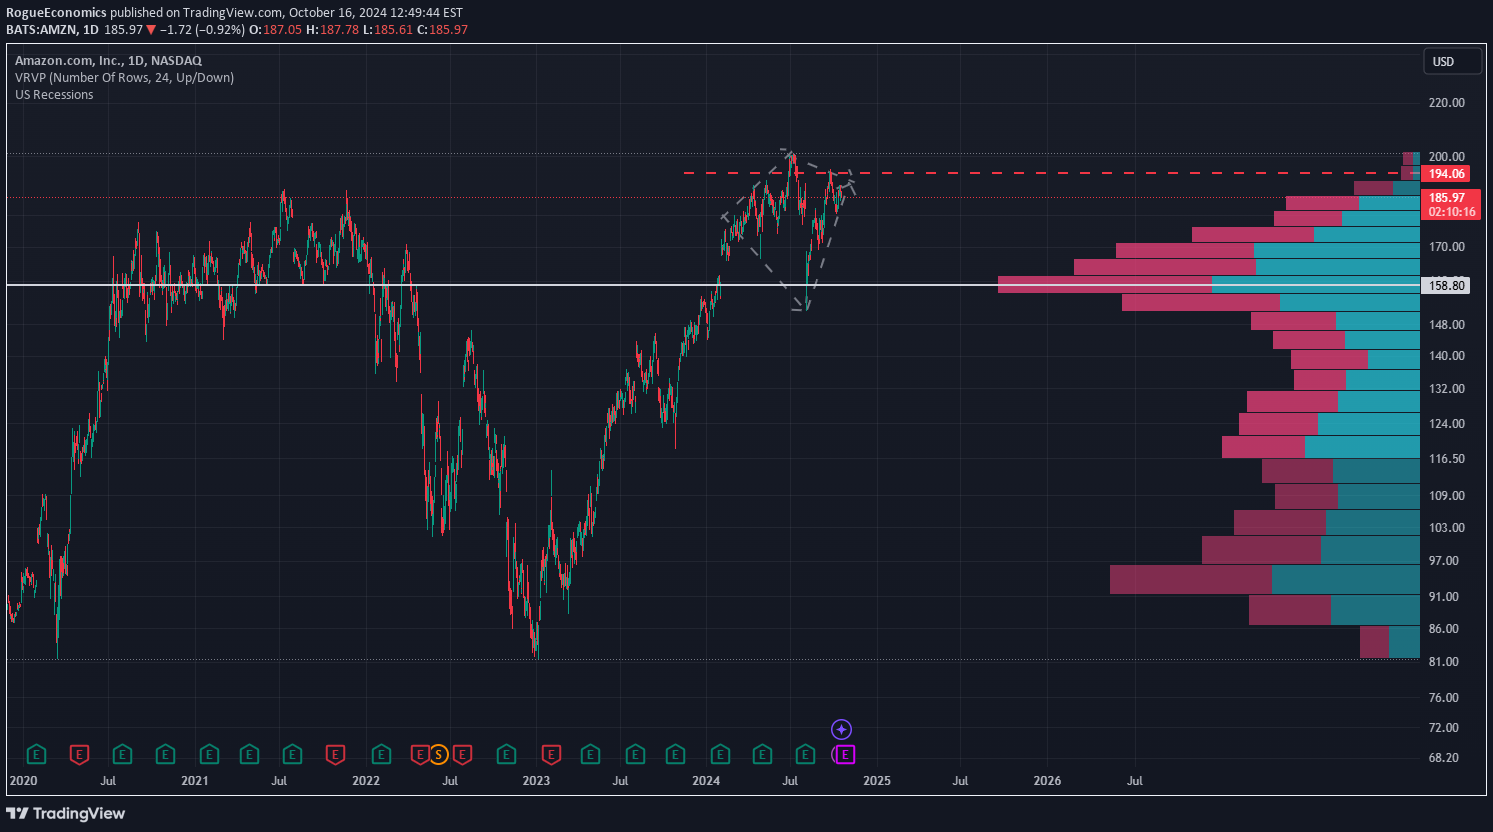
This looks like a diamond pattern on AMZN. I have taken puts here with the stop just a little way above (it would have to break this level to invalidate the pattern in my view). The diamond pattern is clear. There is the initial high, the low, the higher high, the lower low, and the return to the original range. I have no idea why or what fundamental reason could cause AMZN to dip here, but, fundamentals don't work in this market and I have to trust the price action (but with tight stops and take profits naturally) If it resolves, it will conclusively break the lower trendline. I suspect that the bottom will be the point-of-control on the volume profile. If it invalidates, it will take out the September highs and this will correlate to the SPX and NDX melt-up. Trade carefully and watch this form closely.
RogueEconomics
Diamond Reversal Forming On Tesla ($TSLA)
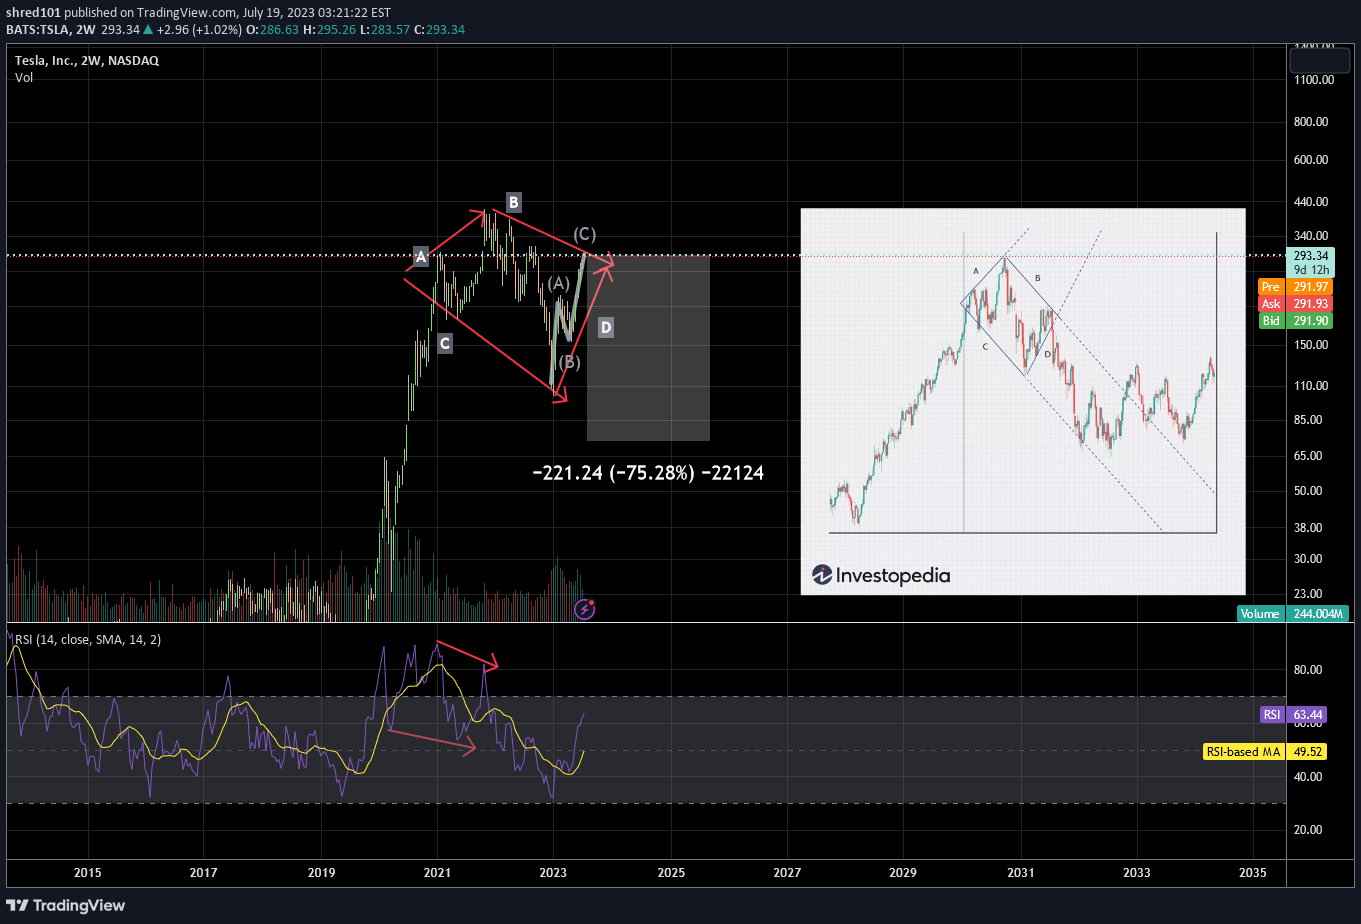
This pattern on TSLA fits the outline for a diamond reversal that is referenced on Investopedia. It has all the "classical" facets of a diamond reversal which is a high (A), a low (C) a higher-high. Furthermore, this is happening alongside a very similar pattern on NFLX and some bearish patterns on many other stocks. Similar forms also occurred on SPX in 2021-2222 and Bitcoin in 2021. The move up from the 2023 lows has the form of an ABC up... which suggests another 5 wave downmove on-par with or even exceeding the previous downmove is on the way. The move off the highs was a whole 75% so even presuming a moderate 1:1 ratio, the next wave down could be very aggressive which means that an excellent short could be lining up. Trade safe and be careful out there.Correction Line 2 should say: It has all the "classical" facets of a diamond reversal which is a high (A), a low (C) a higher-high (B) and a zig-zag move along axis (D).Less of a drop than I thought, but we got the drop nonetheless.
Disclaimer
Any content and materials included in Sahmeto's website and official communication channels are a compilation of personal opinions and analyses and are not binding. They do not constitute any recommendation for buying, selling, entering or exiting the stock market and cryptocurrency market. Also, all news and analyses included in the website and channels are merely republished information from official and unofficial domestic and foreign sources, and it is obvious that users of the said content are responsible for following up and ensuring the authenticity and accuracy of the materials. Therefore, while disclaiming responsibility, it is declared that the responsibility for any decision-making, action, and potential profit and loss in the capital market and cryptocurrency market lies with the trader.