
RizeSenpai
@t_RizeSenpai

What symbols does the trader recommend buying?
Purchase History
پیام های تریدر
Filter
RizeSenpai
Ethereum Struggles to Complete above the 0.786 Bearish 5-0 Zone
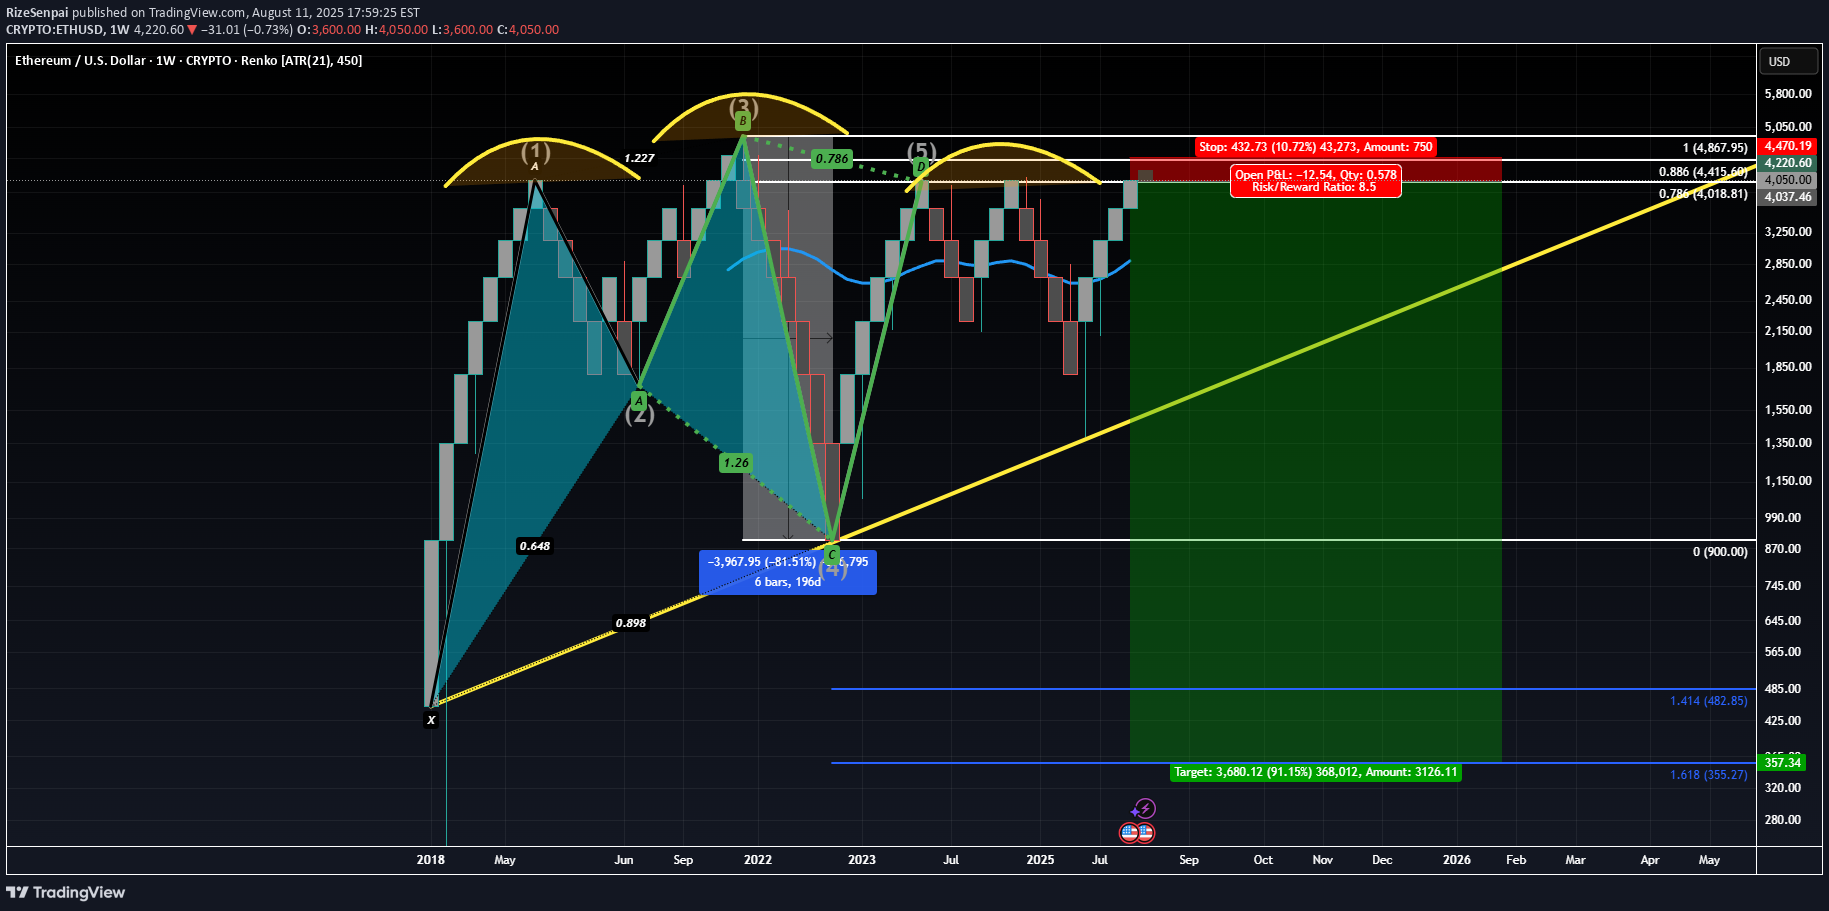
While on the intra-bar price action on ETH has gotten pretty excited above the 0.786 it is still worth considering that ETH has not completed any bars above the 0.786 since the breakout and that at a moments noticed much of the current price action above the main 0.786 PCZ could later find itself being filtered out of the Renko charts as a whole depending on how many Average True Ranges above the 0.786 PCZ ETH possible move. Based on the fact that the current candle is simply still in the projection phase I'd caution longs here and remain accumulative of longer dated puts. There is also a 2x leveraged ETF of ETH called ETHU which has OTM monthly call options trading at 20-40 dollar premiums. I'd consider farming off of those premiums in the form of Bear Vertical Spreads as a way to hedge off the costs of holding the long puts. Overall, we are still trading at the PCZ of the Bearish 5-0 which seems to also be in the similar shape of a Bearish Head and Shoulders pattern; the measure move of which could take ETH down to around $355 upon the break of $1,600
RizeSenpai
Solana's Bearish 5-0 is Locking in a Bearish Reversal to $26.40
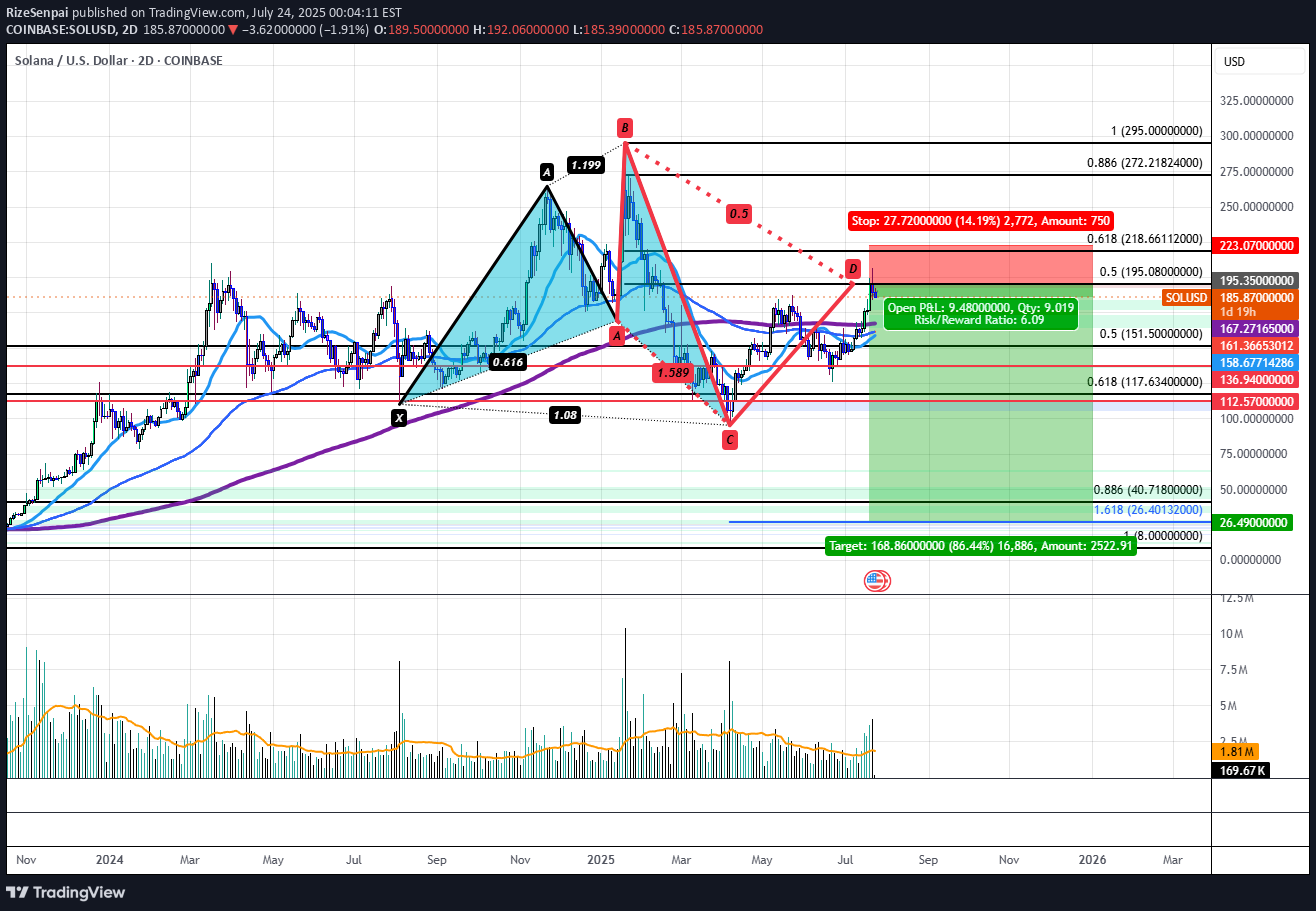
Solana has recently run up to Horizontal Resistance Zone of $195-$210 aligning with the PCZ of a Bearish 5-0 and has begun to impulse downwards with volume to back it. This could be the start of a greater move down that would take SOL back to the low of the distributive range at $95.16. If the level breaks, we would then target a drop down to the $40.72-$26.40 confluence area aligning with the all-time 0.886 retrace as well as the 1.618 extension from previous swing low to high. Only at these levels could we even possibly begin to consider Bullish Entries on Solana.
RizeSenpai
BTCUSD: Bearish Logscale Butterfly with Bearish RSI Divergence
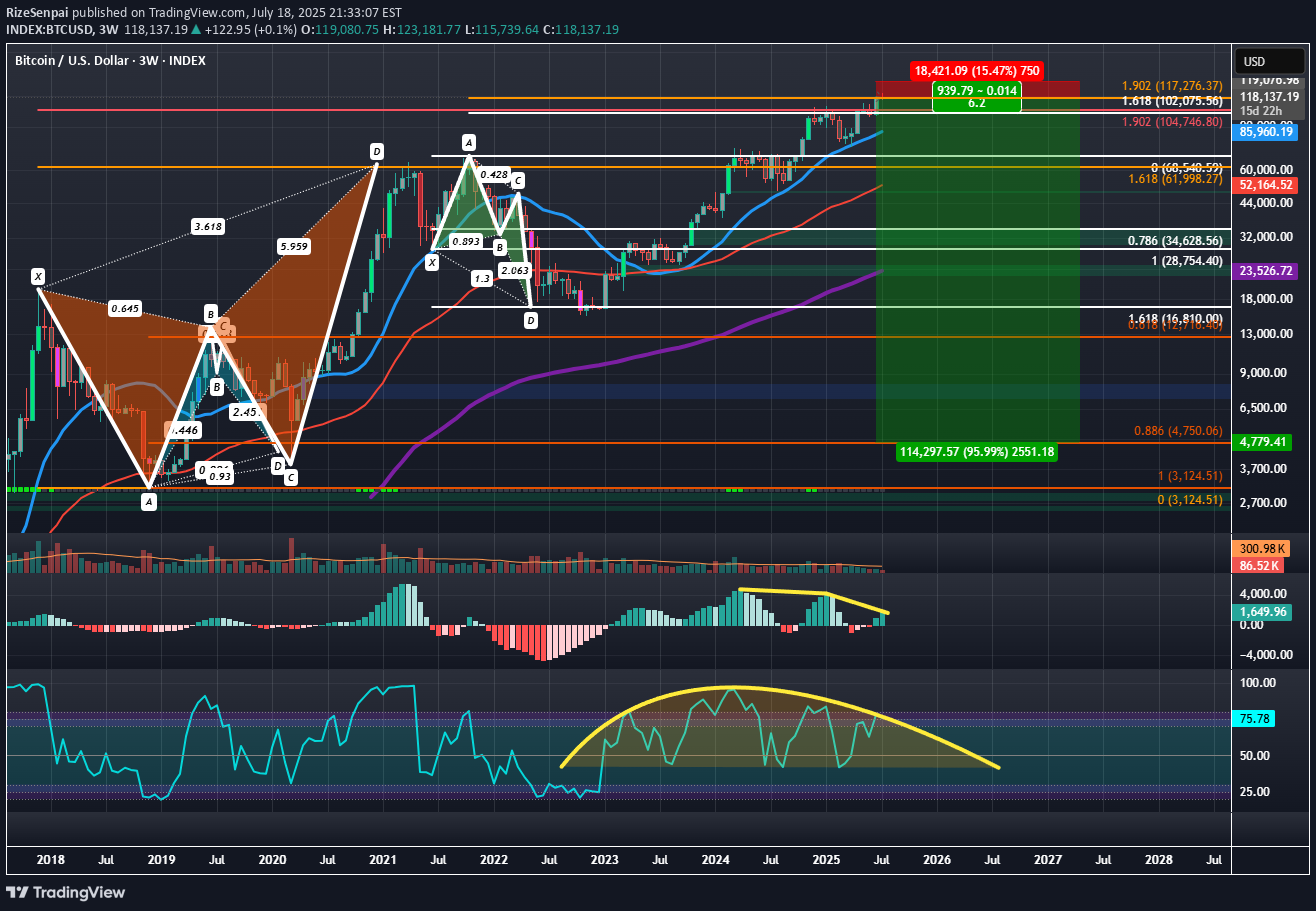
Bitcoin has been setting up at the log adjusted 1.902 HOP for a Type 2 retest of the Logscale Bearish Butterfly for the last few months but recently pushed a bit above it and appears to be settling at the linear 1.902 HOP of the local price around the $118,000 area. Between $104,000 and $118,000 is a zone of linear of logscale Fibonacci confluence pointing towards the being the area to look for a more major downside reaction than we got off the initial Type 1 Reaction 1.618 PCZ reversal in 2021. The most recent push to the linear 1.902 seems to have allowed the structure of the RSI to develop a more Bearishly Distributive and Divergent curve, while the MACD is in the process of developing a 2nd layer of Bearish Divergence. Ultimately at these highs we'd like to see the RSI weaken further as price begins to settle back within the 1.902 bearish zone of confluence before being more sure of downside. Additionally, during the push higher, longer dated bearish call interest came in around the 123-125k levels which to me signals a newly formed hard resistance that will be hard to gap over and will make failure here more likely. I think if we do see failure we can of course fill the CME gap down at 91.8k, but ultimately the true first target is down at 30k with max targets down near the 0.886 around $4.8k and the 100 percent retrace down at around $3,123.51 over the coming quarters. Taking into account the wide range in downside exposure I think the best and safest way to speculate on this downside would be through the buying of the March, 27th, 2026 Puts at the $95,000 strike or the closest IBIT equivalent March, 20th, 2026 Puts at the 58 strike this will give plenty of time, as well as plenty of range for the puts to appreciate 10's of thousands of dollars in value as BTC trades down into the targeted zones below it.
RizeSenpai
ETHUSD: Double Top into A Bearish 5-0 Breakdown (Continued...)
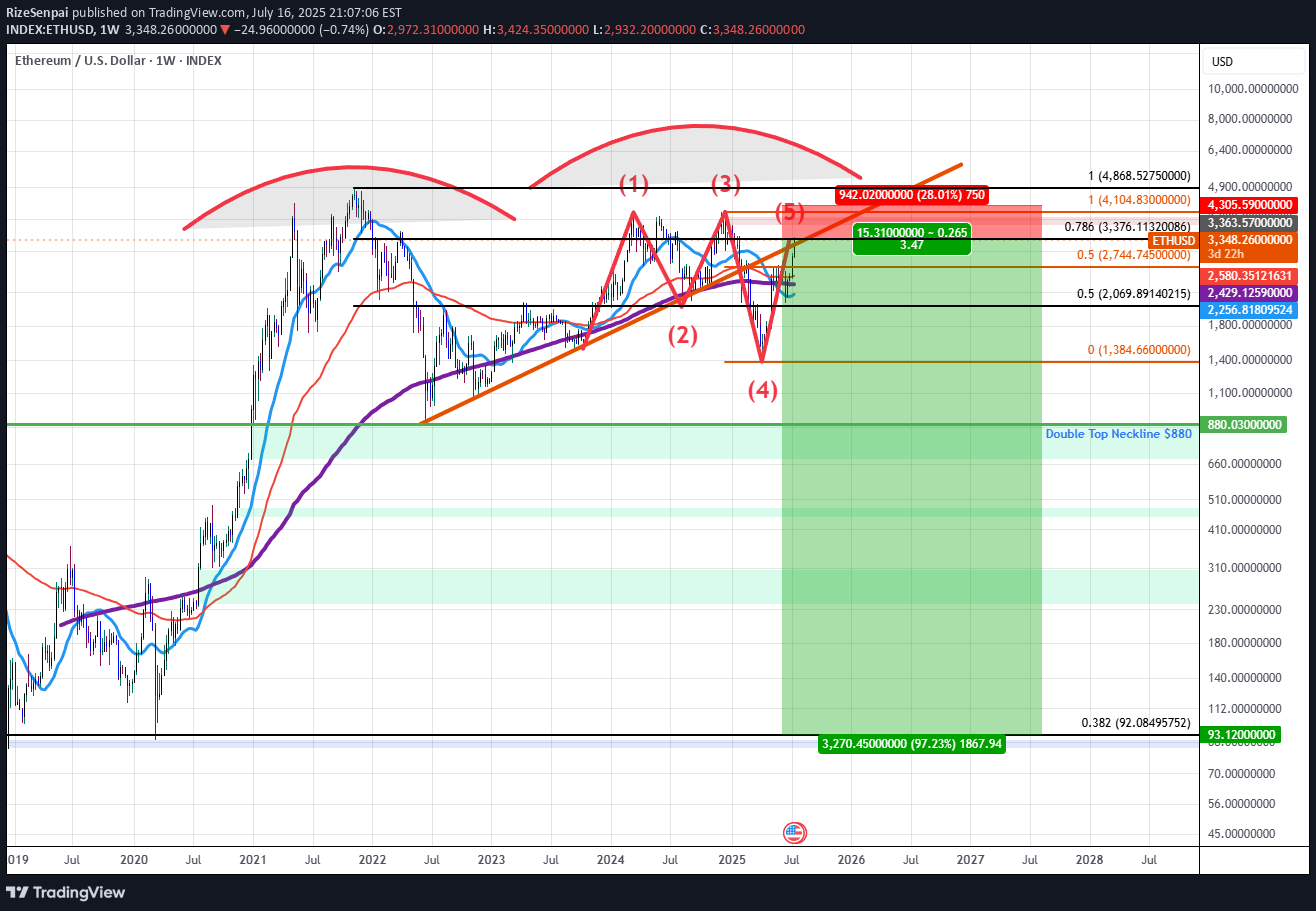
Updated Commentary: ETH has extended a bit further than projected as the Pattern Completed at the 0.618 but ETH gapped into the 0.786 instead. The gap up aligned with an upside gap fill on the CME futures as well as a gap fill on the grayscale ETH futures ETF $ETHE. The easier move from here to simply add to the ETH shorts and adjust the stop to be above the previous highs while sizing up at the 0.786 and playing off this gap higher as an anomaly. Beyond this, my view on ETH at the current 0.786 retrace remains the same as the original Idea posted as ETH rose into the initial 0.618 PCZ the details of which I will also include once again below as it still remains relevant. ETH for the last 5 years has been developing a Double Topping pattern which has put in a series of lower highs during the most recent 2nd run up. As we've confirmed these lower highs we've broken down below trendline and are finding resistance at the trendline which happens to have confluence with the PCZ of a Bearish 5-0 wave formation near a 0.786 retrace. As we begin to find weakness and Bearish price action begins I suspect price will make it's way towards the neckline of the double top aligning with the $880 price level if ETH breaks below that level there will be no significant support until it reaches the all-time 0.382 retrace down at around $92.10. In short it seems ETH is in the early stages of a macro breakdown which could result in value declines greater than 80%. I also suspect that we will see many of the assets that ran up significantly going into this week to sharply reverse those run-ups as this week comes to a close and the new week begins mainly due to the effects of OpEx, this includes: Bitcoin, MSTR, SOL, XLC, META, and BTBT. Long-dated Put accumulation on these assets at these levels is far easier to manage than naked short positions and that's how I will go about positioning here.
RizeSenpai
ETHUSD: Double Top into A Bearish 5-0 Breakdown

ETH for the last 5 years has been developing a Double Topping pattern which has put in a series of lower highs during the most recent 2nd run up. As we've confirmed these lower highs we've broken down below trendline and found resistance at the trendline which happens to have confluence with the PCZ of a Bearish 5-0 wave formation. As we begin to find weakness and Bearish price action begins I suspect price will make it's way towards the neckline of the double top aligning with the $880 price level if ETH breaks below that level there will be no significant support until it reaches the all-time 0.382 retrace down at around $92.10. In short it seems ETH is in the early stages of a macro breakdown which could result in value declines greater than 80%.
RizeSenpai
Bearish Logscale Butterfly T2 with Bearish MACD & RSI Divergence

Bitcoin appears to be set up at the 1.902 HOP for a Type 2 retest of the Logscale Bearish Butterfly that resulted in a major Type 1 reaction from the 1.618 Fibonacci Extension back in 2021, where it dropped from $69,000 to $15,500 over the course of several months before ultimately bottoming at the PCZ of a smaller Log Scale Bullish Butterfly which signaled the Type 2 run up to the 1.902 HOP of the Bearish Butterfly where it is now. As it tests this level the MACD and RSI are both Diverging Bearishly and the RSI especially seems weak as it now struggles to even crack above 70 level. This signals to me that the RSI has confirmed exhaustion after divergence at the HOP and that it is likely ready to start declining further. Saying as though this is the type 2 test, I'd suspect that we'd make a lower low than our previous Type 1 reaction low at $15k, perhaps landing us around $12-10k; but if those levels don't hold It would be technically viable to assume BTC would go for the 0.886 retrace at around $4.6k
RizeSenpai
JASMYUSDT Bull Flag Breakout Targeting 1.618 Fibonacci Extension

JASMY is currently breaking free from what appears to be a tight Bull Flag that it's formed at the locals highs. A move above the consolidation zone could take JASMY to extremely higher highs as beyond 4.9 cents lies no resistance at all and only a history of moving straight up and down which can be seen on the older spot chart of this coin. With that in mind, one would think it could trade as high as 2 dollars if the resistance were to break.
RizeSenpai
BTC Looking to Rise Against The SPX with Inflation Expectations

It is sort of starting to look like Bitcoin will soon start to move inverse to the SPX and become more positively correlated with a Defensive Asset or Inflation Hedge which would mean we could see BTC more than double in value against the SPX as the BTCUSD pair starts to trade similarly to Cocoa or OJ futures once it breaks out above the resistance.
RizeSenpai
PERPUSDT: Bullish Engulfing at 200 Moving Average and Support

PERP has Bullishly Engulfed above a major Support/Resistance Level and looks to be forming a Double Bottom of sorts with Bullish Divergence on the MACD. If it plays out we could very well see higher highs and may actually see a macro Bullish Breakout of an even bigger pattern of higher lows and higher highs on the Weekly, but for the time being I'd just want it to try to recover the range highs of the daily Double Bottom.
RizeSenpai
NEOUSD: Breaking Above the 0.886 within a Massive Double Bottom

NEO has formed a massive Double Bottom structure that has been in development since late 2018 and now nearly 6 years later is attempting to NEO has once again claimed the 21-Month SMA as support and aims to break back above the 0.886 Fibonacci Retrace. If it is successful in this we could see this be the start of a massive move to the upside, capable of taking it all the way up to as high as $140 a maybe even higher after that, though there may be a bit of resistance up at $56 level first as that aligns with the 0.618 and historical horizontal resistance.
Disclaimer
Any content and materials included in Sahmeto's website and official communication channels are a compilation of personal opinions and analyses and are not binding. They do not constitute any recommendation for buying, selling, entering or exiting the stock market and cryptocurrency market. Also, all news and analyses included in the website and channels are merely republished information from official and unofficial domestic and foreign sources, and it is obvious that users of the said content are responsible for following up and ensuring the authenticity and accuracy of the materials. Therefore, while disclaiming responsibility, it is declared that the responsibility for any decision-making, action, and potential profit and loss in the capital market and cryptocurrency market lies with the trader.